3.1 Identification of a list of prognostic related DE-MRGs
The detailed flow chart for the prognostic predictive model construction in this study was shown in Figure 1. From the metabolism pathways of KEGG database, we extracted a total of 944 metabolism-related genes. After the integration of expression data regarding such MRGs expression from 552 TCGA EC cancerous and 35 non-tumor samples, we obtained 156 up-regulated and 64 down-regulated MRGs. Univariate Cox regression analysis identified 47 genes significantly correlated to EC patients' OS (Figure 2B and Table 1). The expression pattern of 47 prognostic related MRGs was shown in the heatmap and box plot (Figure 2C-D).
|
Table1 Univariate Cox regression identified 20 MR-DEGs correlated to endometrial cancer patients' OS
|
|
Gene ID
|
HR
|
HR.95L
|
HR.95H
|
P-value
|
|
CYP4F3
|
1.19013465
|
1.08676961
|
1.303330965
|
0.000173367
|
|
PHGDH
|
1.02042871
|
1.009021493
|
1.031964888
|
0.000422248
|
|
GPX2
|
1.002979902
|
1.001288036
|
1.004674627
|
0.000551669
|
|
CKMT1B
|
1.223457962
|
1.083264863
|
1.381794458
|
0.001162169
|
|
CEL
|
1.008855015
|
1.003431253
|
1.014308094
|
0.001348837
|
|
DDC
|
1.098684916
|
1.0372027
|
1.16381161
|
0.001359205
|
|
KHK
|
1.189854228
|
1.067798895
|
1.325861162
|
0.001644451
|
|
LYPLA2
|
1.019470527
|
1.006509657
|
1.032598294
|
0.003137784
|
|
ACACB
|
1.834694401
|
1.218329674
|
2.762883985
|
0.003667941
|
|
ASNS
|
1.052124561
|
1.015433759
|
1.090141116
|
0.00502135
|
|
GPAT3
|
1.104677229
|
1.028736495
|
1.186223863
|
0.006151058
|
|
CKMT1A
|
1.256355384
|
1.059829197
|
1.489323803
|
0.008551614
|
|
CKM
|
1.141628713
|
1.031351441
|
1.263697383
|
0.01060172
|
|
UCK2
|
1.035172213
|
1.007976028
|
1.063102178
|
0.010933586
|
|
HNMT
|
0.861666359
|
0.760829865
|
0.975867206
|
0.019044088
|
|
SAT1
|
0.997992548
|
0.996252269
|
0.999735867
|
0.024031622
|
|
B4GALT1
|
0.995107725
|
0.990877644
|
0.999355864
|
0.024044249
|
|
GLB1
|
0.971544079
|
0.946835378
|
0.996897579
|
0.028065649
|
|
PSAT1
|
1.007191289
|
1.000533596
|
1.013893283
|
0.034207771
|
|
PFKM
|
1.087927137
|
1.004895375
|
1.177819587
|
0.037477496
|
|
Abbreviation: MR-DEGs: metabolism-related differentially expressed genes; OS: overall survival; HR: Hazard ratio.
|
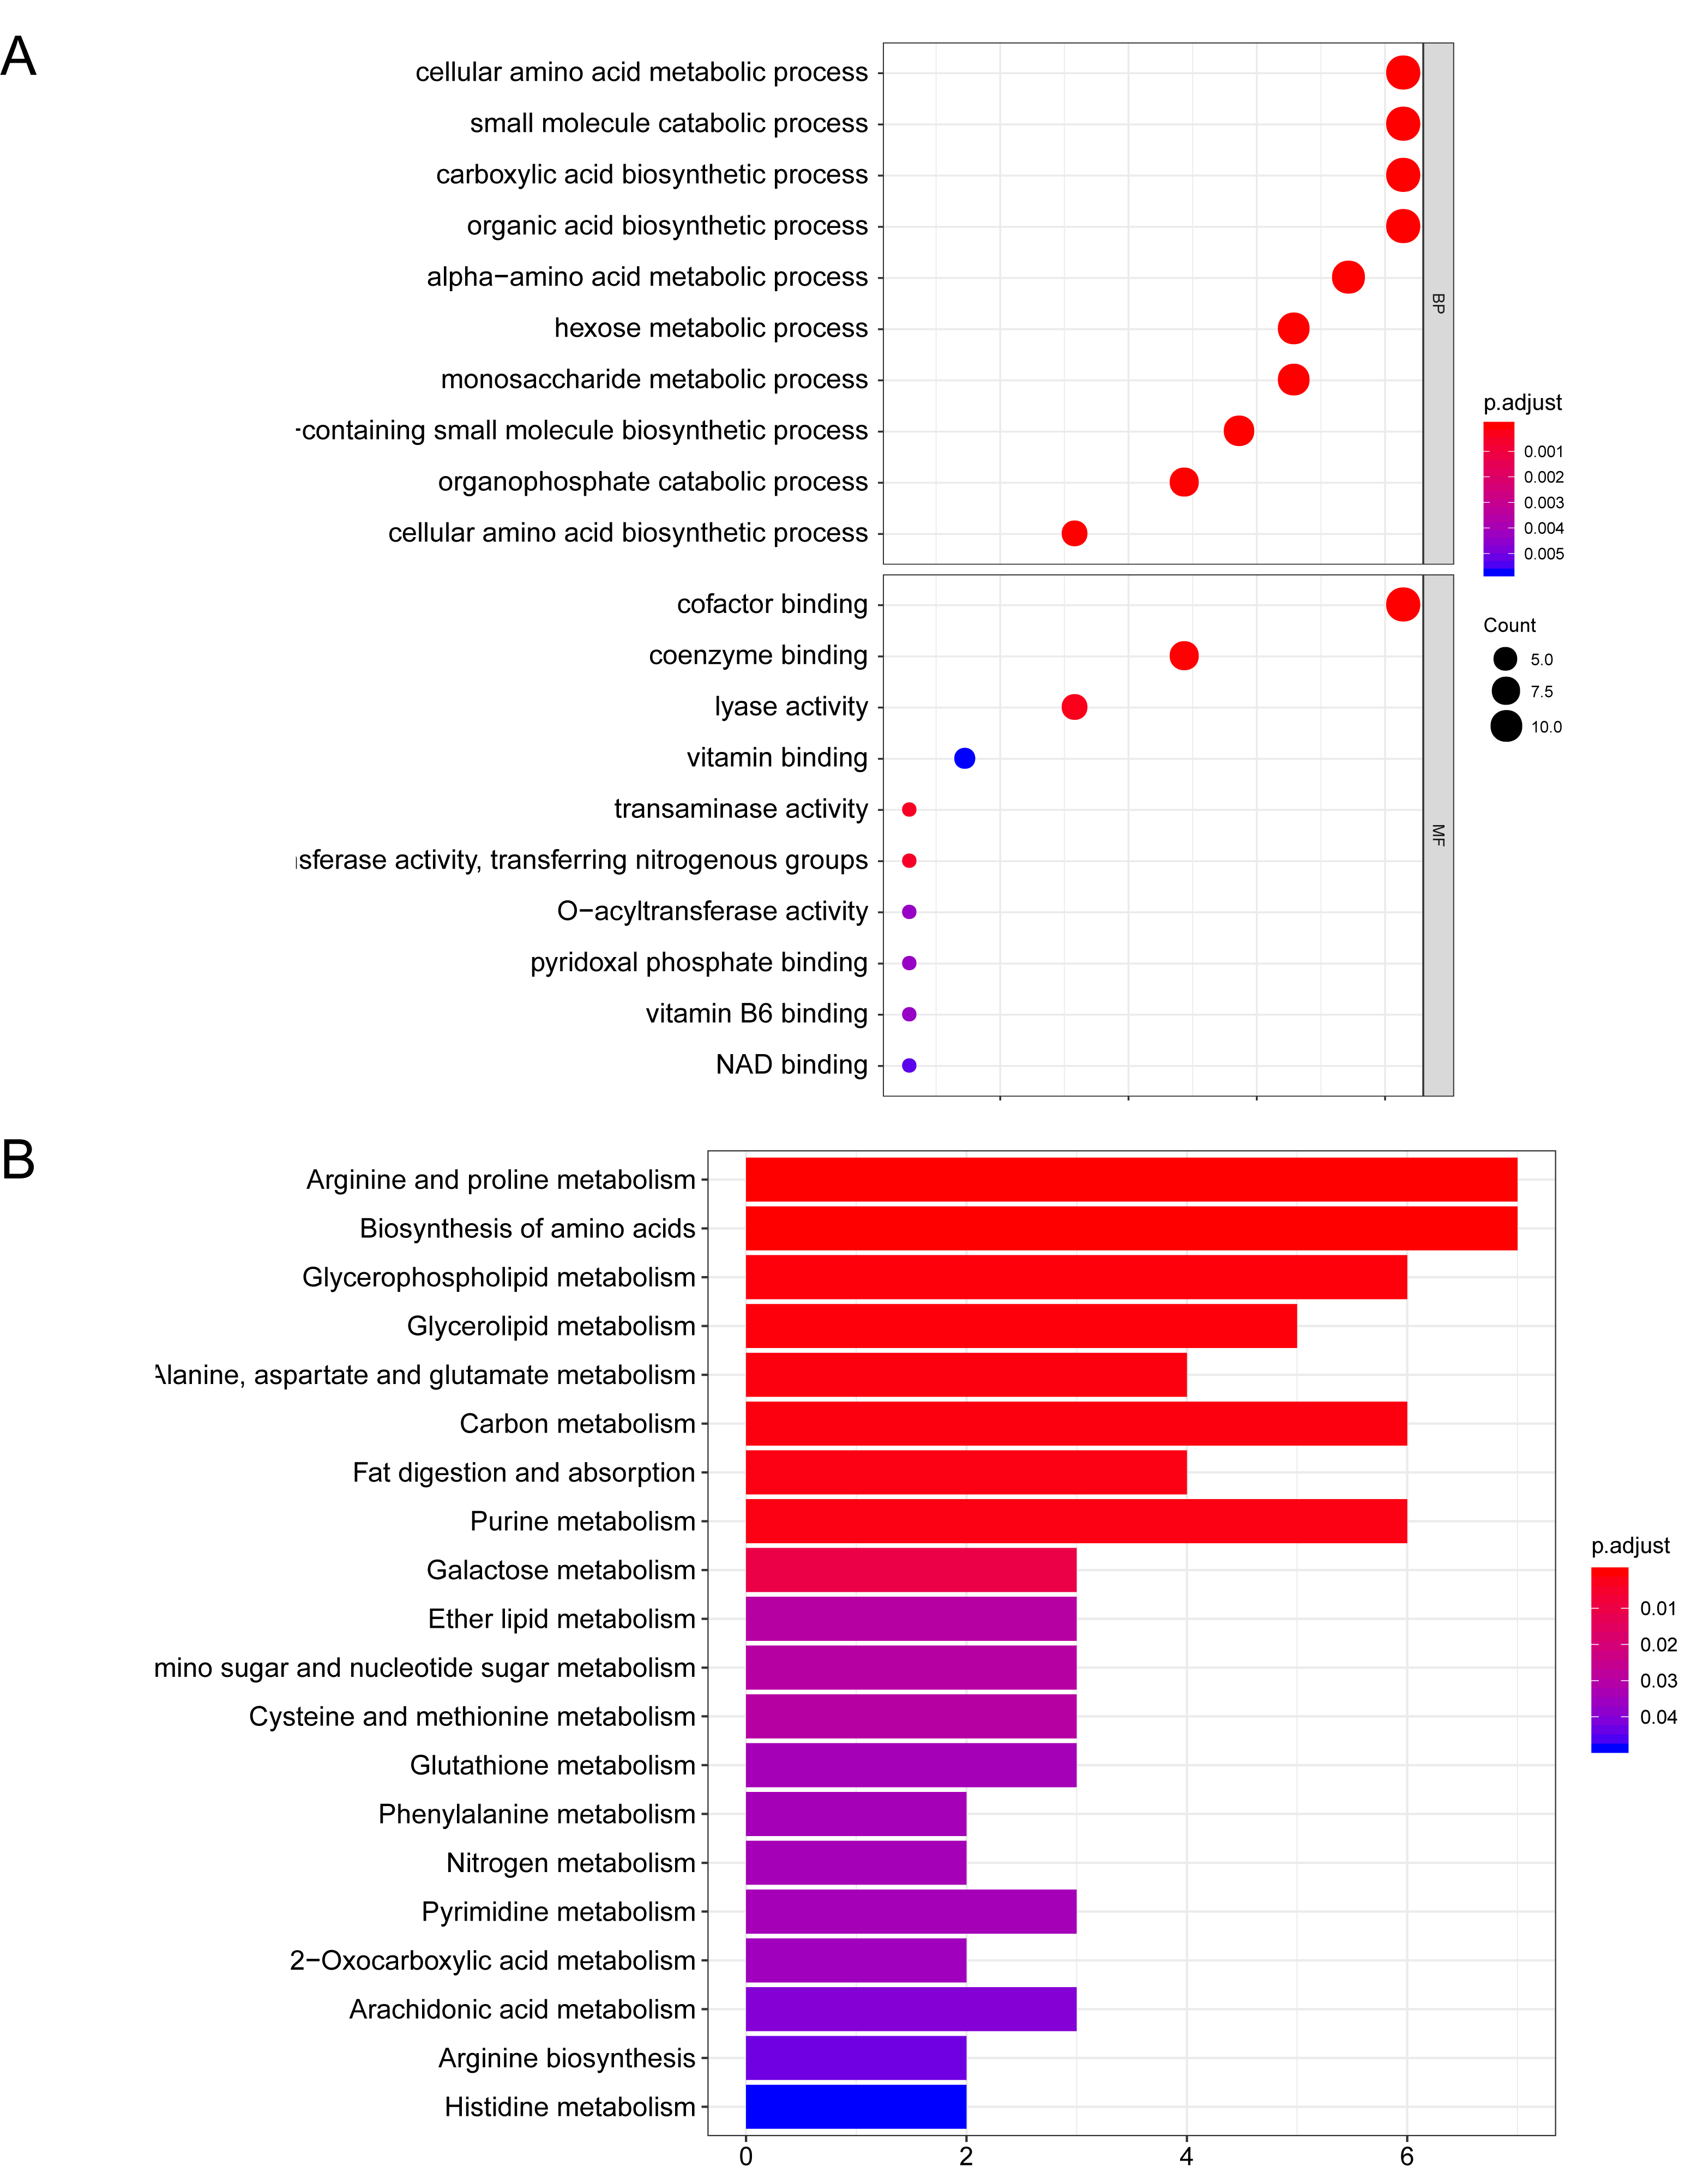
3.2 Functional enrichment of the prognostic related DE-MRGs
Function annotation analysis regarding the 47 DE-ARGs was then performed. GO enrichment showed that the MRGs were mainly involved in "carboxylic acid biosynthetic process ", "cofactor binding ", "alpha-amino acid metabolic process " and "cellular amino acid metabolic process" (Figure 3A). The enriched GO terms and related genes expression profile were presented in Figure 3B. KEGG pathway enrichment presented that DE-MRGs were mainly involved in "Purine metabolism", "Biosynthesis of amino acids", "Glycolysis / Gluconeogenesis" and "Glycerophospholipid metabolism" (Figure 4A). The expression level of correlated genes in the enriched KEGG pathways are displayed in the heatmap (Figure 4B).
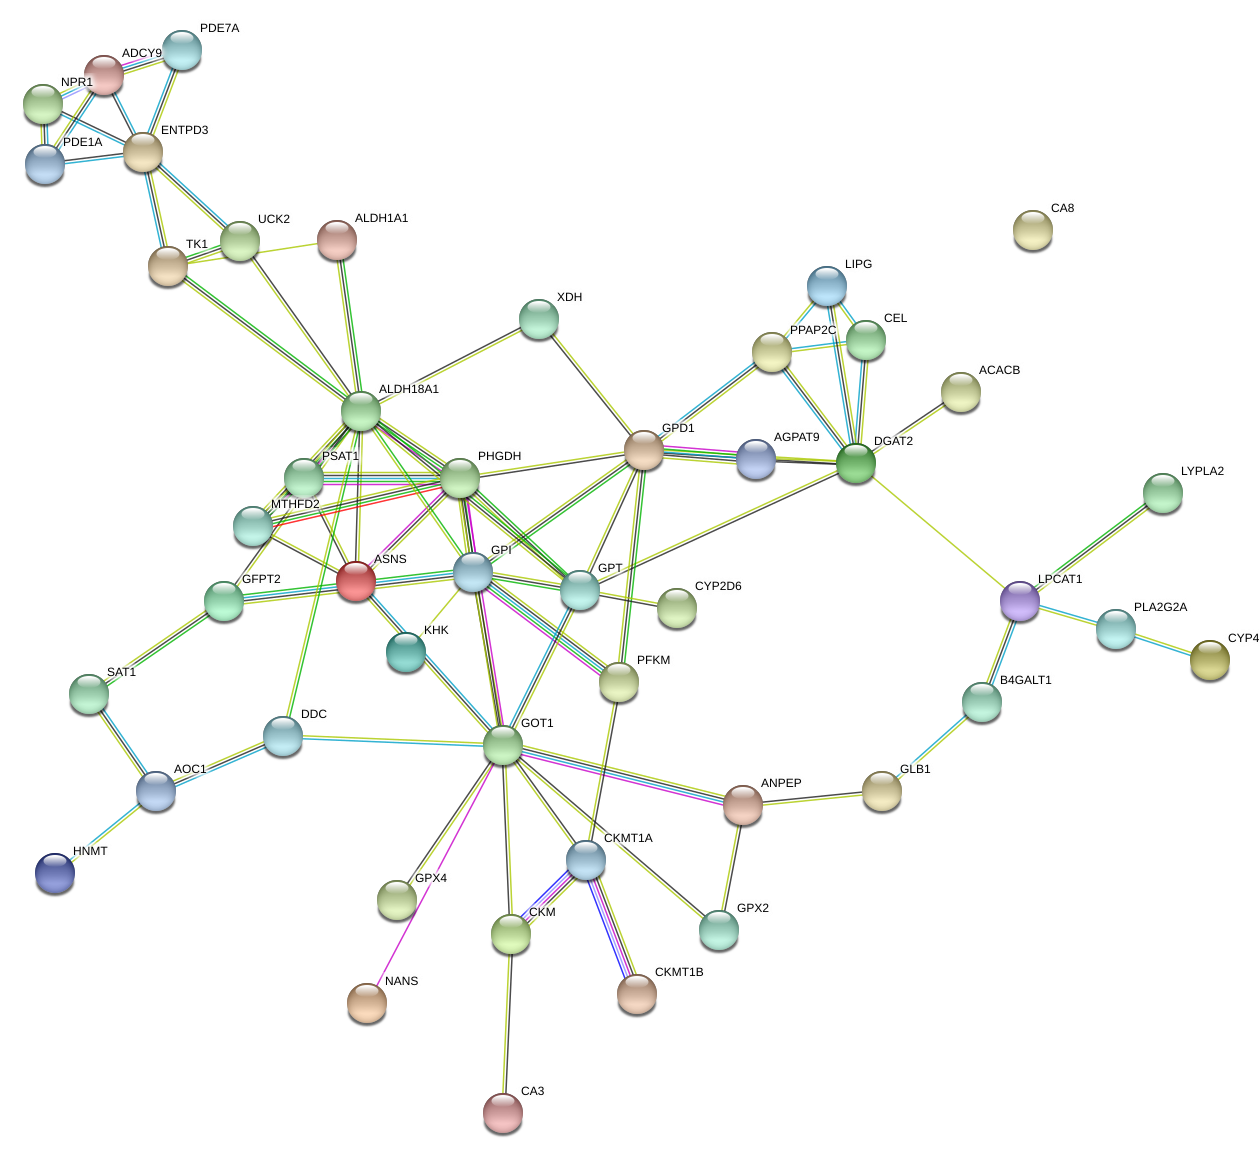
3.3 The PPI network of 47 prognostic related DE-MRGs and hub gene alteration analysis
Through the STRING website, we built a PPI network among 47 DE-MRGs (Supplementary figure 1). There were 47 nodes and 81 edges included in the network based on the interaction score criteria. Top 15 hub genes with the highest connectivity degrees in the string network were selected as follows: ALDH18A1, GOT1, DGAT2, GPD1, GPI, PHGDH, GPT, ENTPD3, ASNS, ADCY9, CKMT1A, LPCAT1, MTHFD2, PPAP2C and PSAT1 (Figure 5A-B). The alteration results of the hub genes showed that GPI, GPT, ADCY9, and LPCAT1 ranked as the most frequently altered genes. GPI, GPT, and LPCAT1 were frequently over-amplified among endometrial cancer patients while ADCY9 more often occurred with a missense mutation (unknown significance) (Figure 5C).
3.4 Identification of a nine DE-MRGs based prognostic model
Next, we randomly divided the 541 TCGA EC patients into the training cohort (n = 272) and the testing cohort (n = 269). Lasso and multivariate cox regression analysis picked out 9 genes significantly associated with prognosis, which are CYP4F3, CEL, GPAT3, LYPLA2, HNMT, PHGDH, CKM, UCK2 and ACACB (Figure 6 and Table 2). According to the results of multivariate Cox regression analysis, we constructed the prognostic model as follows: risk score = (0.110103 × expression value of CYP4F3)+ (0.013456 × expression value of CEL) + (0.104444× expression value of GPAT3) + (0.017777 × expression value of LYPLA2) + (-0.10986 × expression value of HNMT)+ (0.017183 × expression value of PHGDH)+ (0.200964 × expression value of CKM)+ (0.051913 × expression value of UCK2)+ (0.634313 × expression value of ACACB).
Based on the mean risk score from the training cohort, patients were divided into high-risk (n=136) and low-risk (n=136) subgroups. Each individuals' risk score distribution and survival status were ranked and displayed on the dot plot, which showed a significant discrepant OS (Figure 7A-B). Likewise, the Kaplan-Meier curve analysis demonstrated that the OS of the higher-risk group was significantly shorter than the low-risk group (P =1.971e-06) (Figure 7D). The expression profile of 9 prognostic DE-MRGs showed that UCK2, PHGDH, ACACB, LYPLA2, CYP3F3, GPAT3, CEL, and CKM expressed higher in the high-risk subgroup, while HNMT presented otherwise (Figure 7C). ROC curve analysis revealed the area under the ROC curve (AUC) of the prognostic MRGs model was 0.771 (Figure 7E).
|
Table2 Multivariate Cox regression selected 9 MR-DEGs correlated to endometrial cancer patients' OS
|
|
Gene ID
|
HR
|
HR.95L
|
HR.95H
|
P-value
|
|
CYP4F3
|
1.116392881
|
0.99351779
|
1.25446477
|
0.064219393
|
|
CEL
|
1.013547388
|
1.007787405
|
1.019340292
|
3.69768E-06
|
|
GPAT3
|
1.110093426
|
1.006471947
|
1.224383272
|
0.03670839
|
|
LYPLA2
|
1.017935764
|
1.003942684
|
1.03212388
|
0.011831278
|
|
HNMT
|
0.895961269
|
0.77990526
|
1.029287321
|
0.1206327
|
|
PHGDH
|
1.017331051
|
1.003306749
|
1.031551385
|
0.015262521
|
|
CKM
|
1.222580744
|
1.097931508
|
1.36138153
|
0.00024948
|
|
UCK2
|
1.053283808
|
1.024064937
|
1.083336359
|
0.000298414
|
|
ACACB
|
1.885726048
|
1.129790043
|
3.147454476
|
0.015230463
|
|
Abbreviation: MR-DEGs: metabolism-related differentially expressed genes; OS: overall survival; HR: Hazard ratio.
|
3.5 Validation the efficacy of the 9 MRGs prognostic signature
The risk model was then introduced into the testing and entire cohort, and each individuals' risk score was calculated. Based on the training cohort' cut-off risk score, we divided the testing cohort into 121 high-risk and 148 low-risk individuals. Following the results from the training cohort, the survival status (Figure 8A), survival time (Figure 8B) and KM curve analysis of high-risk subgroup presented worse outcomes compared to the low-risk subgroup in the testing cohort with shorter overall survival time(P =4.151e-04)(Figure 8D). The expression pattern of 9 MRGs was consistent with the training cohort (Figure 8C) and the AUC of the risk model in the testing cohort was 0.796 (Figure 8E). As for the entire cohort, similar results were also observed. Low-risk subgroup presented longer survival time and better survival status (Figure 9A-B). Kaplan-Meier curve analysis presented that low-risk subgroup followed with longer OS (P =1.242e-08) (Figure 9D) and ROC curve analysis showed the AUC of the model was 0.78 (Figure 9E).
3.6 Validation the expression level of 9 MRGs in clinical samples
The expression signature of 9 MRGs were subsequently explored in 30 endometrial cancer clinical specimens. Results demonstrated that UCK2, PHGDH, ACACB, LYPLA2, CYP3F3, GPAT3, CEL, and CKM overexpressed in cancerous tissues while HNMT showed otherwise, which were in accordance with above findings (Figure 10A-I).
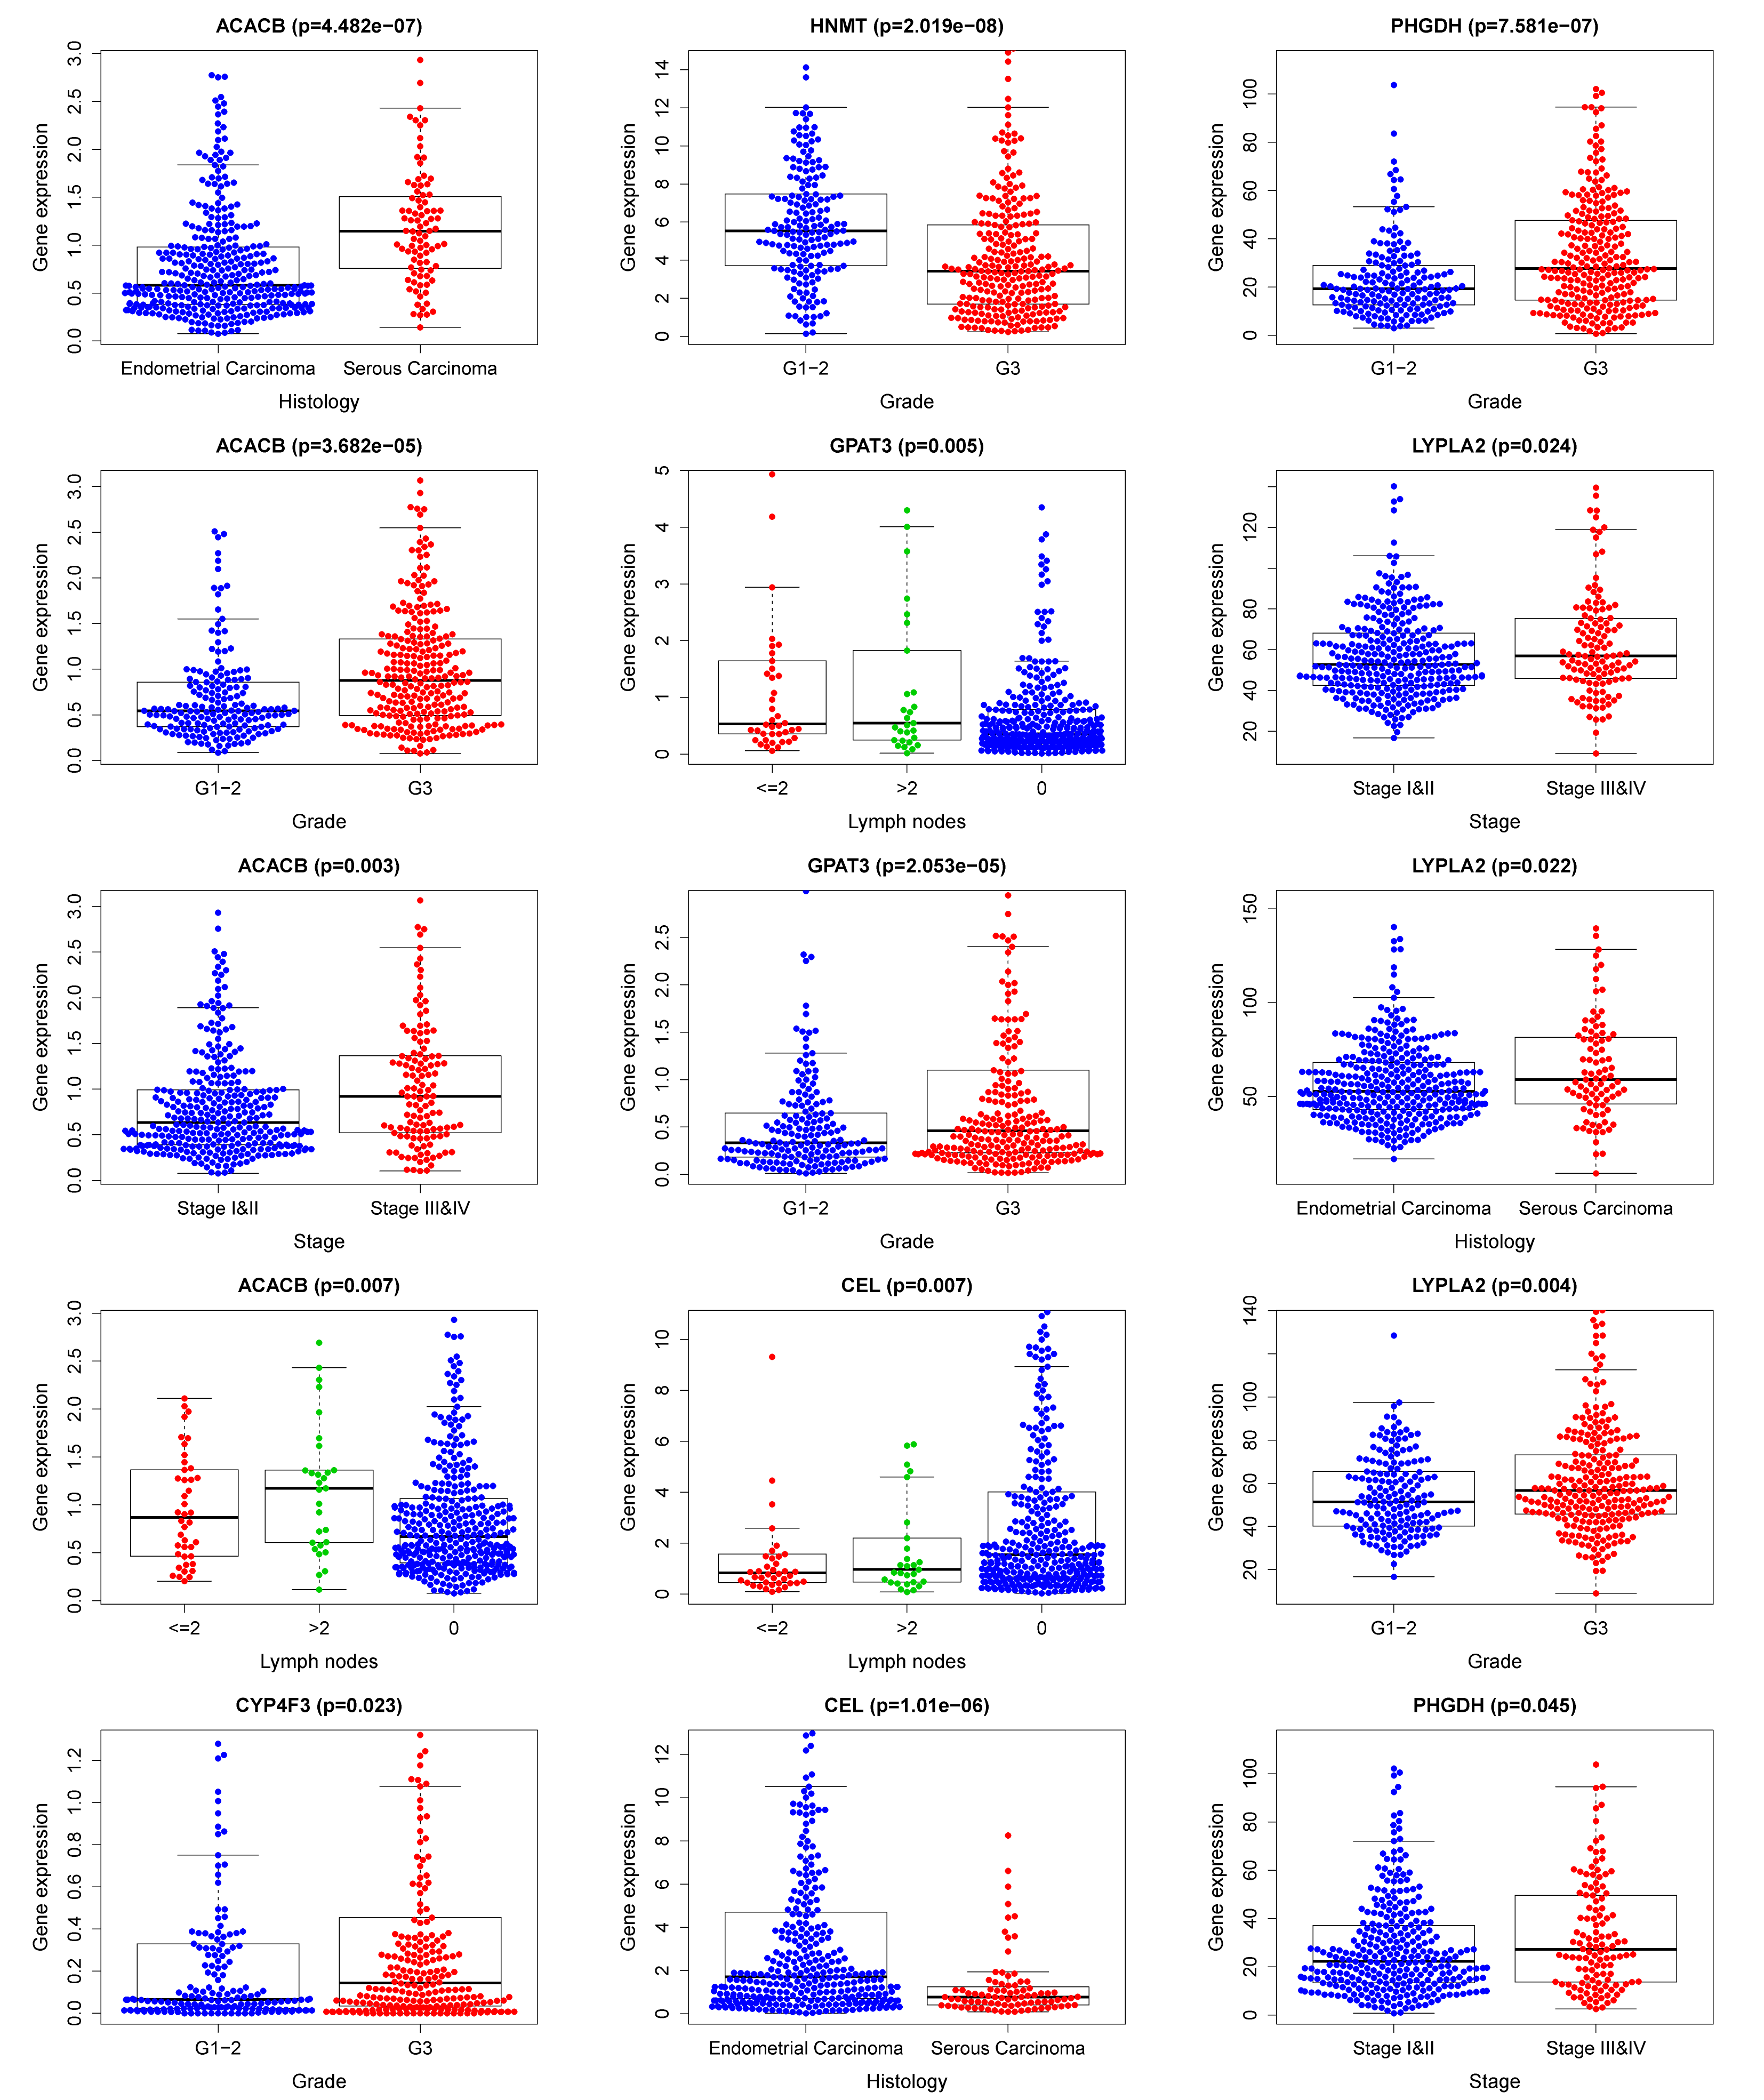
3.7 The clinical independence and correlation estimation of the risk signature
Then, we combined the risk model with other clinical factors and performed univariate and multivariate analyses to exam the clinical independency of the model. Results showed that the model was able to serve as an independent prognostic indicator (both P<0.001) (Figure 11A-B). The AUC value of the prognostic model was 0.781, significantly higher than patients’ age (AUC= 0.535) and weight (AUC= 0.633), clinical-stage (AUC= 0.710), tumor grade (AUC= 0.656) and histology (AUC= 0.522), as well as lymph node status (AUC= 0.697)(Figure 11C). Next, we enrolled in the risk scores, the clinical features, and the nine gene expression profiles of EC patients and displayed them in the heatmap (Figure 11D). Interestingly, the clinical characteristics of patients were highly in accordance with the risk level calculated from the model. High-risk subgroup patients were accompanied by late-stage, high grade, serous carcinoma, and more metastatic lymph nodes (Figure 11D-E), which all presented worse outcomes. The correlation between each gene from the prognostic model and the patients' clinical features were also measured. PHGDH, ACACB, HNMT, CYP4F3, and LYPLA2 were shown to significantly associated with patients' prognosis (Figure 11F). Other clinical features of each prognostic MRGs from the signature were presented in Figure S3.
3.8 Nomogram building and validation
Based on patients' risk scores and clinical features, we built a comprehensive prognostic nomogram to estimate EC patients' survival probability for 5 years based on the TCGA entire set. Seven independent prognostic parameters, including metabolic risk signature and age, grade, weight, histology, stage as well as lymph node status, were integrated into the nomogram (Figure 12A). The calibration plots show excellent consistency between the nomogram prediction and actual observation in terms of the 3- and 5-year survival rates in the TCGA cohort (Figure 12B-C).