3.1. Solution State Studies
3.1.1 Physical Composition of CT Complex
The stoichiometric ratio of the CT complex was calculated at 450 nm [21] in MeOH medium (Fig. 1a) using Job's approach. The greatest absorbance was achieved at a 0.5 mole portion, signifying that the stoichiometry of the complex is 1:1 [(MHQ):(DNP)]. In Fig. 1b, we see the photometric titration curve in MeOH, as described in [22]. The data indicate that the [(MHQ):(DNP)] complex has a 1:1 molar ratio.
3.1.2 Observation of the CT Band.
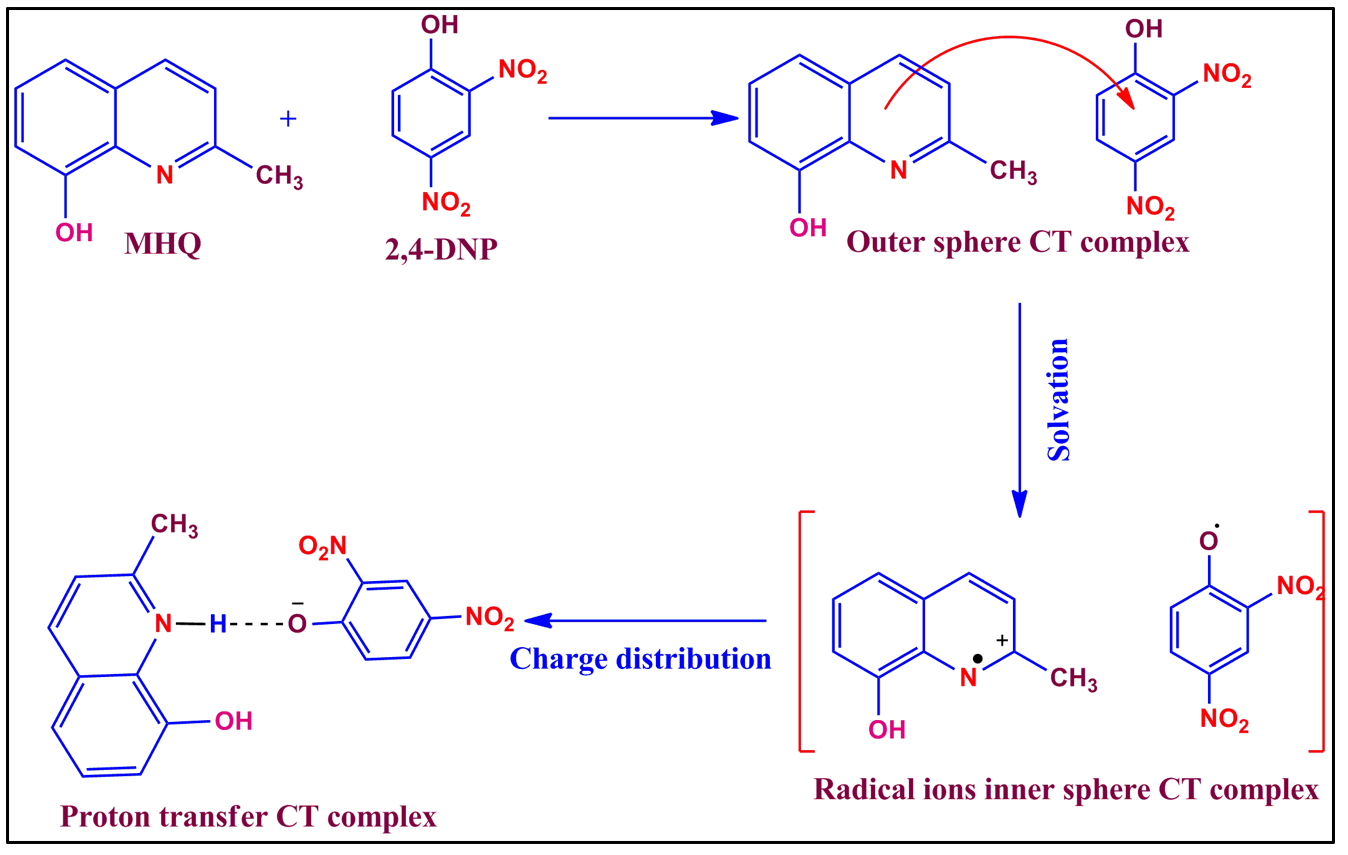
Fig. 2 illustrates the UV-visible spectrum of the MHQ, DNP and CT complex which have been acquired in MeOH in the 200 to 700 nm range. In regions where neither the acceptor nor the donor solution absorbed light, a significant colour change and the appearance of new bands occurred upon mixing the two solutions. Two charge transfer bands in MeOH at 450 and 345 nm were included in the complex spectra, and the peak with the highest wavelength was identified as the CT peak [23]. As a direct consequence of this, the CT complex was able to form between MHQ and DNP as depicted in Scheme 1. As seen by the appearance of a new CT band, a lone pair has been moved from MHQ to DNP. This can be seen as evidence of the transfer. The development of hydrogen bonds between MHQ and DNP is responsible for this interaction.
3.1.3 Association constant (KCT), Molar Absorptivity (ɛCT)
Calculation of the [(MHQ):(DNP)] molar absorptivity (εCT) and association constant (KCT) at room temperature was performed with the use of the Benesi-Hildebrand equation [24], which was based on the spectral information shown in Table 1.
Table 1
Benesi-Hildebrand data for 1:1 CT complex at 25\(℃\)
|
Ca
|
Cd
|
A
|
CaCd/A
|
Ca+Cd
|
(CaCd/A)×106
|
(Ca+Cd)×103
|
|
25°C
|
|
|
|
|
|
|
|
0.001
|
0.005
|
0.791
|
6.32×10⁶
|
0.006
|
6.32
|
6
|
|
0.001
|
0.0045
|
0.763
|
5.89×10⁶
|
0.0055
|
5.89
|
5.5
|
|
0.001
|
0.004
|
0.716
|
5.58×10⁶
|
0.005
|
5.58
|
5
|
|
0.001
|
0.0035
|
0.699
|
5×10⁶
|
0.0045
|
5
|
4.5
|
|
0.001
|
0.003
|
0.665
|
4.51×10⁶
|
0.004
|
4.51
|
4
|
|
0.001
|
0.0025
|
0.648
|
3.85×10⁶
|
0.0035
|
3.85
|
3.5
|
|
0.001
|
0.002
|
0.618
|
3.23×10⁶
|
0.003
|
3.23
|
3
|
|
0.001
|
0.001
|
0.489
|
2.04×10⁶
|
0.002
|
2.04
|
2
|
| Ca ~ concentration of acceptor in mol.L− 1 |
| Cd~ concentration of donor in mol.L− 1 |
$$\frac{{\text{C}}_{\text{a}}{\text{C}}_{\text{d}}}{\text{A}}=\frac{1}{{\text{K}}_{\text{C}\text{T}}{\epsilon }}+\frac{({\text{C}}_{\text{a}}+{\text{C}}_{\text{d}})}{{\epsilon }}$$
1
In Eq. (1), A is the [(MHQ):(DNP)] absorbance at 450 nm in MeOH, Cd and Ca are the preliminary concentrations of MHQ (changeable) and DNP (unchanging), correspondingly. A straight line was produced when Ca×Cd106 values were plotted in opposition to (Ca+Cd), showing the generation of a 1:1 complex (Fig. 3). Table 2 displays the formation constants, extinction coefficients and wavelengths for molecules. Both the high molecular extinction coefficient and association constant indicate that the CT-complex is exceptionally stable.
Table 2
Formation constants, molecular extinction coefficients and other physical parameters of CT complex
|
Solvent
|
λmax (nm)
|
KCT×102 (L mol− 1)
|
ɛCT×102
(L.mol− 1cm− 1)
|
-∆G°
(kJ/mol)
|
ECT
(eV)
|
W
(eV)
|
ID
(eV)
|
ƒ
|
RN
|
|
MeOH
|
450
|
5.25
|
99.60
|
-21.20
|
2.76
|
34.8
|
39.5
|
3.14
|
0.788
|
3.1.4 Estimation of Physical Parameters
Spectroscopic physical parameters of [(MHQ):(DNP)] were generated and studied through electronic spectral research. The equations are summarised here.
(i) Dissociation Energy (W)
Using the following equation [25], we were able to determine the complex dissociation energy (W). This was obtained by calculating the ECT, ID and EA of the acceptor and donor respectively.
W = ID-EA-ECT (2)
(ii) Ionisation Energy (Ip)
According to Aloisi and Piganatro [26], the CT complex ionisation energy (IP) in MeOH solvent was determined using the following equation.
IP= 5.76 + 1.53×10− 4νCT (3)
(iii) Calculation of ECT
In order to calculate the donor-acceptor association energy (ECT), the equation developed by Briegleb and Angew [25] was utilised.
ECT= 1243.667/λCT (4)
(iv) Resonance Energy (RN)
According to (Czekalla and Brieglb) [27], the complex resonance energy (RN) in MeOH was computed.
$${{\epsilon }}_{\text{C}\text{T}}= \frac{7.7\times {10}^{4}}{{\text{h}}_{\text{C}\text{T} }/\left[{\text{R}}_{\text{N}}\right]- 3.5}$$
5
(v) Gibbs Free Energy (∆G°)
The following equation [25] was used to determine the complex standard Gibbs free energy change (∆G°). All physical dimensions are given in inches (Table 2).
∆G°= -RT ln KCT (6)
(vi) Calculation ofƒ
The oscillator strength (ƒ), a dimensionless quantity used to predict the CT band transition probability, can be determined by using the subsequent equation [28].
ƒ= 4.32×10− 9 [εmax. ∆ν1/2] (7)
3.2. Solid State Studies
3.2.1. SEM-EDX Study
In order to analyze the elemental composition as well as the surface morphology [10] of the [(MHQ):(DNP)], SEM-EDX analysis was utilized. Figure 4 provides a visual representation of the associated findings. The product appears to have microstructures in the form of clear sheets, as shown in the SEM photos. The elemental peaks of oxygen, nitrogen, carbon, and bromine in the EDX spectra validated the CT composition, which is shown in Table S1 along with its acceptor and donor.
3.2.2. Powder XRD study
Figure 5 shows the powder X-ray diffraction pattern that was acquired for the semicrystalline CT combination of MHQ with DNP. Based on the results of this study, it has been concluded that the newly synthesised [(MHQ):(DNP)] of acceptor and donor is semi crystalline, as evidenced by the existence of well-defined sharp Bragg Peaks at particular 2 θ angles. It was possible to find out the particle range of the complex via the Debye-Scherrer formula [16] by focusing on the line with the maximum intensity in comparison to the other lines.
D = 0.94 λ/β cos θ (8)
Where, λ is the X-ray wavelength employed (0.15406 nm), D is the crystalline size in nm, β is its full width at half maximum (fwhm), θ is the diffraction peak's position, and 0.94 is the scherrer constant. DNP, MHQ and the [(MHQ):(DNP)] complex have computed particle sizes of 14.68, 15.61, and 22.14 nm, respectively.
3.2.3. 1H NMR Spectra
As can be seen in Fig. 6, the 1H NMR spectra of the MHQ and [(MHQ):(DNP)] was recorded in DMSO-d6. Table 3 shows that the DMSO proton appears at δ = 2.5 ppm in the complex spectrum. The nature of the complex relations that take place among the donor and acceptor can be understood from the 1H NMR spectrum (Scheme 1). Confirmation of the development of the complex can be found in the emergence of new signals in the spectrum. Three protons in methyl group of quinoline are numbered one at 2.72 ppm. The peaks at 6.00 and 8.00 ppm originate from the aromatic protons of the compound. The existence of a broad resonance signal at 3.35 ppm, which is assign to the innovative centre (NH+) generated by the relocate of the phenolic proton of DNP to the pyridine ring nitrogen of MHQ, is an interesting result. The consistent of 1H NMR and IR spectra supports the proton transfer.
Table 3
The experimental infrared frequencies (cm− 1) of MHQ, DNP and CTC.
|
Assignments
|
MHQ
|
DNP
|
CTC
|
|
υ (CH) aromatic
|
2945
|
|
3031
|
|
υ (CH) aliphatic
|
2965
|
|
3096
|
|
υO−H−−−N
|
|
|
2907
|
|
υ (OH)
|
|
3364
|
|
|
υ (C = C)aromatic
|
1596
|
1556
|
1606
|
|
υ (C = N)
|
1515
|
|
1535
|
|
υ (C-C)
|
1104
|
1089
|
1129
|
|
υ (NO2)
|
|
1328
|
1372
|
|
δ(C-N)
|
1371
|
|
1304
|
|
υ (NH+)
|
|
|
1644
|
| Abbreviations: s, strong; m, medium; w, weak; υ ~ stretching, δ ~ bending. |
3.2.4. FT-IR Spectra
Figure 7 provides an illustration of the FT-IR spectral bands of the MHQ, DNP and [(MHQ):(DNP)] complex, whereas Table 4 provides a summary of the principal band assignments. Modifications in frequency and band strength were observed in the CT complex spectra as a consequence of MHQ and DNP. It causes additional charge and proton transfers to occur during complexation. The existence of both the significant IR bands of the acceptor and the donor in the spectra of the [(MHQ):(DNP)] complex sturdily favours the formation of the [(MHQ):(DNP)] complex [10]. The absence of the OH group of DNP in the formed complex, as shown in Fig. 7, is an interesting and significant observation. This nonappearance suggests that the OH group has migrated towards the basic centres of the donor MHQ in order to form hydrogen bonding proton transfer. In particular, the complex spectrum records the stretching vibrational frequencies of υ (C = C), (C-N), and (C = N) at 1606, 1304, and 1535 cm− 1 increase in complex comparison to 1596, 1371, and 1515 cm− 1 for the free MHQ. The absence of the OH of DNP at 3364 cm− 1 in the produced complex is a significant observation in Fig. 7. However, the emergence of a weak wideband at 2907 cm− 1 is attributed to (NH+) in the complex, implying proton relocation from the OH of DNP to the ring nitrogen of MHQ.
Table 4
1H NMR spectral data of MHQ and CT complex.
|
Compound
|
Chemical shift, δ (ppm)
|
Assignments
|
|
MHQ
|
7-8.5
|
(d, t, 5H, Ar-H)
|
| |
9.39
|
(s, 1H, OH of MHQ)
|
| |
2.69
|
(s, CH3 of MHQ)
|
| |
8.20, 7.41, 7.34, 7.07,
|
(d, t, 5H of MHQ Ar-H)
|
|
[(MHQ)(DNP)]
|
2.72
|
(s, CH3 of MHQ)
|
| |
8.18, 7.43, 7.36
|
(s, 3H of DNP Ar-H)
|
| |
3.35
|
(s, 1H of NH proton transfer)
|
| d-doublet; s-singlet |
3.3. DNA Binding Analysis
The UV electronic spectrum method is one of the mainly essential supporting approach for Ct-DNA binding investigations with CT complexes [29], and it is also one of the more straight forward methods. Intercalation of CTC often causes a hypochromic shift, which may or may not is accompanied by a hypsochromic or bathochromic shift [16]. This is because intercalation disrupts the strong interaction that exists between the different chromophores and the DNA base pairs. In order to measure the effect of increasing Ct-DNA concentration on CT complex absorbance while keeping CT complex concentration constant, this study examined binding affinity. Figure 8 presents a depiction of the absorption spectra of the complex after it has interacted with the Ct-DNA. The blue shift and hypochromic spectra can be used to determine the intercalation mechanism of the [(MHQ):(DNP)] and the Ct-DNA. Increasing DNA concentration with the [(MHQ):(DNP)] was accompanied by a corresponding decrease in absorbance in this spectrum, providing additional support for a complex DNA binding mechanism. Using the Wolfe-Shimer equation, the intrinsic binding constant (Kb) was intended from the absorption data.
$$\left[\text{D}\text{N}\text{A}\right]/({{\epsilon }}_{\text{a}}-{{\epsilon }}_{\text{f}})=\left[\text{D}\text{N}\text{A}\right]/({{\epsilon }}_{\text{b}}-{{\epsilon }}_{\text{f}})+1/{\text{K}}_{\text{b}}({{\epsilon }}_{\text{b}}-{{\epsilon }}_{\text{f}})$$
9
Kb is the intrinsic binding constant; [DNA] is the concentration of Ct-DNA; εa is the apparent coefficient; εf and εb represent the extinction coefficients for unbound and bound DNA, respectively; Kb can be calculated from a plot of DNA/(εa-εf) vs [DNA] by dividing the slope by the intercept. The intrinsic binding constant (Kb) ratio of the complex is 4.2 ×10⁶ M− 1. DNA binding study has shown that the [(MHQ):(DNP)] exhibit planarity and an extensive π-structure, suggesting DNA intercalation.
3.3.1. DNA binding analysis from Fluorescence spectroscopy
The interaction or binding mode of the CT complex with CT-DNA was studied using an EB-bound CT-DNA solution in 5 mM Tris–HCl/NaCl buffer (pH = 7.2). Due to tenable intercalation between adjacent DNA base pairs, EB emits intense Fluorescence at about 540–620 nm in the presence of CT-DNA. The intensity of absorption in a solution containing EB and CT-DNA gradually decreased as the concentration of CT complex increased and the spectra are presented in Fig. 9. The absorption changes clearly show that the CT complex competes to replace EB from CT-DNA, indicating the complex is intercalatively binding to CT-DNA Fig. 9 depicts the replacement of intercalatively bound EB by the CT complex. The data were evaluated using the Stern–Volmer equation by observing a decrease in Fluorescence intensities.
Io/I = 1 + Ksv[Q]
The extent to which the emission intensity is quenched is a measure of the affinity of the interacting molecule for binding to CT-DNA. The Stern–Volmer quenching constant value KSV was calculated from the slope of Io/I vs Q[CT complex] and found to be 2.1×10⁴ M− 1.
3.4. Computational Studies
3.4.1. Bond Parameters
Optimized structures of MHQ, DNP and the resultant [(MHQ):(DNP)] in the gas and PCM (methanol) solution are revealed in Fig. 10. Due to proton and charge transfer, complexation modifies bond lengths in both the reactants and the complex. For example, C4-C5 bond length in the complex increased to 1.441, 1.450 Å in the gas and PCM opposed with 1.411, 1.394 Å [Table S2] for free DNP. It was also shown that the C-O bond length in the complex are decreased to 1.285 Å, 1.271 Å in both states compared with free DNP (C5-O16) 1.346 Å and 1.316 Å. Concerning the hydrogen bond spot, O16-H17 enhanced to 1.517 Å in the gas and 1.796 Å in PCM compared to 0.991 Å and 0.976 Å for DNP alone. This occurs because the formed complex exhibits proton relocates hydrogen bonding. The N38-H35 bond is observed and its length is found to be 1.484Å in the CT-complex but it is completely absent in the free MHQ. It strongly supports the O-H of DNP proton transferred towards ring nitrogen of MHQ in both gas phase and PCM.
Table S3 displays the optimum bond angles for gas and the PCM. Studies have found that bond angles close to the hydrogen bonding bridge are the most important. For example, during complexation in the both states, the bond angles C11-N21-C12 decrease to 119.7° and 119.2° up respectively, compared to 121.4° for MHQ alone. This observation suggests that in accumulation to CT association, hydrogen bonding proton transfer also contributes to the complex donor part lower charge. For the acceptor moiety, the complex increases the bond angles of C5-O16-H17 from 110.6° in free DNP to 133.8° in the gas and 130.2° in PCM. Therefore, the alterations in bond angles provide strong evidence for the existence of proton in addition with charge transfer in the new complex.
3.4.2. Electrostatic Potential Maps (MEP)
The circulation of negative and positive potential over a system can be utilised to identify electron-rich or electron-deficient regions appropriate for nucleophilic or electrophilic attack using molecular electrostatic potential [4]. The MEP surfaces are colour-coded, with green signifying neutral, red and blue being the mainly negative and positive sections, respectively. The MEP maps of MHQ, DNP and the [(MHQ):(DNP)] are revealed in Fig. 11. In MHQ shows a red colour on the ring nitrogen, it can be considered as the H-acceptor and n-donor (nucleophile). Regarding DNP one can see the blue color on the OH group considered as H-bond donor (electrophile). Observing the MEP of produced complex, the red color has vanished and the blue color has taken the place of the quinoline ring. However, the red color covers the DNP section with the vanishing of the blue color, indicating that DNP has a strong accepting ability, and the LUMO on O35 is the predominant acceptor centre. As a result, the MEP map indicated the existence of charge in accumulation to proton transfer in the investigated complex.
3.4.3. FMO’s of CT complex
Frontier molecular orbitals play a key role in molecular associations with other species [7]. The capability to contribute electrons is represented by the highest occupied molecular orbital (HOMO), whereas the capacity to accept electrons is shown by the lowest unoccupied molecular orbital (LUMO). The variation among the HOMO and LUMO states determines the band gap energy. HOMO-LUMO maps for the [(MHQ):(DNP)] complex was computed with DFT using CAM-B3LYP 6–31 + G (d, p), and the results are shown in Fig. 12. Plus, Fig. 13 Band gap energy (eV) among HOMO and LUMO in gas and PCM is depicted. The figure reveals that LUMO is substantially localized on the DNP moiety, whereas HOMO is exclusively localised on the MHQ moiety. The HOMO is found mostly in the complex MHQ region and on the N21 atomic orbital. As a result, the n-electrons are confined to the HOMO molecular orbital. The remaining occupied molecular orbitals in the CT complex are located on the p-atomic orbitals of the quinoline moieties of MHQ; these orbitals can be measured as π molecular orbitals, and LUMO is a π* molecular orbital. The experimental transitions can therefore be categorised as n-π* and π-π* transitions.
3.5. Mulliken Atomic Charges
Mulliken atomic charges of the donor, acceptor, and [(MHQ):(DNP)] in the gas and PCM are shown in Table S4 and Fig. 14. Regarding the proton transfer, H-bond O16 enlarged to -0.6227 a.u compared with − 0.5821a.u for free DNP as an effect of hydrogen bond development. On the other hand, N21 is increased to -0.64632 a.u for the complex in the gas phase compared with − 0.17831 a.u. The same trend in PCM was seen in Table S4.
3.6. Reactivity parameters
Chemical potential (µ), Ionisation potential (Ip), Electron affinity (A), hardness (η), softness (σ), and electrophilicity index (𝜔) are all examples of reactivity descriptors that can be calculated from the HOMO-LUMO surfaces that provide important information on reactivity in relation to chemical reactions [30]. These variables are described via equations.
Ionization potential (Ip) = -EHOMO (10)
Softness (σ) = 1/η (11)
Electron affinity (A) = -ELUMO (12)
Hardness (η) = (Ip-A)/2 (13)
Chemical potential (µ) = (Ip + A)/2 (14)
Electrophilicity index (𝜔) = µ2/2η (15)
According to the outcomes of these reactivity parameters, the molecule with the maximum EHOMO energy was the strongest e-donor, whereas the one with the least ELUMO energy is a good electron acceptor (Table 5). MHQ acted as an e-donor fragment in the CT complex, whereas DNP acted as an e-acceptor. The same result was achieved when the chemical potential (µ) and electrophilicity index (𝜔) were utilized.
Table 5
The reactivity parameters of MHQ and DNP gas phase and PCM.
|
Parameter
|
GAS
|
|
PCM
|
| |
MHQ
|
DNP
|
MHQ
|
DNP
|
|
|
EHOMO (eV)
|
-6.86
|
-9.31
|
-5.19
|
-9.08
|
|
|
ELUMO (eV)
|
-1.53
|
-4.26
|
-1.68
|
-2.46
|
|
|
I
|
6.86
|
9.31
|
5.19
|
9.08
|
|
|
A
|
1.53
|
4.26
|
1.68
|
2.46
|
|
|
η
|
2.66
|
2.57
|
1.75
|
3.31
|
|
|
µ
|
-4.19
|
-6.78
|
-3.43
|
-5.77
|
|
|
𝜔
|
3.16
|
9.11
|
3.36
|
5.02
|
|
|
σ
|
0.37
|
0.29
|
0.57
|
0.30
|
|
| 1eV = 96.485 kJ mol− 1 |