The title molecule (E)-2-(3-(5-(3-nitrophenyl)furan-2-yl)acryloyl)-3,4-dihydronaphthalen-1(2H)-one (ENFADH) was completed by combining aromatic aldehydes with methyl ketones using Claisen-Schmidt condensation. The NMR, FTIR, and UV-visible investigations were used to characterize the novel chalcones. To determine the geometric, electronic, spectroscopic features, a theoretical model was also built using Gaussian 09 supporting basis set of B3LYP/6-311 + + G (d,p) as well as this basis set was used to performed the geometry optimization, harmonic vibration simulations, molecule electrostatic potential (MEP), frontier molecular orbitals (FMOs), and Mulliken's population analysis. A scaling factor of 0.9600 results in a attractive correspondence between the title compound vibrational spectrum and the experimental IR spectrum. In this innovative effort of this synthesized molecule gives more in-vitro research, such as anti-oxidant, antibacterial and antidiabetic tests were conducted. It revealed significant bactericidal activity with a maximum zone of inhibition of (19.0 ± 1.7mm) at 2.5 g/ml against Pseudomonas aeruginosa (ATCC 27853), presented maximum DPPH scavenging trait ranging from (30.8 ± 1.3% to 81.2 ± 1.5%) against Vitamin C. Likewise, it showed maximum H2O2 scavenging trait ranging from (37.9 ± 2.5% to 75.8 ± 6.4%) against ascorbic acid. In Anti-diabetic activities, it demonstrated α-amylase inhibition of 20.9 ± 2.4to 73.5 ± 2.3% and α-glucosidase inhibition by display activity of (23.3 ± 1.5 to 79.7 ± 1.2 U/L). In-silico molecular docking investigates using Auto Dock 4.0 showed the active pocket of the 1HD2 protein to estimate genotoxicology. By molecular docking, the title molcule exhibited a higher binding interaction energy of -6.5 (Kcal/mol) against the target 1HD2 protein. The obtained results suggest that the ADME characteristics of the examined drugs were predicted using their retention data (RM0). These early outcomes might be used to help choose new medication candidates and were shown to have no mutagenic effects when tested for toxicity.
Research Article
Research on Chemical Intermediates Spectral, Density functional theory calculations, molecular docking studies, antimicrobial, antioxidant, antidiabetic activities of the novel (E)-2-(3-(5-(3-nitrophenyl)furan-2- yl)acryloyl)-3,4-dihydronaphthalen-1(2H)-one
https://doi.org/10.21203/rs.3.rs-3581999/v1
This work is licensed under a CC BY 4.0 License
Version 1
posted
You are reading this latest preprint version
Novel ENFADH
DFT
In-Vitro analysis
Molecular docking
Generally, chalcones fall into categories of natural organic compounds such as fruits, vegetables, beverages, herbs, spices, and so on [1–3]. The term "chalconoids" often refers to the family of flavonoids known as chalcones. It has two geometric isomers, cis and trans, with trans being the more thermodynamically stable of the two [4]. The chalcone family, which also has synthetic, biosynthetic, and pharmacological applications, has received a great deal of attention. As a result, many biological activities have been revealed, including the treatment of diseases like microbial, cancer, anti-inflammatory, antioxidant, and viral infections [5–9].
The 1-tetralone family of compounds is an essential cleverness, and a lot of their derivatives have demonstrated significant biological efficacy with antibacterial properties [10]. Numerous (E)-2-(4'-substitutedbenzylidene)-1-tetralones have been characterized, synthesized using spectroscopic methods, and used in biological applications [11–13]. In the production of organic compounds, 8-hydroxy-1-tetralone and its derivatives are helpful intermediaries [14]. Additionally, tetralone is thought to make it simple to obtain diospyrol, a very effective anthelmintic medicine derived from the plant Diospyros mollis (Ebenaceae), and can be employed in the synthesis of molecules for the research of dopamine (DA) and seroton (5-HT) receptors [15–18]. In conclusion, Meerwein's technique was used to make a novel synthesis of ENFADH, which was then condensed with 2-acetylfuran to form the new chalcone derivatives. Furthermore, it does not require any expensive experimental process; the current procedure is easily reproducible [19].
Finding a source for a novel synthesized title compounded drug for the majority of antioxidant treatments is an important tool in the field of medical chemistry. The newly discovered 1-tetralone based title molecule has been observed to behave as an antioxidant agent for DPPH activity in our present study effort and was finished with the various spectroscopic inspections by observed and theoritical DFT calculation with B3LYP/6-311 + + G (d,p) level. There are several beginning constituents in a variety of 1-tetralone derivatives, and they are reasonably priced. This investigation was particularly interested in synthesizing all of the 1-tetralone derivatives and examining their effects on DPPH antioxidant properties in-vitro and in-silico since molecules containing the 1-tetralone moiety have several chemical applications.
Chemistry
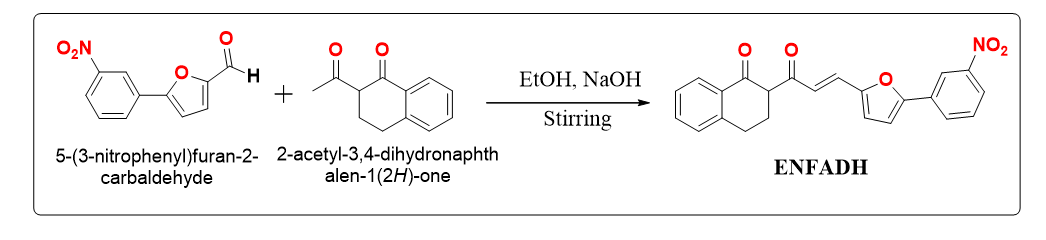
The synthesized pathway of a new compound (ENFADH). The novel chalcone was created using Meerwein's technique of synthesis and condensed with 2 acetylfuran. In Scheme 1, the synthesis process for the α-tetralone derivative ENFADH was revealed. They were amply supported by a number of analytical tools, as shown in Scheme 1.
In this case, NaOH acted as an efficient base catalyst.
Purchase chemicals and reagents
To synthesize title compound of the following reagents and chemicals were used: furan-2-carboxaldehyde, α-Tetralone namely, (2-acetyl-3,4-dihydronaphthalen-1(2H)-one) presented in the scheme-1, which is indicated as (2) was purchased from sigma aldrich, EtOH, HCl, sodium nitrite, CuCl2•2H2O, and NaOH.
Synthesis and charecterizations
The starding material 5-(4-chlorophenyl)furan-2-carbaldehyde (1) was synthesized using the reference [20, 21].
The 5-(4-nitrophenyl)furan-2-carbaldehyde (1g, 0.00485mmole), 2-acetyl-3,4-dihydronaphthalen-1(2H)-one (1.5g, 0.00727mmole), and 2.5g of NaOH were rapidly agitated in ethanol (40ml) for 24 hours. TLC analysis was used to keep track of the reaction. After the reaction was completed, the precipitate was permitted to purify by various fractions in column chromatography procedures employing a 20% Hexane: EtOAc eluent combination. The entire spectrum characterisation data of (E)-2-(3-(5-(3-nitrophenyl)furan-2-yl)acryloyl)-3,4-dihydronaphthalen-1(2H)-one (ECLFADH) is presented below. The yields were dried and recrystallized from ethanol at room temperature (Scheme 1). The methodologies for spectrum analysis of FTIR, 1H-NMR, and 13C - NMR have been explained. Synthetically obtained compound absorption spectra were confirmed with a Shimadzu UV-visible spectrometer.
Light Yellow solid; mp: 262–264˚C; IR (KBr, ν, cm− 1): 3212, 3041, 3102, 1704, 1519, 1450, 1368, 1328, 1285, 1289, 1163, 1098, 1006, 854, 726; UV/Vis: λmax 370 nm; 1H NMR (400 MHz, CDCl3): δ 2.18(s, 1H, CH2 Proton), 2.42 (s, 1H, CH2 Proton), 2.93 (d, J = 1.6Hz, 2H, CH2 Proton), 3.78 (s, 1H, CH Proton), 6.76–6.84 (t, J = 1.6Hz, 3H, Ethylene Proton), 7.23–7.4 (t, J = 1.6Hz, 3H, Ethylene Proton), 7.67–8.48 (m, 6H, Ar-H); 13C NMR (100 MHz, CDCl3): δ25.42, 28.08, 58.10, 104.49, 114.17, 121.64, 128.98, 132.84, 134.59, 153.33, 197.37, 197.87.
Computational details
The ab-initio molecular simulations with gradient geometry optimization were carried out using the Gaussian 09 software package [22–26]. In the context of this research, the Basis Set 6-311 + + G (d,p) is utilized to optimize molecules in the gas phase with Becke's three-parameter Lee-Yang-Parr hybrid exchange-correlation (B3LYP) functions [27]. Because the DFT hybrid B3LYP functional and SDD methods overestimate the fundamental modes, a scaling factor of 0.9613 must be introduced to better agreement with experimental data [28–30]. The structure was selected primarily for energy minimum point evaluation using the Stuttgart/Dresden useful core possible basis set (SDD). Tables S1 and S2 show the properties of the optimized geometry (SDD) of the title molecule (Fig. 1). The TD-DFT approach was used to compute theoretical UV-visible electronic transition properties such as maximum excitation wavelength (max) and oscillator strengths (f) [31–35]. The chemical shifts of the molecule in the proton 1H NMR spectra were calculated using the gauge-independent atomic orbital (GIAO) approach [36]. The FT-IR spectra for B3LYP/6-311 + + G (d,p) were generated using the self-consistent reaction field (SCRF) continuous solvent model. Experiments on mulliken charges and chemical reactivity were also carried out in order to better understand the energy of border molecular orbitals (HOMO-LUMO). The properties of molecular electrostatic potentials (MEPs) were determined using theoretical simulations.
Biological activities
Antibacterial assessment
Nanocomposite antibacterial activity against American-Type Cell Culture (ATCC) reference bacterial strain microbes Gram positive Bacillus subtilis (MTCC 441), Staphylococcus epidermidis (MTCC 3615) and Gram-negative bacteria Escherichia coli (ATCC 25922), Pseudomonas aeruginosa (ATCC 27853) was obtained from the King Institute of Preventive Medicine and Research, Chennai, TN, India. To test the antibacterial activity of the samples, each bacterial culture was diluted to a final concentration of 108 cell/ml, and lawn culture was performed on Muller-Hinton agar medium using sterile swabs. Culture tubes containing 5 ml of Muller-Hinton broth containing 10 µg ml-1 were loaded with 1 ml of 108 cell/ml bacteria dropped with an 8 mm diameter disk. For a 24-hour period, the cultures were cultured at 37°C to see observable growth and assess the zone of inhibition (mm) for the sample's antibacterial capabilities. Three duplicates of each experiment were carried out.
Antioxidant DPPH radical scavenging assay
Antioxidant activity as measured by the DPPH (1, 1, diphenyl 2, 2, picrylhydrazyl) Scavenging [37, 38] Assay Using the DPPH technique, the free radical degrading abilities of ENFADH were assessed [39]. The percentage (%) of ENFADH DPPH-degrading abilities were computed as follows and used to determine the ENFADH at concentrations ranging from 200 to 1000 µg/ml:
DPPH scavenging capacity (%) = [(Asample - Ablank)/Acontrol] × 100
where Asample is the sample's 30-minute absorbance and Acontrol is the control's 30-minute absorbance. Each sample was examined three times.
Antioxidant H2O2 radical scavenging assay
In order to conduct an H2O2 [40] scavenging test, the title molecule ENFADH was produced in ethanol and introduced to 0.6 ml of H2O2 solution at various concentrations (200–1000 µg /ml). The reaction mixture's absorbance at 230 nm was measured after 15 minutes of incubation. H2O2 solution that is pure and unadulterated is known as a blank solution. The ENFADH H2O2 scavenging activity was determined as follows:
Hydrogen peroxide scavenging (%) = [(A0 -A1)/A0] × 100
where, A0 is the absorbance of the control, and A1 is the absorbance of the sample.
Antidiabeti α-amylase inhibition assay
Briefly, ENFADH (10–50 mg/ml) and acarbose were combined with 10 ml of amylase (pre-incubated in 20 mM sodium phosphate buffer, pH 6.7) and incubated at 37°C for 5 minutes. The starch solution (0.2% w/v) was added to the reaction mixture to bring the total volume up to 2 ml and incubated at 37°C for 5 minutes.
1 ml of dinitrosalicylic acid reagent was added after incubation and maintained in a boiling water bath. The solution was allowed to cool for 5 minutes before adding deionized water. At 540 nm, the absorbance was measured, and a-amylase inhibition was estimated as follows:
α-amylase inhibition (%) = [Ac-As/Ac] ×100
where Ac and As denote control and extract absorbances, respectively. The IC50 value was derived as the concentration of extract that inhibited α -amylase by 50% [41].
Antidiabeti α-glucosidase activities
Tha activity of α-glucosidase against ENFADH was estimated as per the method of inhibition by showing activity of (23.3 ± 1.5 to 79.7 ± 1.2 U/L) in a concentration-dependent manner [42]..
Molecular Docking
An experiment using molecular docking to determine the binding modalities of the ligand on the approach to its target, Human Peroxiredoxin 5, a New Kind of Mammalian Peroxiredoxin (PDB code: 1HD2), was the subject. It has a 1.5 X-ray diffraction resolution. Utilizing Discovery Studio's protein wizard, the recovered protein was produced [43–46]. The first step was to remove every internal ligand, water molecule, ion, and metal component. With the help of the current method, the produced protein was used to estimate the position of the antibacterial protein 1HD2 A-active chain. In order to identify the active site acceptor's target, this method was used, and the results were then used in docking studies. ENFADH, a new chalcone-based molecule that was just synthesized, has a ligand structure that was created using Chem Draw 12.0. All of these ligands were purified and produced using D.S.4.0 minor molecule procedures for use in molecular docking studies after this compound's two-dimensional (2D) structures were converted into mol format and then into its three-dimensional (3D) structure using Accelrys Discovery Studio V.4.0.
Autodock4.2 conducted molecular docking research with flexible ligands, and stiff receptors were used in the docking studies. At the binding site for the 1HD2 protein, the size of the grid box (x, y, and z) values are 74 x 96 x 108, and the center of the grid box (x, y, and z) values are 9.012 x 42.646 x 20.063 with a grid spacing of 0.574. The program Chem Draw 12.0 is used to depict the organic component of ENFADH. The 3D structure was constructed using the Auto Dock program, which was also utilized for the docking operation [47]. All of the ligands were produced and cleansed with the Auto Dock ligand-input tools with torsion tree-choose root and torsion tree-detect root. The output-save as pdbqt command was used to store the final, purified ligands for use in future molecular docking experiments. Using the program Discovery Studio, the visualization outcomes were produced [48].
ADME (Absorption, Distribution, Metabolism, Excretion) studies
At http://preadmet.bmdrc.org, one might access the Pre-ADMET program. The study employed ENFADH, which was translated into molfiles (*.mol). The program automatically determined the distribution for plasma protein binding, HIA (human intestinal absorption), predicted absorption for Caco-2 cells, mutagenicity, and carcinogenicity of Benigni/Bossa rule-based methods in Toxtree to predict the toxicity qualities [49, 50].
Molecular geometries
The optimized structure of the title molecule ENFADH is shown in Figs. 1 and 2. Although the bond length for the C38-N43 bond for the title compound ENFADH is found to be 1.468, the bond magnitudes for the C2-O15 and C16-O18 are all computed to have the same value, 1.252A0. Theoretically, conclusions (SDD) follow, although they are very similar to the structural characteristics of known derivatives that are linked. The optimized structure of ENFADH title compound is shown in Fig. 2, and its optimal step numbers are obtained from images of the potential energy study curves, are shown in Fig. 3. For the optimized structure, as shown in Tables S1 and S2, the bond lengths and bond angles were governed by the DFT method using the 6-311G++(d, p) basis set. The optimized structural ENFADH estimated minimum energy obtained using B3LYP/6-311G++ (d, p) is -1317.082 a.u.
Table 1 Calculated quantum chemical parameters HOMO-LUMO results of ENFADH Values are shown below

According to the calculations, the best shape for ENFADH will be selected to reduce the potential energy surface of the bonds with the following lengths: (C10-C11), (C3-C8), (C4-C9), (C33-C34), (C35-C38), and (C36-C40). These bonds have an aromatic double bond character, whereas the other bonds show a single bond character.The Carbon-Hydrogen bond length for C5-H22 and C6-H24 values are the same as 1.098 A0, as are C5-H23 and C6-H25 values, which are slightly the same values of 1.095–1.097 A0. Similarly, C11-H14 and C17-H21 obtained the same bond length values of 1.085 A0. The hydrogen bond distance is between 1.083 A0 and 1.084A0, according to the bond lengths of C36-H41 and C34-H37. The hydrogen bond distance optimized by ENFADH for this chemical is less than 2A0. Therefore, this molecule will have superb biological activity. Bond angles for the hydrogen-containing molecules range from 106.50 A0 to 125.80 A0 for the molecules (H22-C-5-H23), (H24-C6-H25), (H20-C19-C31), and (H29-26C-C31).
Mulliken atomic charges
We recognize that the definition of atoms has a significant impact on atomic charges. Because atomic charges influence a variety of molecular systems, including dipole moment, molecule polarizability, electronic structure, and many others, they are also crucial in the use of quantum evaluation in the molecule. Table S3 contains the values determined for ENFADH by the DFT/B3LYP/6-311 + + G (d,p) basis set, with the highest positive charge on H22 hydrogen being 0.196 and C5 carbon being − 0.332 for ENFADH at the DFT level, respectively. According to the DFT level, the greater negative charges on the O15 and O18 oxygens of ENFADH were − 0.294 and − 0.603877, respectively. A positive charge is present in all hydrogen.
Frontier molecular orbital energies
Chemical compounds with smaller FMO energy gaps usually have lesser kinetic stability and increased chemical reactivity. The LUMO orbitals have stretched towards the 3-nitrophenyl moiety in the title molecule ENFADH, while the HOMO orbitals have gathered around (E)-4-(5-(3-nitrophenyl)furan-2-yl)but-3-en-2-one. This describes how the (E)-4-(5-(3-nitrophenyl)furan-2-yl)but-3-en-2-one) group interacts with the α-Tetralone group by charge transfer.
The molecules' interactions with other species are crucial and more reactive, which may be determined by the band gap and the distinction between the LUMO and HOMO energies [51, 52]. A big gap might result in a lower affinity of the inhibitor for the target protein since it is more challenging to excite an electron from the HOMO to the LUMO. Consequently, the ECLFADH compound's band gap is lower at 3.1163 eV [53]. Figure 4 displays the title molecule (ECLFADH) HOMO-LUMO charge density map that was obtained. Table 1 displays the outcomes of a theoretical calculation of key quantum chemical characteristics, including ionization potential (I), electron affinity (A), electronegativity (χ), chemical potential (µ), chemical hardness (η), chemical softness (S), and electrophilicity index (ω).
Molecular Electrostatic Potential
The molecular electrostatic potential (MEP) plot of the isolated molecule NAG is displayed by a number of color codes that range from − 5.012 eV (the dark red) to + 5.012 eV (the dark blue). This MEP surface accurately describes the molecule's reactive regions. In the MEP of ENFADH, the positive regions were found over the protonated (E)-4-(5-(3-nitrophenyl)furan-2-yl)but-3-en-2-one group. Over the α-Tetralone group, which contains electronegative oxygen atoms, the negative regions are enlarged. The green area on the MEP surfaces with zero potential contains a carbon atom from the ENFADH molecule. MEP shows the possibilities of the middle ground between the two darkest shades of red and blue. Figure 5 displays the molecular electrostatic potential picture of ENFADH molecules.
Vibrational assignments
Containing 46 atoms and 132 total fundamental modes of vibration, the molecule in question, ECLFADH, is described here. In both FT-IRs, every vibration is active. Figures 6 display the title molecules estimated observed FT-IR spectra. Most of the normal modes have calculated frequencies that are a little bit higher than the actual values. The dissimilarity in the real and estimated spectra of this chemical might be due to two factors. The first is the effect of the surroundings, and the second is that the measured value has an anharmonic frequency because the result of the calculation has a harmonic frequency. The calculated harmonic wavenumber is frequently bigger than the relevant actual values as a result of a combination of the electron coherence effect and basis set requirements [54].
The Gauss-View molecular visualisation programme was used to assign the vibrational bands. This study uses a uniform scaling approach to get rid of harmonic wavenumber defects. Based on this procedure, the theoretical harmonic wavenumber has been modified by a factor of 0.96100 [55].The vibrational frequencies were estimated using the basis set at the B3LYP/6-311 + + G (d,p) level. Table S4 shows the assignments and intensities for the title molecule's observable and calculated vibrational frequencies. The first column of Table S4 lists all the computed modes, recorded from the major to the minimum frequency inside each vital wavenumber. Figure 6 and the FTIR spectrum that was actually found. The stretching vibrations of the C-H, C = O, C-N, and NO2 display distinct bands in the FT-IR spectra.
Compared to the aliphatic C-H stretch, the C-H stretching arises at 3306–3342 cm− 1 and often manifests as a variety of feeble to moderate bands [56]. The bands at 3085, 3074, 3065, and 3045, and 3045 cm− 1 were identified by Klot and Collier [57] as the benzoxazole's CH modes. The bands at 3212, 3102, and 3041 cm− 1 in the infrared are identified in our experimental work as the ECLFADH shows the phenyl ring C-H stretching modes. According to the SDD computations, these modes fall between 3304 and 3038 cm− 1. According to T.U. Rahman et al., the computed peak for C = O at 1655 cm− 1 corresponds to the stretching vibration of C = O and neatly matches with the observed value of 1641 cm− 1 [58]. The title chemical exhibits simulated peaks in the current investigation at 1701 and 1621 cm− 1, which are consistent with the measured values of 1704 and 1608 cm− 1. According to [59] predictions, the CN stretching modes should be between 1100 and 1300 cm− 1. In the IR spectra, ECLFADH bands at 1285 cm− 1 and theoretically at 1285 cm− 1 (SDD) are attributed to CN stretching modes. Theoretically, the CN stretching mode was stated to be at 1215 cm− 1 by Panicker et al. [60]. The NO2 stretching vibrations are of reason for most detectable spectral band of nitro compounds with asymmetric and symmetric stretching vibrations of nitro compounds are located in the ranges 1661 − 1499 and 1389 − 1259 cm− 1, correspondingly. The derivatives of Nitrobenzene demonstrations ʋas NO2 in the region 1535 ± 30 cm− 1 and 3-nitropyridines at 1530 ± cm− 1 in addition to substituted nitro benzenes [61–63]. ʋs NO2 appears strongly at 1345 ± 30 cm− 1, in 3-nitropyridine at 1350 ± 20 cm− 1 with in conjugated nitro alkenes [64] at 1345 ± 15 cm− 1. The title molecule, SDD compute to deliver NO2 stretching vibrations at 1287 and 1459cm− 1 which are interrelated to the observed values of 1289 and 1450 cm− 1.
The nature of the substitutions has no discernible impact on the C = C stretching vibration, which follows in the region of 1650 to 1200 cm− 1 [65]. In the region between 1368 and 1098 cm− 1 in the FT-IR spectrum, the stretching of the C = C vibration for the compound in the title is seen. Experimentally predicted value between 1378 and 1100 cm− 1, theoretically estimated levels of C = C stretching vibrations are seen. ENFADH experimentally observed FT-IR bending βHCC vibrations are revealed at 1519 and 13285cm− 1. The ENFADH compound also produced a number of βCCC, βOCC bending and βHCCC, β HCCN torsion vibrations τ HCCC, and γHCCC out of plane bendings, which have all been well examined [66–68].
Thermodynamic properties
The findings of the thermodynamic parameters of ENFADH estimated using the B3LYP/6-311 + + G(d,p) basis at 1.00 atm pressure and 298.150 K are shown in Table 2. These properties include thermal energy, rotational temperatures, rotational constants, zero-point vibrational energy (ZPVE), specific heat capacities, which can be calculated at any temperature and are crucial for understanding the direction of chemical reactions, and entropy. A molecular system's Gibbs free energy, enthalpy, and entropy are estimated using frequency calculations. Gibbs free energies are greater in compounds with a greater degree of stability [69]. The value that can be used for the dipole moment (Debye) parameter has been included in this paper. The advantageous outcomes of the synthesized ZPVE, entropy, enthalpy, and ENFADH free energy are employed.
|
Parameters |
B3LYP 6-311 + + G(d,p) |
|---|---|
|
Zero-point vibrational energy(kcal mol− 1) |
222.917 |
|
Total energy (a.u.) |
-1317.0814 |
|
Rotational constants (GHz) |
|
|
0.47902 |
|
|
0.04483 |
|
|
0.04358 |
|
|
Rotational temperatures (K) |
|
|
0.02299 |
|
|
0.00215 |
|
|
Dipole moment (Debye) |
0.00209 4.9732 |
|
Entropy (cal mol− 1K− 1) |
|
|
Rotational |
37.083 |
|
Translational |
43.753 |
|
Vibrational |
90.060 |
|
Total |
170.902 |
UV–Vis spectral studies
Electronic absorption is fundamentally defined by the ground state shift to the first excited state, otherwise by single electron excitation from HOMO to LUMO. Electronic transitions are often identified by the involved orbitals or certain areas of the molecule. Electrical transitions of π–π*, n–π*, and π* (acceptor)-(donor) are often seen in organic compounds. The theoretical calculation was utilized to examine the ultraviolet spectral analysis of ENFADH. The (TD-DFT) time-dependent density functional theory method, particularly in the analysis of the solvent effect, is capable of detecting precise absorption wavelengths at a reasonable computational rate, which are associated with vertical electronic transitions predicated on the ground state geometry [70–72]. The results of the computations linking the vertical excitation energy, oscillator strength (f), and wavelength are done and connected with the observation wavelength. The potential visible absorption maximum of λmax, which is a function of electron availability, is shown in Table S5.
The computing of ENFADH's electronic spectra was done in the gas phase. The predicted band gaps are close to the observed UV-visible data, and the computed HOMO-LUMO energy gap is 2.6504 eV. Fig. S1 depicts the theoretical and experimental UV-visible spectra. At the gas phase, the first excited state (E1) band gap is measured to be 467.80 nm. A 482 nm absorption is visible in the matching recorded UV-visible spectra. The (E)-4-(5-(3-nitrophenyl)furan-2-yl)but-3-en-2-one group of the title compound ENFADH is covered by the HOMO-LUMO. Table S5 makes it clear that the second excited state seen in the gas phase is at a wavelength of 398.20 nm. At 382 nm, the experimental absorption peaks, which are made up of one sub-energy level, are Comparable to this, the gas phase third excited state in DFT is located at 369.47 nm, and the maximum absorption is visible in the recorded spectra at 370 nm. According to a computation of molecular orbital geometry, this molecule's apparent absorption maximum is related to an electron moving from one frontier orbital to another, such as from HOMO to LUMO. The Gauss Sum 3.0 program has been used to obtain calculated UV-visible spectrum images [73]. The major absorption peak (max) in a UV spectrum is related to vertical stimulation, according to the Frank-Condon principle. For an oscillator strength of first excited state f = 0.0131, second excited state f = 0.0422, and third excited state f = 0.9236, the computation predicted one strong electronic transition at 2.6504 eV, 3.1136 eV, and 3.3557 eV (482 nm, 382 nm, and 370 nm), respectively, in agreement with the observed measurements of 467.80 nm, 382.20 nm, and 369.47 nm in the gas phase. The n-π* HOMO-1–LUMO + 1 (63%) and n-π* HOMO–LUMO + 1 (59%) of transitions produce the main electronic excitations, as obtainable by the molecular orbital coefficients and their graphs in Table S4. According to the calculated absorption spectra, the HOMO-LUMO electronic transition accounts for the widest range of UV-visible absorption wavelengths (93%) with n-π* [74].
Nuclear Magnetic Resonance (NMR) spectra
1 H-NMR and carbon-13 NMR Experimental Spectra explaination
Figure S2 represents the 1H-NMR spectrum of the substance ENFADH. The molecule ENFADH 1H NMR spectrum, which showed singlet δ 2.42 ppm (s, 1H), demonstrated the presence of the (-CH2-) methylene proton, which is located in the -Tetralone group. The singlet at δ 2.93 ppm (s,1H) provides a clue that the (-CH2-) methylene proton, which was positioned in the α- Tetralone group, was present. The singlet at δ 3.78 ppm (s,1H) indicates the existence of a proton of the (-CH-) methene, which was located in the α- Tetralone group. The (-CH2-) methylene proton, which was located in the α-Tetralone group, was present in the doublet that was identified at δ 2.93 ppm (d, J = 1.6 Hz, 2H). The 1-ethylene proton is found in the (E)-4-(5-(3-nitrophenyl)furan-2-yl)but-3-en-2-one group, and its presence is indicated by the triplet at δ 6.76–6.84 (t, J = 1.6Hz, 3H). The triplet at δ 7.23–7.24 (t, J = 1.6 Hz, 3H) indicates the presence of a 1-ethylene proton, which is located in the (E)-4-(5-(3-nitrophenyl)furan-2-yl)but-3-en-2-one group. The multiplet at δ 7.67–8.48 ppm (m, 6H) indicates the existence of (Ar–H), which was present in the ENFADH.
Figure S3 illustrates the chemical ENFADH carbon-13 NMR spectra. The existence of (-CH2-) methylene carbon, which was present in the Tetralone group, was indicated by peaks at δ 25.42 and δ 28.08 ppm; similarly, the presence of (-CH-) methane carbon, which was present in the Tetralone and furan groups, was indicated by peaks at δ 58.10, 104.49, and 114.17 ppm. (Ar-C) is present in the compound at the following concentrations: δ 121.64 to 128.98 ppm and 134.59 to 153.32 ppm. The 1-ethylene proton, which is located in the (E)-4-(5-(3-nitrophenyl)furan-2-yl)but-3-en-2-one group, is present in concentrations of δ 129.03 and δ 132.85 ppm. The presence of (-C = O-) carbonyl carbon indicates an attendance of δ 197.37–197.87 ppm.
1 H-NMR and carbon-13 NMR Theoritical and Experimental Spectra studies by Gaussian 09
Table 3 shows the experimental spectrum data for the chemical in question, ENFADH, obtained at 400 MHz with TMS as the internal standard. B3LYP/GIAO was used to compute the absolute isotropic chemical shielding of ENFADH. The relative chemical shifts were then determined using the appropriate TMS shielding: σcalc (TMS), calculated before at a similar theoretical level as this work. Tables 3 and 4 show the calculated values of σcalc (TMS) and the numerical values of chemical shift δpred = σcalc (TMS) _ σcalc. It can be demonstrated that the chemical shift corresponded to the experimental carbon-13 and 1H NMR observations. The predicted proton and 13C-NMR chemical shifts for ENFADH were in great accord with the experimental results.
|
Proton |
σTMS |
B3LYP/6-31G |
δcalc = σTMS - σcalc |
Exp. δppm |
|---|---|---|---|---|
|
H7 |
32.5976 |
24.347 |
8.251 |
8.285 |
|
H12 |
25.627 |
6.970 |
6.844 |
|
|
H13 |
25.329 |
7.269 |
7.248 |
|
|
H14 |
25.508 |
7.090 |
7.243 |
|
|
H20 |
24.907 |
7.691 |
7.809 |
|
|
H21 |
25.059 |
7.538 |
7.671 |
|
|
H22 |
28.963 |
3.634 |
3.78 |
|
|
H23 |
30.286 |
2.312 |
2.933 |
|
|
H24 |
30.735 |
1.863 |
2.185 |
|
|
H25 |
30.115 |
2.483 |
2.423 |
|
|
H29 |
25.497 |
7.100 |
7.239 |
|
|
H30 |
25.732 |
6.865 |
6.79 |
|
|
H37 |
24.456 |
8.142 |
7.809 |
|
|
H39 |
24.154 |
8.443 |
7.949 |
|
|
H41 |
25.284 |
7.314 |
7.381 |
|
|
H42 |
24.498 |
8.100 |
8.489 |
|
|
H46 |
28.895 |
3.703 |
2.934 |
Antibacterial activities
The compound (ENFADH) was evaluated against Gram (+) and Gram (-) bacteria using streptomycin as a positive control. (ENFADH) derivative compound has demonstrated broad-spectrum, strong antibacterial activity. Using streptomycin as a positive control, a derivative of ENFADH demonstrated broad-spectrum antibacterial efficacy against Gram (+) and Gram (-) bacteria [75]. It demonstrated significant bactericidal activity with a maximum zone of inhibition of 19.0 ± 1.7 mm at 2.5 g/ml against Pseudomonas aeruginosa (ATCC 27853) and a minimum zone of inhibition of 12.6 ± 1.1 mm against Bacillus subtilis (MTCC 441) (Table 5 and Fig. 7) at 0.5 g/ml.
|
Table 4 Experimental and calculated 13-C NMR parameters (with respect to TMS) |
||||
|
Carbon |
σTMS |
B3LYP/6-31G |
δcalc = σTMS - σcalc |
Exp. δppm |
|
C1 |
199.985 |
130.188 |
69.797 |
58.101 |
|
C2 |
-4.433 |
204.418 |
197.861 |
|
|
C3 |
65.672 |
134.313 |
134.59 |
|
|
C4 |
53.110 |
146.875 |
147.815 |
|
|
C5 |
166.043 |
33.943 |
28.080 |
|
|
C6 |
167.371 |
32.615 |
25.424 |
|
|
C8 |
68.843 |
131.143 |
129.997 |
|
|
C9 |
69.617 |
130.368 |
129.037 |
|
|
C10 |
64.720 |
135.266 |
135.710 |
|
|
C11 |
72.420 |
127.565 |
127.695 |
|
|
C16 |
0.249 |
199.736 |
197.369 |
|
|
C17 |
77.616 |
122.370 |
123.532 |
|
|
C19 |
69.730 |
130.256 |
128.982 |
|
|
C26 |
80.527 |
109.459 |
104.497 |
|
|
C27 |
38.272 |
142.764 |
141.634 |
|
|
C28 |
85.039 |
114.946 |
114.172 |
|
|
C31 |
38.662 |
151.324 |
152.639 |
|
|
C33 |
67.576 |
132.409 |
132.328 |
|
|
C34 |
67.298 |
132.688 |
132.847 |
|
|
C35 |
79.466 |
120.520 |
121.638 |
|
|
C36 |
68.715 |
131.271 |
134.91 |
|
|
C38 |
46.768 |
153.217 |
153.329 |
|
|
C40 |
75.820 |
124.165 |
127.293 |
|
Table 5 Antibacterial activity of (ENFADH) against Gram-positive and Gram-negative bacteria
|
Organisms |
Streptomycin (mm) 10µg/ml |
Antibacterial activity (mm) |
||||
|
0.5(µg/ml) |
1(µg/ml) |
1.5(µg/ml) |
2(µg/ml) |
2.5(µg/ml) |
||
|
Staphylococcus aureus
|
19.6±1.5 |
12.6±1.1 |
13.0±1.0 |
14.0±1.6 |
15.6±0.5 |
16.3±1.5 |
|
Enterococcus faecalis
|
20.6±1.5 |
14.6±2.8 |
16.3±1.5 |
17.3±1.1 |
17.6±1.5 |
18.3±0.5 |
|
Proteus vulgaris |
20.0±1.0 |
12.6±1.5 |
13.0±1.0 |
14.6±1.1 |
16.6±0.5 |
17.0±1.0 |
|
Escherichia coli
|
20.3±1.5 |
15.0±1.7 |
15.6±2.0 |
17.3±1.1 |
18.3±0.5 |
19.0±1.7 |
DPPH radical scavenging activity
In this research, the DPPH [76] properties of synthetic ENFADH were improved in a dose-dependent manner. Useful synthetic ENFADH presented maximum DPPH scavenging trait ranging from 30.8 ± 1.3% to 81.2 ± 1.5%) and control of vitamin C ranging from 44.7 ± 1.8% to 96.0 ± 1.5%) (Fig. 8). Figure 8. DPPH scavenging consequence of diverse concentrations (200–1000 µg/ml) of ENFADH and Vitamin C. Each value signifies the mean ± SEM of triplicate experiments. Likewise, the functional derivative of ECLFADH showed a maximum H2O2 scavenging trait ranging from 37.9 ± 2.5% to 75.8 ± 6.4% and a standard of ascorbic acid ranging from 45.1 ± 2.0% to 87.2 ± 1.8% (Fig. 9). As the above consequences showed, functional derivatives of ENFADH indicated higher concentrations in need of antioxidant properties.
Anti-diabetic activities
The derivative ENFADH demonstrated α-amylase inhibition of 20.9 ± 2.4to 73.5 ± 2.3% in a dose-dependent manner (10-50mg/ml) and compared to standard of acarbose 26.4 ± 1.9 to 84.3 ± 1.3, respectively [78] considered α-amylase inhibition activities of methanolic extract of Artocarpus heterophyllus and Piper betel leaves, Cinnamomum zeylanicum bark, and Artocarpus altilis fruit.
α-glucosidase activities
The derivative ENFADH described in Fig. 11 inhibits α-glucosidase by displaying activity of 23.3 ± 1.5 to 79.7 ± 1.2 U/L in a concentration-dependent system. In contrast, compared with the standard of acarbose depicted activity of 35.4 ± 1.9 to 87.3 ± 1.5 U/L at diverse concentrations verified [78], the planned in vitro hypoglycemic activity of Swertia kouitchensis ethanolic extract in relation to α-glucosidase inhibition
Computational studies
Molecular Docking studies
Alkyl hydroperoxides, thiol-containing donor Peroxiredoxin 5, a Novel Type of Mammalian Peroxiredoxin at 1.5 Resolution, and synthetic ENFADH displayed protein (PDB code: 1HD2) with human crystal structure were employed in this ground-breaking work to produce reducing equivalents. The term "peroxiredoxins" describes a new class of peroxidases that may lower hydrogen peroxide compounds such glutathione, trypanothione, and AhpF as well as thioredoxin and glutathione-related molecules. Peroxiredoxins are present in both prokaryotes and eukaryotes. Peroxiredoxin 5 (PRDX5) is a unique mammalian thioredoxin peroxidase that is located in the cell's mitochondria, peroxisomes, and cytoplasm. It is found in a variety of tissues. The distance between Cys47 and Cys151 in the reduced form of PRDX5 is 13.8 despite the fact that these two cysteine residues are known to be crucial for peroxide reductase activity by generating an intramolecular disulfide intermediate in the oxidized enzyme. After oxidation, the enzyme would need to change its conformation in order to create a disulfide connection between the catalytic Cys47 and Cys151. In addition, a benzoate ion, a hydroxyl radical scavenger, was found close to the active-site pocket.
The binding affinities and inhibition constants Ki of all generated ligands are presented in Tables 6 and Table S6. The results suggest that all of the ENFADH ligands may strongly occupy the active position of 1HD2, with its residue interaction, types of bonds, and bond lengths shown in Tables 6 and Table S6. The Fig. 12 to 15 show the ligand-receptor hydrogen bond contacts, receptor side hydrogen bond interactions, and their 2D ligand-receptor hydrogen bond interaction ENFADH images. The binding affinity energy values and associated RMSD values (rmsd l.b and rmsd u.b) were reported for four different receptors. The inhibition constants for each chemical were also determined and given using the equation Ki = exp(G/RT), where G, R, and T stand for the docking binding energy, the gas constant (1.9872036 10− 3 kcal/mol), and ambient temperature (298.15 K, respectively). Let's examine each docking procedure for the used proteins one at a time. The inhibition constant (ki), which also measures the ligand's binding affinity to the protein, provides information about how well the ligand interacted with the substance for the enzyme. The less medicine required to stop the activity of that enzyme, the smaller the value of ki. These findings demonstrate that the ENFADH ligand interacts with the 1HD2 protein, which has a lower binding energy of -6.5 (Kcal/mol) and a higher inhibition constant (ki) of 16.989 µM.
Table 6 AutoDock Vina results of the binding affinity and RMSD values of different poses in1HD2 inhibitor of ENFADH ligand
|
Mode |
ENFADH - 1HD2 |
||
|
affinity |
rmsd l.b. |
rmsd u.b |
|
|
(kcal/mol) |
|||
|
1 |
-6.5 |
0.000 |
0.000 |
|
2 |
-6.4 |
16.752 |
20.178 |
|
3 |
-6.2 |
10.480 |
13.730 |
|
4 |
-6.2 |
7.195 |
11.125 |
|
5 |
-6.2 |
6.245 |
9.693 |
|
6 |
-6.2 |
24.081 |
26.291 |
|
7 |
-6.1 |
10.836 |
14.229 |
|
8 |
-6.1 |
19.492 |
21.737 |
|
9 |
-6.0 |
15.003 |
17.19 |
|
Inhibition Constant: 16.989 μM |
|||

Absorption, Distribution, Metabolism, Excretion, and Toxicity (ADMET) studies
The pharmacokinetic properties of a drug, such as absorption, distribution, metabolism, and excretion, have a considerable influence on its effect on the body. Predicting the development of HIA is an important factor in the design, optimization, and evaluation of oral drug applications, where medical compound absorption in the intestine has an impact on both complex physiological processes as well as passive intestinal membrane penetration, active transport pathways, and gastrointestinal metabolism). In this study, the Pre-ADMET algorithm was used to predict the ADME of curculigoside A and its derivatives. To predict absorption properties, the percentage of human intestine absorption (% HIA) and Caco-2 cell permeability were employed. Caco-2 cells, derived from human colon cancer, go through many drug transport cycles across the intestinal epithelium.
Caco-2 cells are extensively employed as an in vitro model for predicting human drug absorption, whereas HIA is the total of bioavailability and absorption as measured by the excretion ratio or cumulative excretion in urine, bile, and faces. Pre-ADMET was used to determine the distribution characteristics, which will yield a predicted plasma protein binding value. These metrics are significant because the degree of plasma protein binding of a medication influences its disposition and activity absorption [45]. The in vitro Caco-2 cell permeability properties of all the compounds in Table 7 were predicted to be good (% human intestinal absorption, % HIA), with predicted to have more absorption. The compound of ENFADH is strongly bound to plasma protein. The ability of binding protein plasma affect to drug distribution process. The toxicity of ENFADH was predicted using Toxtree. The ENFADH and its derivatives show a negative in mutagenicity and carcinogenicity.
In Table 7, was projected to have strong absorption qualities (% human intestinal absorption,% HIA), with the exception of substances ENFADH, which was anticipated to have greater absorption. As a result, this compound's in vitro Caco-2 cell permeability properties were predicted to be moderate. The title compound was shown strong bounded to plasma protein. The capability of binding protein plasma move to drug distribution method, predicted using Toxtree, and presented as a negative in mutagenicity as well as carcinogenicity.
The novel title molecule ENFADH has been synthesized and subsequently studied using 1H and 13C NMR, FTIR, and UV-Vis spectroscopy in this current study. The title molecule optimal molecular shape and the compound vibrational frequency were theoretically computed using the DFT approach, and comparisons with well-conforming experimental data were made. The electronic transition TD-DFT technique additionally examines the energies of important molecular orbitals as well as the electronic absorption wavelengths of the researched molecule. For this title compound, Mulliken population studies were conducted. The frontier molecular orbital energies were calculated, revealing a HOMO-LUMO energy gap of 3.1163 eV. In a DFT chemical reactivity investigation, the title molecule revealed a decreased softness HOMO-LUMO value of 0.3209, as shown in Table 1. The computed thermodynamic properties were completed. In-vitro antioxidant activity was also measured utilizing DPPH and H2O2 radical scavenging assays. They were determined in respect to the common antioxidant ascorbic acid. This title molecule has a high level of antioxidant activity. Based on the antioxidant data presented above, it is possible to infer that all forms of ENFADH have much higher antioxidant activity.
Furthermore, ENFADH had a substantial impact against gram-positive and gram-negative bacteria, as well as anti-diabetic action employing α--amylase and α--glucosidase. In-silico molecular docking investigation of this ligand revealed the optimum binding energy value of -6.5 (Kcal/mol) and inhibition constant (ki) value of 16.989 µM against the 1HD2 target protein. As a result, this ligand will be required as a prescription to block the Human and alkyl hydroperoxides of the 1HD2 protein. The produced α-Tetralonee derivatives of the title compound have demonstrated biochemical capability and have the potential to create remedies for different microbial, antioxidant, and cancer disorders.
Acknowledgements
The authors would like to express their sincere thanks to DST FIST lab, Theivanai Ammal College for Women (TACW), Department of Chemistry, and Villupuram, India 605401 for providing the essential research resources.
Author information
Authors and Affiliations
J. Irshad Ahamed 1,*, S.I.Davis Presley2, Venkatadri Babu3, Jayachitra.S4
1,* Department of Chemistry, Theivanai Ammal College for Women (Autonomous), Affiliated to the Annamalai University, Chennai – Trichy Trunk Road, Villupuram, Tamil Nadu – 605401.
2epartment of Chemistry, Sri Sivasubramaniya Nadar College of Engineering. Kalavakkam-603110.
3 Department of Life Sciences, The National Institute for Biotechnology in the Negev, Ben-Gurion University of the Negev, Beer-Sheva 84105, Israel
4Department of Chemistry, S.A.Engineering College, Poonamallee, Avadi Road Veeraraghavapuram, Thiruverkadu, Tamil Nadu 600077.
Ethics declarations
Conflict of interest
The authors declare that there are no conflicts of interest.
Authors’ contributions
J. Irshad Ahamed was responsible for conceptualization, investigation, writing the original draft, and writing, reviewing, editing, contributed to molecular docking, DFT computational , and biological studies.
S.I. Davis Presley and Jayachitra. S have taken part in investigation and writing.
Venkatadri Babu contributed to some in-vitro studies
Funding
The authors confirm that they have no known financial or interpersonal conflicts that may have looked to have influenced the research presented in this study.
Availability of data and materials
Publisher’s Note Springer Nature remains neutral with regard to jurisdictional claims in published
Maps and institutional affiliations.
- N.K. Sahu , S.S. Balbhadra , J. Choudhary , D.V. Kohli , Curr. Med. Chem. 19, 209 (2012)
- P. Singh , A. Anand , V. Kumar, Eur. J. Med. Chem. 85, 758 (2014)
- C. Karthikeyan, N.S. Moorthy, S. Ramasamy, U. Vanam, E. Manivannan, D. Karunagaran, P. Trivedi, Anti-Cancer Drug Discov. 10, 97 (2015)
- A. Khan, S. Parveen, A. Khalid, S. Shafi, Inorganica Chim. Acta. 505, 119464 (2020)
- A. Mascarello , L.D. Chiaradia, J. Vernal, A. Villarino, R.V. Guido, P. Perizzolo, V. Poirier , D. Wong, P.G. Martins, R.J. Nunes, R.A. Yunes, A.D. Andricopulo, Y. Av-Gay , H. Terenzi, Bioorg. Med. Chem. 18, 3783 (2010)
- D.K. Mahapatra, S.K. Bharti, V. Asati, Eur. J. Med. Chem. 98, 69 (2015)
- A. Gomez-Rivera, H. Aguilar-Mariscal, N. Romero-Ceronio, L.F. Roa-de la Fuente, C.E. Lobato-Garcia,Bioorg. Med. Chem. Lett. 23, 5519 (2013)
- N. Aoki, M. Muko, E. Ohta, S. Ohta, J. Nat. Prod. 71, 1308 (2008)
- S.N.ABukhari, I.Jantan, V.H.Masand, D.T.Mahajan, M.Sher,M.Naeem-ul-Hassan, M.W. Amjad, Eur.J.Med,Chem. 83, 355 (2014)
- S. Arora , A. Pareek , N. Agrawal , B. Nagori, Int. J. Res. Pharm. Chem. 3, 797 (2013).
- M. Štefanišinová, V. Tome ˇcková, M. Kožurková, A. Ostró, M. Mareková, Acta Part A 81, 666 (2011)
- V. Tome ˇcková, J. Guzy , J. Kušnír , K. Fodor , M. Mareková, Z. Chavková, P. Per- jési, J. Biochem. Biophys. Methods. 69, 143 (2006)
- P. Katila , A . Shrestha , A . Shrestha Ritina Shrestha , P.-H. Park , E. SeokLee, Bioorg. Chem. 87, 495 (2019)
- Z. Zhu, K.Yu. Koltunov, Mendeleev Commun. 26, 79 (2016)
- S. Lee, S.P. Frescas, D.E. Nichols, Synth.Commun, 25, 2775 (1995)
- M.S. Newman, J.O. Landers, J.Org.Chem. 42, 2556 (1977)
- L. Borsub, Y. Thebtaranonth, S. Ruchirawat, C. Sadavongvivad, Tetrahedron Lett. 17, 105 (1976)
- A.K. Banerjee, L. Bedoya, M.E. Adherían, W.J. Vera, E.V. Cabrera, E.R. Kariney, J.Chem.Res. 34, 522 (2010)
- A.M. Abdula, EurJOC. 4, 207 (2013)
- Z. Puterová, A. Krutošíková, A. Lyčka, T. Ďurčeková, Mol. 9, 241 (2004)
- Z. Puterová, H. Sterk, A. Mol. 9, 11 (2004)
- M. Nowicki, M. Zaranek, P. Pawluć, M. Hoffmann, Catal. Sci. Technol. 10, 1066 (2020)
- J. Irshad Ahamed, F. K, A.V. Priya, J. PremaKumari, R.P. Steiny, P. Kamalarajan, B. Venkatadri, J.Mol.Struct.1252, 132186 (2022)
- J. Irshad Ahamed, G.R. Ramkumaar, P. Kamalarajan, K. Narendran, M.F. Valan, T.A. Sundareswaran, B. Venkatadri, S. Bharathi, J. Mol. Struct. 1248, 131418 (2022)
- H.B. Schlegel, J. Comput. Chem. 3, 214 (1982)
- N. Subramanian, N. Sundaraganesan, S. Sudha, V. Aroulmoji, G.D. Sockalingam, M. Bergamin, Spectrochim. Acta A Mol. 78, 105 (2011)
- J. Irshad Ahamed , M.F. Valan, K. Pandurengan, P. Agastian, B. Venkatadri, M.R. Rameshkumar, K. Narendran. Res. Chem. Intermed. 47, 759 (2021)
- J. Foresman, E. Frish, Gaussian Inc., Pittsburg, USA. 1996.
- P.J. Hay, W.R. Wadt, Chem.Phys. 82, 270 (1985)
- J. Zhao, Y. Zhang, L. Zhu, J. Mol. Struct. THEOCHEM. 671, 179 (2004)
- M.K. Abdel-Latif, H.R. Abd El-Mageed, H.S. Mohamed, F.M. Mustafa, J. Mol. Struct. 1200, 127056 (2020)
- P. Ramesh, M. Lydia Caroline, S. Muthu, B. Narayana, M. Raja, S. Aayisha, J. Mol. Struct. 1200, 127123 (2020)
- J.Irshad Ahamed, M. Priya, P. Vinothkumar, K. Sathyamoorthy, P. MuraliManohar, J. Liu, M.F. Valan, J. Mol. Struct. 1202, 127241 (2020)
- J. Irshad Ahamed, M.F. Valan, K. Pandurengan, P. Agastian, B. Venkatadri, M.R. Rameshkumar, K. Narendran, Res. Chem. Intermed. 47, 759 (2021)
- J. Irshad Ahamed., k. Narendran, V.R. Ambika, R. Priya, P. Kamalarajan, T. Sundareswaran, B. Gunasekaran, S. Jayalakshmi, J. Mol. Struct. 1266, 133548 (2022)
- R. Ditchfield, L.C. Snyder, Chem.Phys. 56, 5823 (1972)
- T. Hatano, H. Kagawa, T. Yasuhara, T. Okuda, Chem.Pharm.Bull. 36, 2090 (1988)
- V. Suresh, N. Senthilkumar, R. Thangam, M. Rajkumar, C. Anbazhagan, R. Rengasamy, P. Gunasekaran, S. Kannan, P. Palani, Separation, Process Biochem. 48, 364 (2013)
- V. Babu, S. Arokiyaraj, S.P. Sakthi Sri, M. George, R.M. Ragavan, D. Dharmalingam, T. Oh, S. Ramasundaram, P. Agastian, Molecules. 12, 7792 (2022)
- B. Venkatadri, A. Khusro, C. Aarti, M.R. Rameshkumar, P. Agastian, Asian Pac. J. Trop. Biomed.7, 782 (2017)
- L. Wan, M. Zeiler, S. Zhang, Y. Le Cun, R. Fergus, 2013, In International conference on machine learning. PMLR. 1058 (2013)
- C. Diallo, U. Venkatadri, A. Khatab, S. Bhakthavatchalam, Int. J. Prod. Res. 55, 1277 (2017)
- E.B. Miller, R.B. Murphy, D. Sindhikara, K.W. Borrelli, M.J. Grisewood, F. Ranalli, S.L. Dixon, S. Jerome, N.A. Boyles, T. Day, P. Ghanakota, S. Mondal, S.B. Rafi, D.M. Troast, R. Abel, R.A. Friesner, J. Chem. Theory Comput. 17, 2630 (2021)
- G. Heinzelmann, M.K. Gilson, Sci.Rep. 11, 1116 (2021)
- M.L. Brandeau, S.S. Chiu, Manage Sci. 35, 645 (1989)
- V.Z. Spassov, L. Yan, Protein Sci. 17. 1955 (2008)
- G.M. Morris, D.S. Goodsell, R.S. Halliday, R. Huey, W.E. Hart, R.K. Belew, A.J. Olson, J. Comput. Chem. 19, 1639 (1998)
- Visualizer, D. S. Accelrys software inc.Discovery Studio Visualizer, (2005).
- J.L. Araújo, L.A.D. Sousa, A.O. Sousa, R.S. Bastos, G.T. Santos, M.R. Lage, S.R. Stoyanov, I.N Passos, R.B.D. Azevedo, J.A. Rocha, J. Braz. Chem. Soc. 32, 1628 (2021)
- C. Helma, S. Kramer, Bioinformatics. 19, 1179 (2003)
- A. Rauk, Orbital interaction theory of organic chemistry. John Wiley & Sons. 2004.
- A. Teimouri, A.N. Chermahini, K. Taban, H.A. Dabbagh, Spectrochimica Acta, Part A. 72, 369 (2009)
- E. Eroglu, H. Türkmen, CA-II, J. Mol. Graph. Model. 26, 701 (2007)
- M. Suresh, M. Syed Ali Padusha, S. Bharanidharan, H. Saleem, A. Dhandapani, S. Manivarman, Spectrochimica Acta, Part A. 144, 243 (2015)
- J.Irshad Ahamed, M.F. Valan, K. Pandurengan, P. Agastian, B. Venkatadri, M.R. Rameshkumar, K. Narendran, Res. Chem. Intermed. 47, 759 (2020)
- D. Naumann, R. Meyers, John Wiley & Sons, Chichester, UK, 102 (2000)
- W.B. Collier, T.D. Klots, Spectrochimica Acta, Part A. 51, 1255 (1995)
- T.U. Rahman, M. Arfan, T. Mahmood, W. Liaqat, M.A. Gilani, G. Uddin, R. Ludwig, K. Zaman, M.I. Choudhary, K.F. Khattak, K. Ayub, Isolation, Spectrochimica Acta, Part A. 146, 24 (2015)
- S. Kundoo, A.N. Banerjee, P. Saha, K.K. Chattopadhyay, Mater. Lett. 57, 2193 (2003)
- C. Yohannan Panicker, H.T. Varghese, V.S. Madhavan, S. Mathew, J. Vinsova, C. Van Alsenoy, Y. Sheena Mary, Y. Shyma Mary, J.Raman Spectrosc. 40, 2176 (2009)
- K.B. Beć, J. Grabska, C.W. Huck, 2022. Compr. Anal. Chem. 98, 1 (2022)
- N. Dege, H. Gökce, O.E. Doğan, G. Alpaslan, T. Ağar, S. Muthu, Y. Sert, Colloids Surf. A: Physicochem. Eng. 638, 128311 (2022)
- A. Perjéssy, D. Rasala, P. Tomasik, R. Gawinecki, Collect. Czech. Chem. Commun. 50, 2443 (1985)
- F. Brown, J. Am. Chem. Soc. 77, 6341 (1955)
- T.K. Kuruvilla, J.C. Prasana, S. Muthu, J. George, J. Mol. Struct. 1157, 519 (2018)
- S. Sakthivel, T. Alagesan, S. Muthu, C.S. Abraham, E. Geetha, J. Mol. Struct. 1156, 645 (2018)
- J. Jayasudhaa, V. Balachandrana, Ann. Romanian Soc. Cell Biol. 28, 5674 (2021)
- E. B. Elkaeed, E.U. Mughal, S. Kausar, H.A. Al-ghulikah, N. Naeem, A.A. Altaf, A. Sadiq, J. Mol. Struct. 1270, 133972 (2022)
- G. Vengatesh, M. Sundaravadivelu, Res. Chem. Intermed. 45, 4395 (2019)
- D. Jacquemin, J. Preat, E.A. Perpete, Chem. Phys. Lett. 40, 254 (2005)
- D. Jacquemin, J. Preat, M. Charlot, V. Wathelet, J.M. Andre, E.A. Perpete, J. Chem. Phys. 121, 1736 (2004)
- M. Cossi, V. Barone, J. Chem. Phys. 115, 4708 (2001)
- N.M. O’Boyle , A.L. Tenderholt , K.M. Langner , J. Comp. Chem. 29, 839 (2008)
- C.S. Abraham, J.C. Prasana, S. Muthu, Spectrochimica Acta, Part A. 181, 153 (2017)
- V. Babu, S. Arokiyaraj, S.P. Sakthi Sri, M. George, R.M. Ragavan, D. Dharmalingam, T. Oh, S. Ramasundaram, P. Agastian, Molecules. 27, 7792 (2022) 7792.
- B. Venkatadri, A. Khusro, C. Aarti, M.R. Rameshkumar, P. Agastian, Asian Pac. J. Trop. Biomed. 7, 782 (2017)
- S.S. Nair, V. Kavrekar, A. Mishra, Eur. J. Exp. Biol. 3, 128 (2013)
- P. Dey, J. Singh, J. K. Suluvoy, K. J. Dilip, J. Nayak, Nat. Prod. Bioprospecting. 10, 431 (2020)
Scheme 1 is available in the Supplementary Files section.
No competing interests reported.
- Scheme.1.png
Scheme. 1 Synthetic route for ENFADH.
- SupportingInformation.docx