MC shortened cotton seedling internodes by reducing cell division and cell elongation
First, we checked the effect of MC treatment on cotton seedling growth. Cotton seedlings at the three-leaf stage were treated with foliar spray of 80 mg/L MC. Ten days after MC treatment, plant height decreased by 40 % compared to that of control plants (Fig. 1a). The height of the first, second, third, and fourth internodes (from bottom to top of the stem) decreased by 46, 55, 52, and 83 %, respectively (Fig. 1b, c). The elongation of the second internode—the first visible and youngest sub-apical internode at the time of MC treatment—was inhibited more severely than that of the first internode by MC application; therefore, the second internode was used for further study. The length of the second internode was reduced by 10, 31, 49, 53, and 55 % at 2, 4, 6, 8, and 10 d after MC treatment, respectively (Fig. 1d). The inhibition of internode elongation by MC was time-dependent.
Internode elongation involves both cell division and cell elongation. To determine the contribution of cell division and elongation to the shortening of internodes by MC application, we evaluated cell length and number along the vertical axes of the second internode at the tenth day after MC treatment. The longitudinal cells in the cortex and pith of MC-treated internodes were significantly smaller than those of control internodes (Fig. 2a, b, c, d). The average longitudinal cell length of MC-treated internodes was 27 % smaller than that of the control internodes (Fig. 2e). The cell number along the second internode of the MC-treated plants was 21 % less than that of the control plants (Fig. 2f). Therefore, MC shortened internodes by suppressing both cell division and elongation.
Overview of the transcriptome profile of the second internode in response to MC treatment
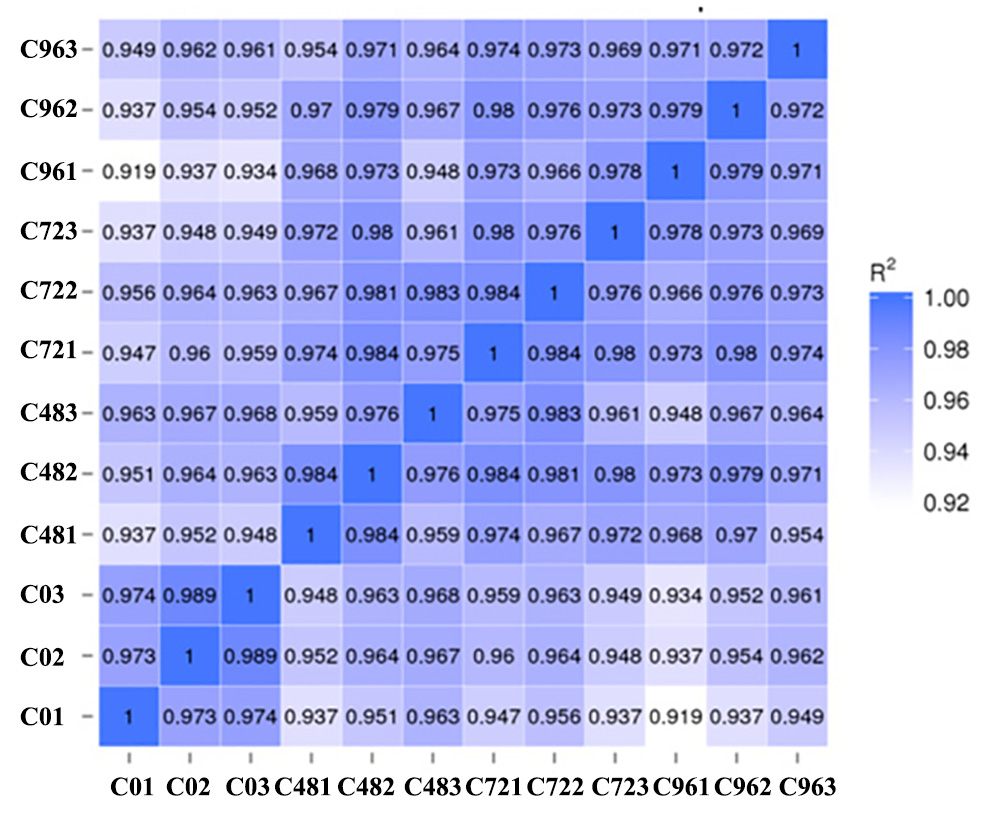
To investigate the transcriptional regulatory mechanisms underlying the inhibition of internode elongation by MC, we analyzed the transcriptome profiles of the second internodes of cotton seedlings from the control (water, 0 h) and MC-treated plants (48, 72, and 96 h after MC treatment). In all, 12 RNA-Seq libraries were constructed and sequenced. An overview of the RNA-Seq sequencing reads derived from the 12 libraries is shown in Table 1. After adaptor sequence and low-quality reads were removed, each library generated 64.9 to 74.6 million clean reads (Table 1). All 12 libraries had a constant GC content of approximately 43 % and high Q30 percentage of approximately 94 %. The proportion of clean reads mapped to the cotton genome ranged from 94.8 to 96.2 %, and that of the uniquely mapped reads ranged from 87.3 to 89.1%. The R2 value between biological replicate samples was greater than 0.96, which was higher than the required R2 of 0.92 under ideal sampling and experimental conditions (Additional file 1: Figure S1). Therefore, the libraries and sequencing quality were considered to be excellent, with good repeatability among samples.
Differentially expressed genes (DEGs) in response to MC treatment
To determine the gene expression changes in the internodes resulting from MC treatment, we normalized gene expression by using the fragments per kilobase of exon per million fragments mapped (FPKM) value. Transcripts with |log2 (fold change)|>1, false discovery rate (FDR) <0.05 and more than 1 FPKM in at least one sample of each comparison were considered as DEGs. Compared with that in the control (0 h), 1378 (645 upregulated and 733 downregulated), 2751 (1086 upregulated and 1665 downregulated), and 3459 (1479 upregulated and 1980 downregulated) DEGs were identified after MC treatment for 48, 72, and 96 h, respectively (Fig. 3a). The numbers of both up- and down-regulated DEGs increased with time. As shown in the Venn diagrams (Fig. 3b), 1058 (456 upregulated and 602 downregulated) DEGs were shared between 48 vs. 0 h and 72 vs. 0 h; 1675 (560 upregulated and 1115 downregulated) DEGs, between 72 vs. 0 h and 96 vs. 0 h; and 849 (323 upregulated and 526 downregulated) DEGs, between 96 vs. 0 h and 48 vs. 0 h. Among them, 273 and 490 genes were constantly induced or suppressed by MC treatment, respectively.
Functional analysis of the DEGs in response to MC
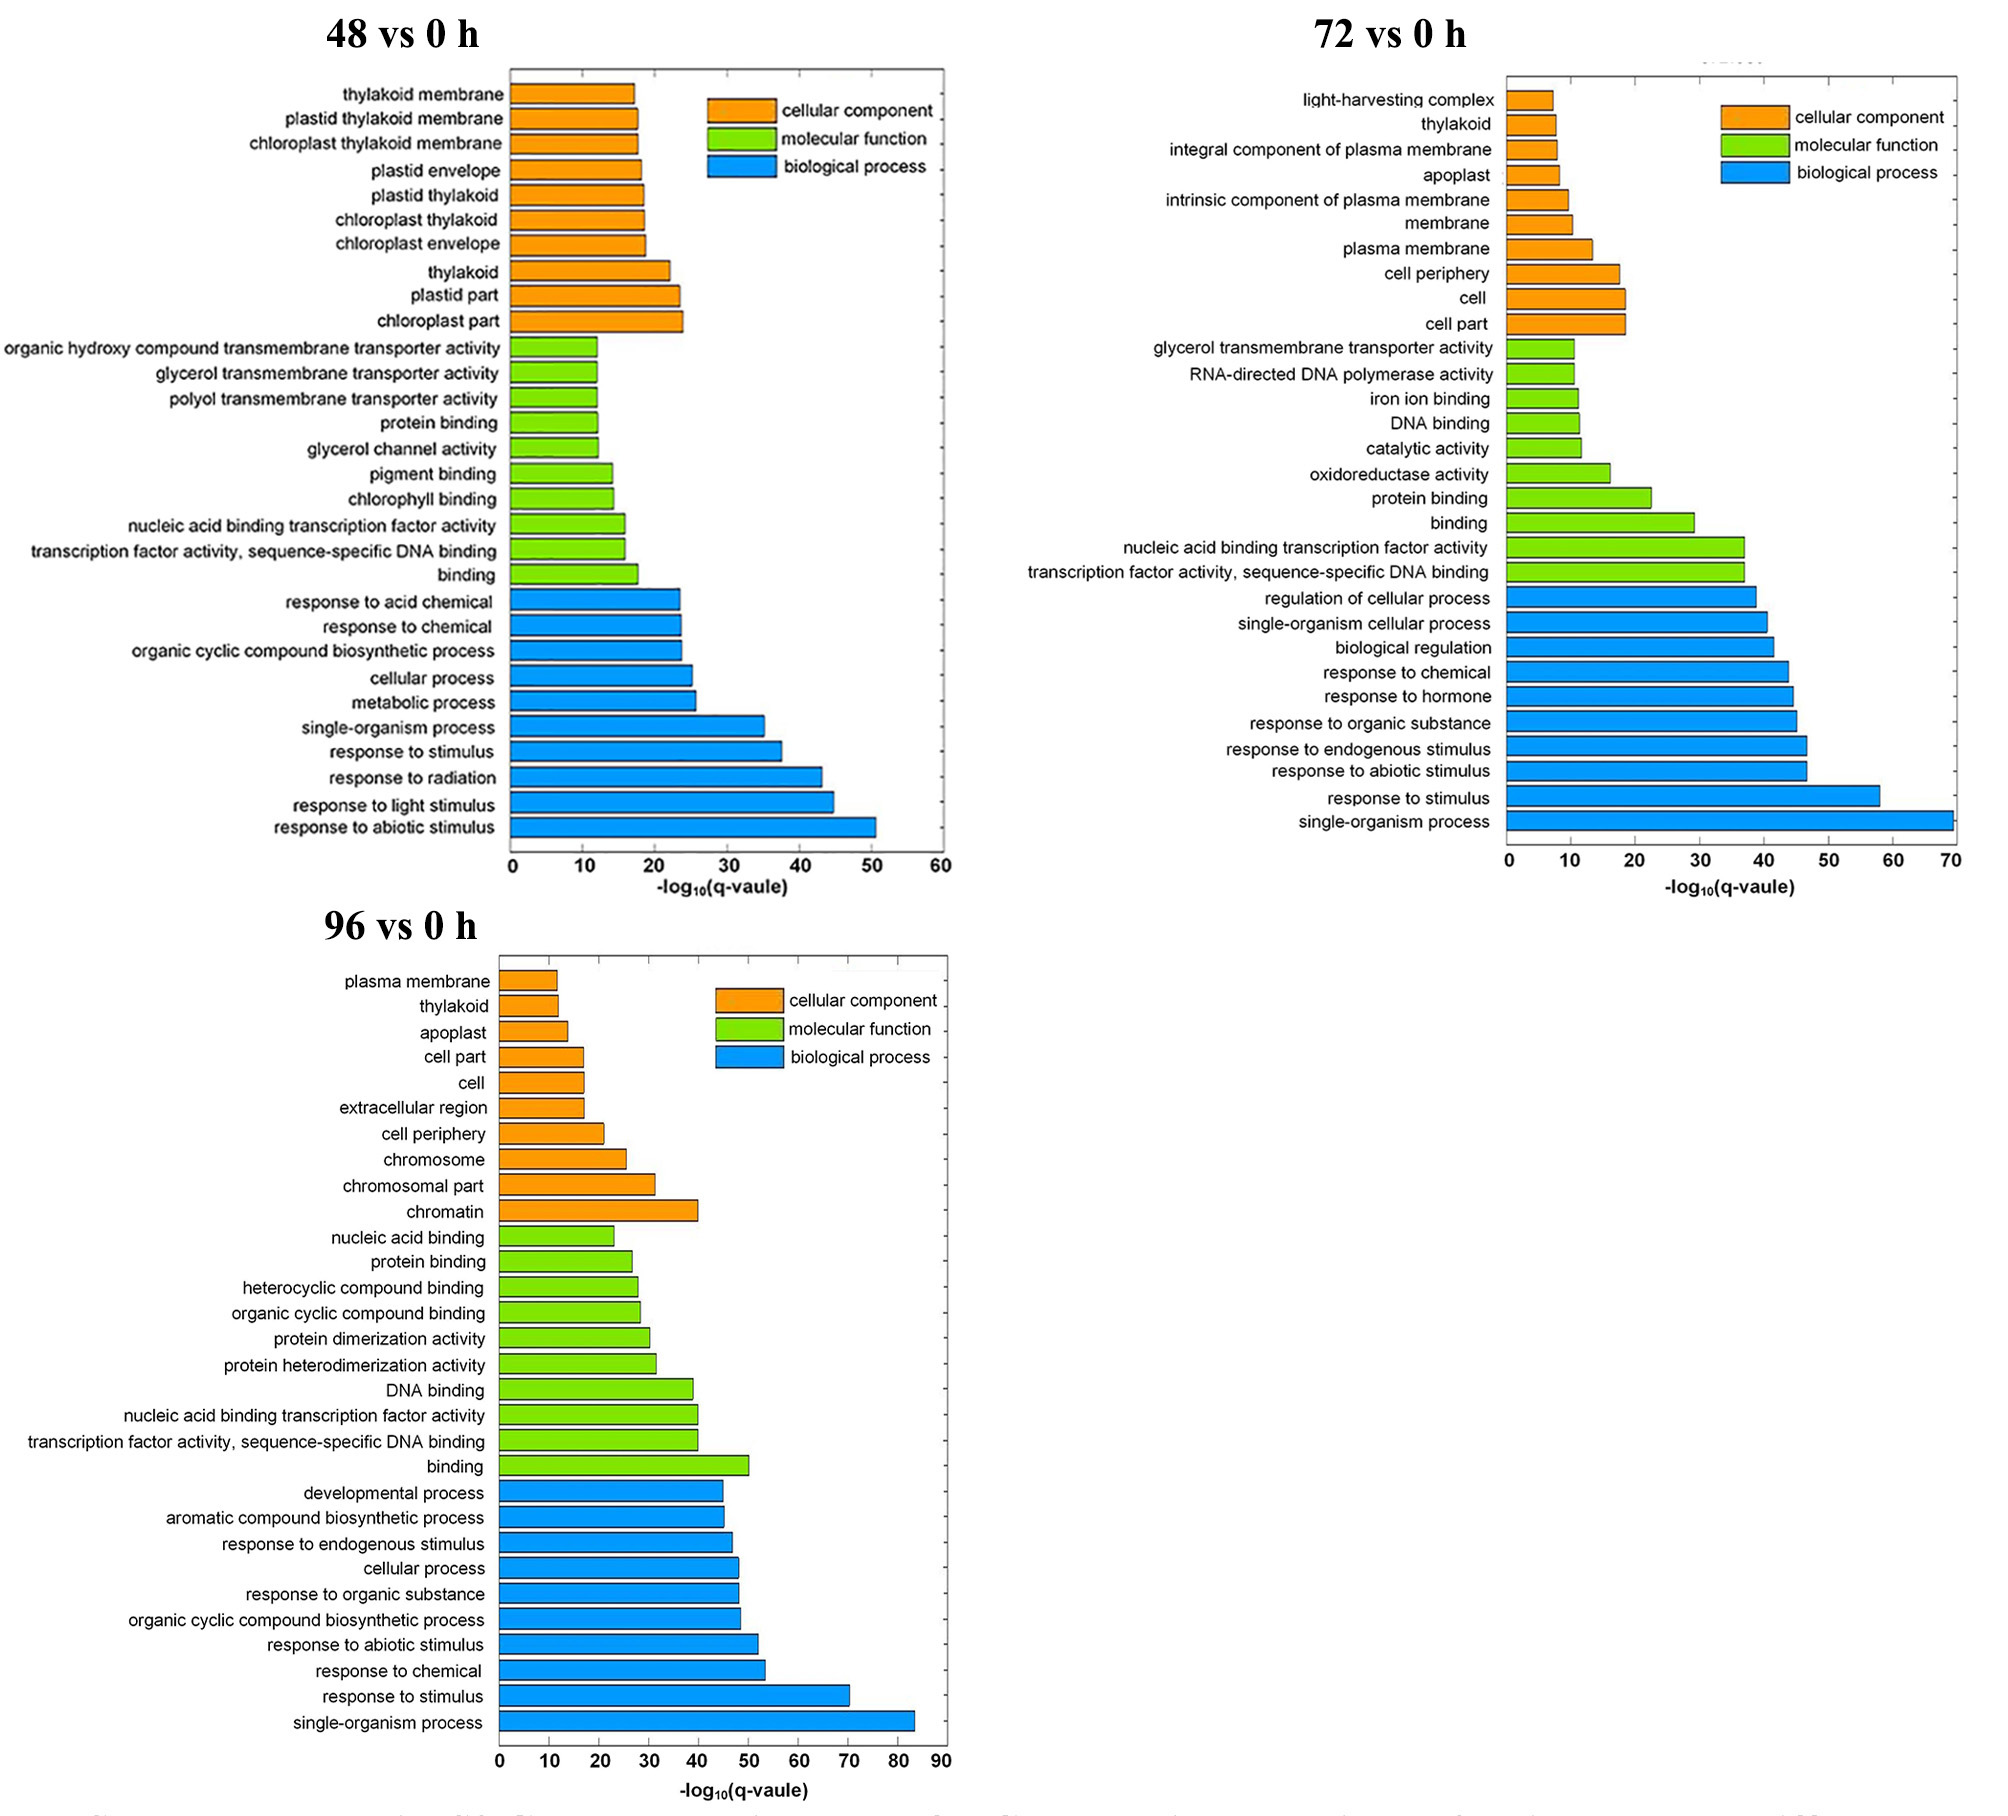
To better understand the potential function of DEGs responding to MC application, we conducted Gene Ontology (GO) and Kyoto Encyclopedia of Genes and Genomes (KEGG) enrichment analyses for pairwise comparisons. GO enrichment was annotated according to biological process, cellular component, and molecular function (Additional file 2: Fig. S2). In general, for the biological process and molecular function groups, enrichment patterns of DEGs were similar at 48, 72 and 96 h. In the biological process category, the most dominant terms were “single-organism process,” “response to stimulus,” and “response to abiotic stimulus.” In the molecular function category, the most highly represented GO terms were associated with “binding,” “transcription factor activity, sequence-specific DNA binding,” and “nucleic acid binding transcription factor activity.” However, in the cellular component category, the top three enriched GO terms were different among the DEGs at the three time points: “chloroplast part,” “plastid part,” and “thylakoid” were dominantly enriched at 48 h; “cell part,” “cell,” and “cell periphery” were enriched at 72 h; whereas “chromatin,” “chromosomal part,” and “chromosome” were enriched at 96 h.
For the KEGG pathway enrichment analysis, 89, 73, and 82 pathways were categorized from pairwise comparisons between 48 vs. 0 h, 72 vs. 0 h and 96 vs. 0 h, respectively (Additional file 3: Table S1). The top 20 enriched KEGG pathways of each comparison are shown in Fig. 4. The most significantly enriched KEGG pathways in the 48 vs. 0 h DEGs was photosynthesis-antenna proteins, followed by circadian rhythm-plant, biosynthesis of secondary metabolites, metabolic pathways, and thiamine metabolism. Five KEGG pathways were identified to be significant for the DEGs from the 72 vs. 0 h as well as 96 vs. 0 h comparison, which included biosynthesis of secondary metabolites, plant hormone signal transduction, fatty acid elongation, circadian rhythm-plant, and photosynthesis-antenna proteins.
DEGs related to cell cycle and cell expansion
Based on the reduced cell number and length in MC-treated internodes, we investigated the changes in the expression of genes related to cell cycle and cell wall. In total, 57 DEGs were found to be related to cell cycle and cell division (Fig. 5a, Additional file 4: Table S2). Interestingly, most of these genes were significantly downregulated, including cyclin genes (CYCA1;1, CYCA2;2, CYCA2;3, CYCA3;2, CYCB2;4, CYCD3;1, CYCD3;2, CYCD4;1, CYCU1;1, CYCU2;1, CYCU4-1), cyclin-dependent kinase B1;2 (CDKB1;2), cyclin-dependent kinase regulatory subunit 1 (CKS1), E2F transcription factor-like (E2FF), G2/mitotic-specific cyclin-1 (CCNB1), peptidyl-prolyl cis–trans isomerase (FKBP65), cell division control proteins (CDC2, CDC7, CDC45), cytochrome P450 78A (CYP78A3, CYP78A5, CYP78A7), syntaxin-related protein (KNOLLE), mitotic spindle checkpoint protein (BUBR1), MFP1 attachment factor 1 (MAF1), and meiotic nuclear division protein 1 (MND1). However, nine cell cycle-related genes were upregulated, such as cyclin-dependent kinase inhibitor (KRP6 and KRP7) and cell number regulator 1 (CNR1; Additional file 4: Table S2).
Cell wall architecture is a key determinant of plant growth. We identified 75 DEGs involved in the biosynthesis and modification of cell wall (Fig. 5b, Additional file 5: Table S3). Most of these genes were highly expressed in the control internodes, such as cell wall proteins [arabinogalactan peptides (AGPs) and fasciclin-like arabinogalactan proteins (FLAs)], α-expansins (EXPAs), and xyloglucan endotransglycolase/hydrolases (XTHs). Among these DEGs, 45 genes were significantly downregulated by MC, including three cellulose synthase-like protein G3 (CSLG3), one glucuronoxylan glucuronosyltransferase 7 (IRX7), two pectinesterase (PME68), five pectinesterase/pectinesterase inhibitor (PMEI), three galacturonosyltransferase-like (GATL1, GATL7, GATL9), four AGPs (AGP20, AGP30), four FLAs (FLA2, FLA8), three leucine-rich repeat extensin-like protein (LRX2, LRX4), one BURP domain-containing protein 17 (BURP17), one putative cell wall protein, six EXPAs (EXPA4, EXPA8, EXPA15), and twelve XTHs (XTH2, XTH8, XTH9 and XTH32). Notably, the expression of cell wall protein-encoding genes, BURP17, LRX4, EXPAs (Gh_D10G1145, Gh_A10G2323 and Gh_D05G2934), and XTHs (Gh_D02G0220, Gh_A10G0146, Gh_A11G2885, and Gh_D11G3271) showed more than 2-fold down-regulation at 96 h after MC treatment.
Cell division and expansion require the continuous uptake of water to maintain turgor pressure. Aquaporins (AQPs) play crucial roles in the transport of water and other small molecules across membranes in plants [38]. According to sequence similarity and sub-cellular localization, AQPs are divided into five subgroups: plasma membrane intrinsic proteins (PIPs), tonoplast intrinsic proteins (TIPs), nodulin26-like intrinsic proteins (NIPs), small basic intrinsic proteins (SIPs), and X intrinsic proteins (XIP) [39]. PIPs can be further divided into PIP1 and PIP2, on the basis of sequence similarity. To assess whether and which subfamily members of AQPs are affected by MC treatment, we analyzed the differentially expressed AQPs. Our RNA-Seq data showed that some members of PIPs and TIPs were highly expressed in the internodes of control plants (Fig. 5c, Additional file 6: Table S4). In contrast, 19 PIPs and 7 TIPs were consistently suppressed after MC treatment, and only three PIPs were induced by MC (Fig. 5c). The expression level of three PIPs (Gh_A01G1843, Gh_D09G1409, and Gh_D01G2086) and three TIPs (Gh_D03G1253, Gh_D10G2205, and Gh_A10G1912) was decreased by more than 2-fold. The decreased expression of PIPs and TIPs may have contributed to the inhibition of internode elongation by MC.
DEGs related to hormone metabolism and signal transduction
To investigate the roles of hormones in the inhibition of internode elongation by MC, we identified DEGs involved in the phytohormone metabolism, transport, and signal transduction pathways by comparing the profiles after and before MC treatment. About 155 hormone-related DEGs were detected after treatment with MC (Fig. 6, Additional file 7: Table S5). Most of these genes belonged to auxin metabolism and response pathways, followed by GA, ethylene, CK, and ABA; relatively fewer DEGs were related to salicylic acid (SA) and jasmonic acid (JA; Fig. 6). Most of the DEGs showed decreased expression except for the CK pathway-associated DEGs, which were generally induced by MC treatment (Fig. 6).
Thirty-two DEGs related to GA were found to be responsive to MC application (Fig. 6a). In the GA metabolism pathway, seven DEGs were found to be downregulated after MC treatment, including one biosynthetic gene (KAO, Gh_Sca030829G01) and six catabolic genes (five GA2ox1 and one CYP714A1), whereas genes encoding another KAO (Gh_A06G1386), two ent-copalyl diphosphate synthase (KS), one GA 20 oxidase 2 (GA20ox2), and one GA 2 oxidase2 (GA2ox2) were upregulated by MC. In the GA signal transduction pathway, 14 genes encoding GRAS family regulatory proteins, including DELLA (GAI, RGA2, SCR, SHR, and PAT1), and genes encoding GID1 were downregulated at different time points (Additional file 7: Table S5).
Of the 39 DEGs related to auxin pathway, the genes related to auxin biosynthesis (TAR2), catabolism (GH3), signaling (TIR1, ARF9, AUX22, AUX6B, AUX15A, AUX10A, IAA4, IAA14, IAA29, and IAA26), and transport (PIN1, PIN5 and PIN6) were downregulated at different time points (Fig. 6b). Eight genes encoding auxin-responsive proteins, including SAUR66, SAUR20, and SAUR71, were also significantly downregulated (Additional file 7: Table S5).
Expression of 23 DEGs involved in CK biosynthesis, modification, transport, and signaling was altered in response to MC (Fig. 6c). IPT3 (Gh_A11G3078), encoding a rate-limiting enzyme in CK biosynthesis, was upregulated by 2.9-, 3.2-, and 3.6-fold at 48, 72, and 96 h after MC treatment, respectively, whereas another IPT3 (Gh_D11G3514) was downregulated only at 48 h after treatment. Gh_D11G1669, a cytokinin hydroxylase (CYP735A1), was significantly induced by MC treatment. The expression of four orthologs of CYTOKININ OXIDASES/DEHYDRO-GENASES (CKX6 and 7) involved in the irreversible degradation of CKs was significantly upregulated at different time points, and only CKX1 was downregulated. The gene encoding CK transporter purine permease 11 (PUP11) was also upregulated. The expression of UGT76C2, which encodes a glycosyltransferase that catalyzes the N-glycosylation of CK, was downregulated. The expression of three genes (LOG3 and LOG5) encoding CK-activating enzymes was significantly decreased, especially at 96 h after MC treatment. ARRs are associated with CK signal transduction pathway; nine induced ARR genes (two B-type ARRs, five A-type ARRs, and two B-ARR-like genes) and four suppressed ARR-like genes were identified after MC treatment (Additional file 7: Table S5).
Six DEGs were found to be related to ethylene biosynthesis (Fig. 6d). Among them, a gene encoding one S-adenosyl methionine (SAM) synthase, one 1-aminocyclopropane-1-carboxylate (ACC) synthase (ACS), and one homolog of ACC oxidase (ACO) were significantly downregulated in response to MC; interestingly, the ACO homolog was downregulated by 2.0- and 5.2-fold at 72 and 96 h, respectively. However, three ACO genes were upregulated, especially at 48 h after MC treatment. In the ethylene-response pathway, eighteen DEGs were found to be downregulated by MC, including one ETR2, one EBF1, fourteen ethylene-responsive TFs (ERF, WRI1, TINY, AIL6, ANT, RAP23, and CRF5), and two REVERSION-TO-ETHYLENE SENSITIVITY1 (RTE1) genes (Additional file 7: Table S5).
In the ABA biosynthesis pathway, one gene encoding 9-cis epoxy carotenoid dioxygenase3 (NCED3) and one ABA 8ʹ-hydroxylase (ABAH) encoding gene were upregulated by MC, whereas one zeaxanthin epoxidase (ZEP) gene and two ABAHs were consistently suppressed (Fig. 6e). Fifteen ABA signaling-related genes were identified as DEGs, with eight downregulated genes (PYL4, PYL6, PP2C27, PP2C34, and PP2C38) and five upregulated ones (ABI5, PP2C35, and PP2C59; Additional file 7: Table S5).
Two CYP90A1/CPD (constitutive photomorphogenesis and dwarfism) genes involved in BR biosynthesis were significantly downregulated by MC treatment (Fig. 6f). However, Gh_A04G0959 (BAK1), encoding a receptor kinase mediating BR signaling, was upregulated 96 h after MC treatment. Five BR signaling components BR-ENHANCED EXPRESSION (BEE) were significantly downregulated by MC treatment, including one BEE1, two BEE2, and two BEE3 (Additional file 7: Table S5).
The expression of Gh_A12G2643, isochorismate synthase 1 (ICS1) involved in SA biosynthesis; Gh_D12G0595 and Gh_A12G0584, salicylate carboxymethyltransferase (SAMT) related to the conversion of SA to SA methyl ester; and Gh_D11G1910, salicylic acid-binding protein 2 (SABP2) converting MeSA to SA, was suppressed by MC (Fig. 6g). In the SA response pathway, one NPR3, an SA receptor, was significantly upregulated. In the JA biosynthesis and signaling pathway, only two allene oxide synthase AOS/CYP74A genes were downregulated by MC treatment (Fig. 6h).
DEGs related to lignin and flavonoid metabolism
KEGG enrichment showed that DEGs involved in secondary metabolism were overrepresented in response to MC treatment. In this study, we mainly focused on the DEGs related to lignin and flavonoid metabolism, which are associated with plant growth [16, 17]. The biosynthetic pathways leading to lignin and flavonoid diverge at the common intermediate p-coumaroyl CoA. A total of 37 genes involved in lignin biosynthesis were differentially expressed in the internodes between MC-treated and control plants (Fig. 7a, Additional file 8: Table S6). Among these genes, 22 DEGs were downregulated by MC, including two 4-coumarate-CoA ligase (4CL), one 4-coumarate-CoA ligase-like (4CLL), two caffeoylshikimate esterase (CSE), four shikimate O-hydroxycinnamoyltransferase (HCT), one caffeic acid 3-O-methyltransferase (COMT), one cinnamyl alcohol dehydrogenase (CAD), one cinnamoyl-CoA reductase (CCR), four laccase (LAC), and six peroxidase (PRX). Notably, one HCT showed more than 2.5-fold down-regulation after MC treatment. Fifteen DEGs were upregulated, including one 4CL, two CSE, two COMT, one CAD, one LAC, and eight PRX.
In total, 14 DEGs involved in flavonoid biosynthesis were identified (Fig. 7b, Additional file 8: Table S6). Among these DEGs, 10 were downregulated by MC, including two CHS, one leucoanthocyanidin dioxygenase (LDOX), two flavonol synthase (FLS), one flavanone 3-dioxygenase, one flavonoid 3-O-glucosyltransferase, two anthocyanin 5-aromatic acyltransferase, and one flavonol sulfotransferase-like. The catalysis of CHS is the initial step of the flavonoid biosynthesis pathway. Interestingly, two CHS genes showed significant down-regulation at different time points after MC treatment, with more than 3-fold down-regulation both at 72 and 96 h.
Differentially expressed TFs
The changes in gene expression level are known to be closely related to the alterations of TFs. We identified 497 differentially expressed TFs that belong to 46 different families, including MYB, Orphans, bHLH, AP2-EREBP, HB, WRKY, NAC, bZIP, GRAS, AUX/IAA, GRF, and TCP, in response to MC treatment (Additional file 9: Table S7). Some important TFs are shown in Fig. 8. Most of the MYBs were downregulated (Additional file 9: Table S7), including genes functioning in plant circadian clock and ABA accumulation [40] and those associated with the ABA signal pathway [41]. The bHLH TFs play important roles in the control of cell elongation. Five BEEs (BEE1, BEE2, and BEE3), BR early-response genes and associated with BR-regulated cell elongation [42], and four PREs (PRE5, PRE6) were significantly downregulated. In addition, four bHLH36 showed more than 3.2-fold up-regulation at different time points after MC treatment. The expression of AP2/EREBP family TFs was altered in MC-treated internodes. Twelve ERF genes involved in ethylene signaling and response pathway were also downregulated in response to MC. Two ANT and CRF5 genes each were downregulated. Among Orphans family TFs, fourteen BBX (BBX19, BBX24, BBX32) TFs were significantly downregulated by MC. One ETR2, an ethylene receptor, was significantly downregulated. In contrast, ten CONSTANS, positive regulators of photoperiodic flowering, and seven ARR (ARR2, ARR8, ARR9 and ARR14) genes were significantly upregulated. Moreover, 14 NAC TFs were upregulated in response to MC (Additional file 9: Table S7). The HB family TFs such as ATHB, KNAT6, and HAT were significantly downregulated, except for HAT22, which was upregulated. The majority of WRKY family TFs was upregulated, such as WRKY18, WRKY21, WRKY23, WRKY40, WRKY51, WRKY57, and WRKY70 (Additional file 9: Table S7). Nine bZIP members, including ABI5, bZIP34, bZIP61, Ocs element-binding factor 1(OCS1), and HY5, were significantly downregulated (Additional file 9: Table S7). The transcription level of all GRF family TFs decreased gradually after MC treatment. Remarkably, most of GRF genes showed more than 2-fold down-regulation 96 h after MC treatment compared with that in the control. Six TCP TFs were downregulated.
Validation of RNA-Seq data by using qRT-PCR
To validate the reliability of RNA-Seq data, we randomly selected 20 DEGs related to phytohormone biosynthesis and signal transduction pathways and cell cycle-related genes and TFs for qRT-PCR analysis (Fig. 9). The expression profiles of these genes from both qRT-PCR and RNA-Seq analysis were highly consistent, indicating the reliability of the RNA-Seq data.
Changes in endogenous hormone content in the second internode after MC treatment
Numerous DEGs associated with hormone biosynthesis and signal transduction pathway were enriched. To investigate whether MC affects endogenous hormone content, we quantified GA, IAA, BR, and CK (trans-zeatin) levels in the second internode of control and MC-treated plants. The levels of GA1, GA3, and GA4 were reduced by 78, 57, and 29 % in MC-treated plants 6 days after treatment, respectively (Fig. 10a). Similarly, endogenous IAA and BL, the most biologically active BRs, were reduced by 46 and 36 %, respectively (Fig. 10b, c). In contrast, endogenous CK level was increased by 95 % in MC-treated plants (Fig. 10d). These data indicate that the dwarfism caused by MC is closely related to the reduction of endogenous GA, IAA, and BR content.