Patient characteristics
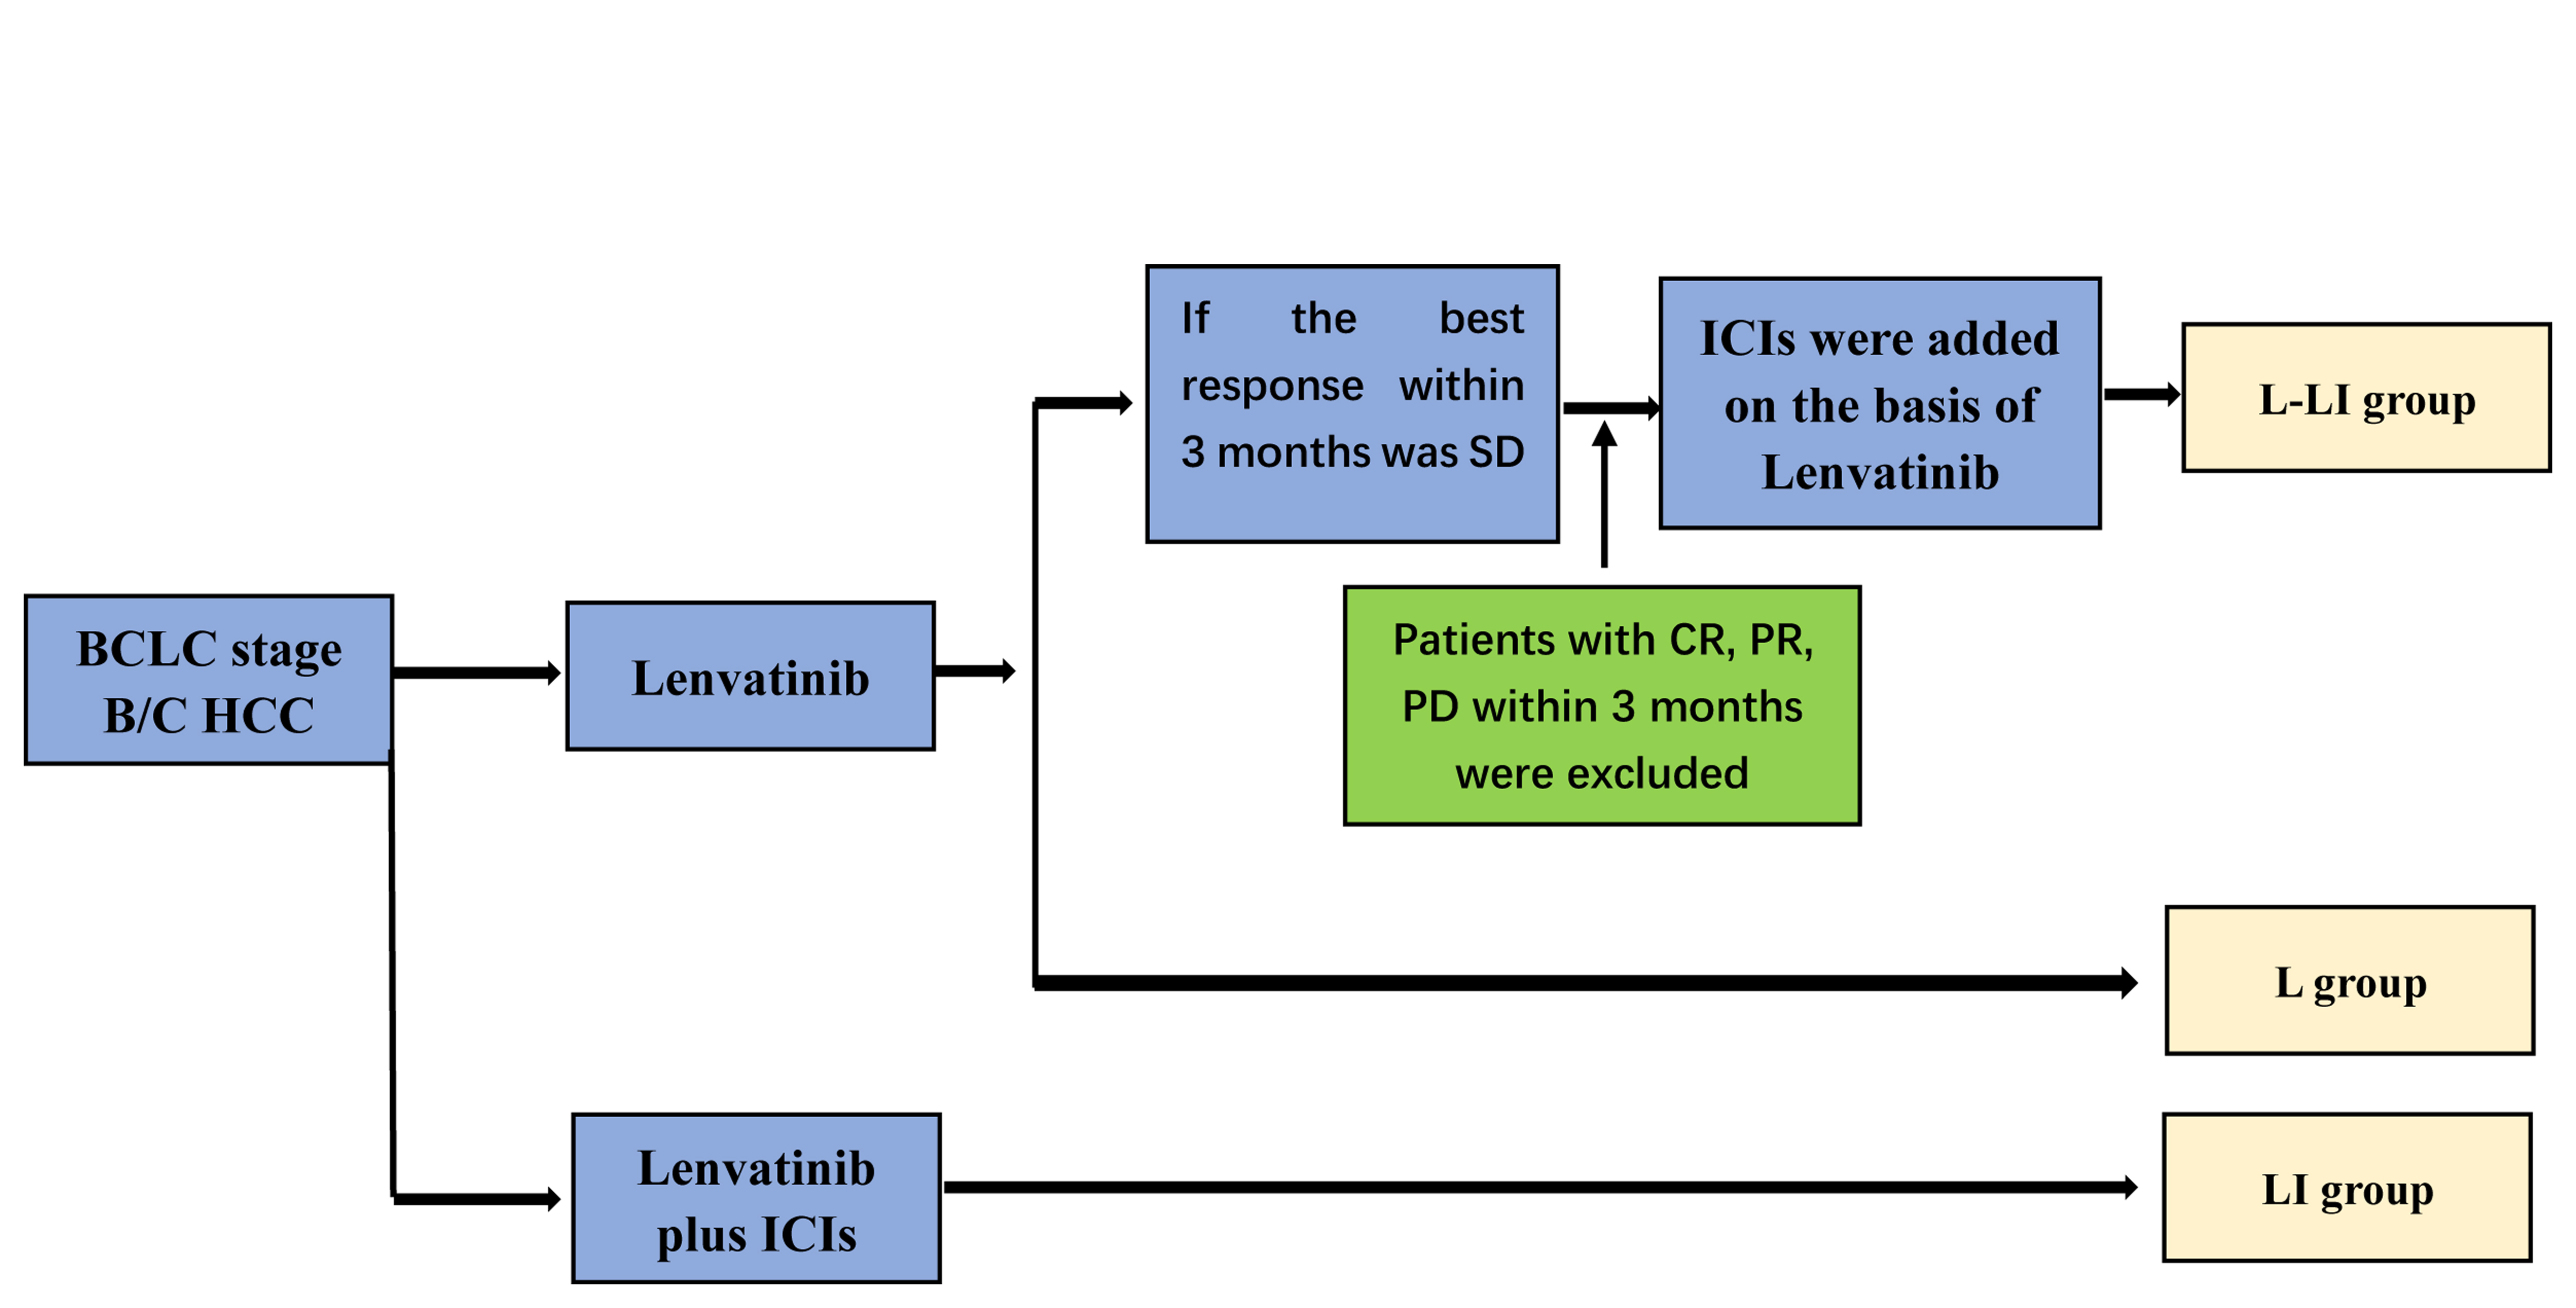
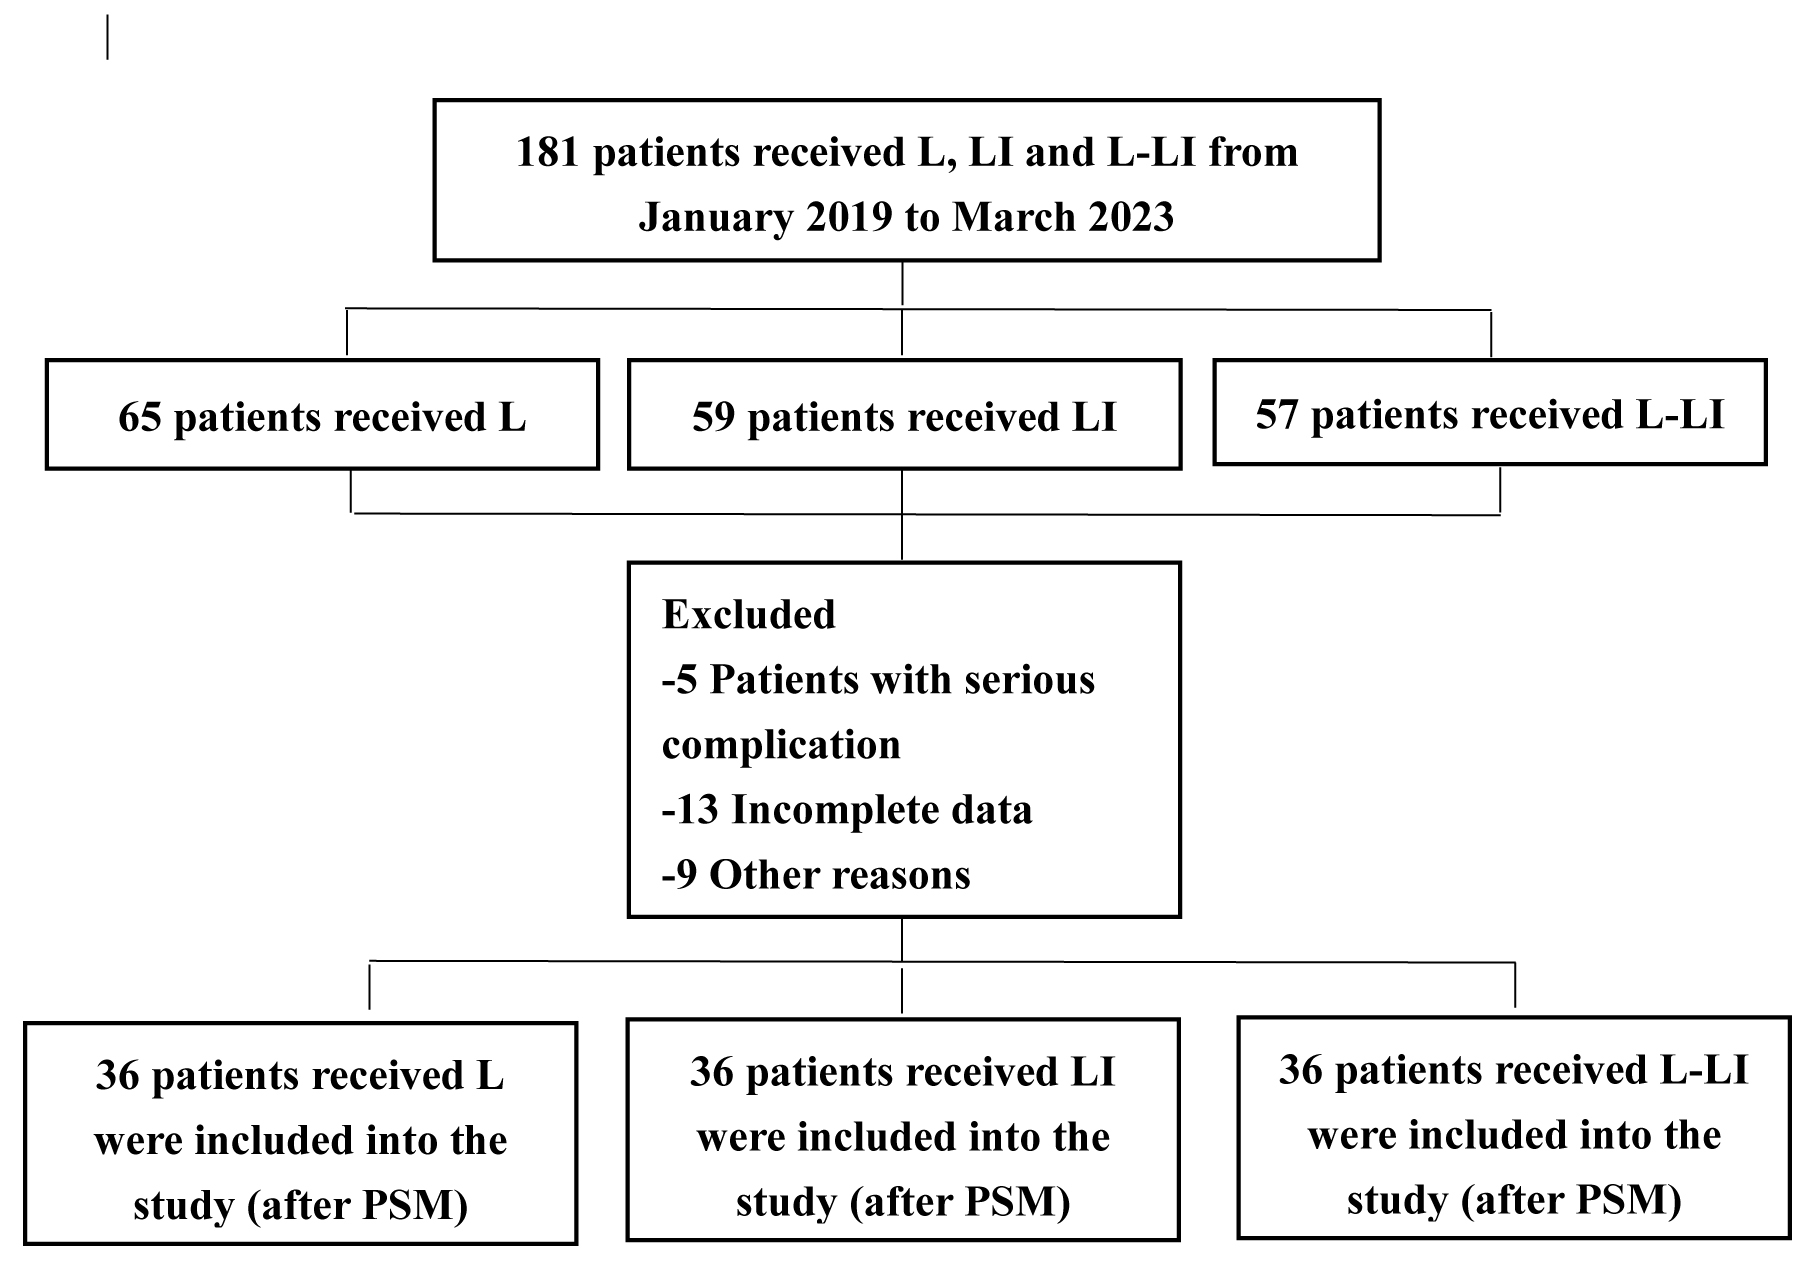
Between January 2019 and March 2023, 181 patients with unresectable HCC in our hospital were enrolled in the research, of which 65 received L therapy and 59 patients received LI, 57 patients received L-LI. However, 10, 8 and 9 patients in the L and LI, L-LI groups were excluded by the exclusion criteria, respectively. 36 patients, 24 patients without distant metastases, in each group were matched after PSM. 24 patients without distant metastases, 12 patients with distant metastases in each group were matched after PSM.
Baseline characteristics of matched patients were shown in Table 1 and Supplementary Table 1 and Supplementary Table 2. There was no significant difference in BCLC stage, gender, age, Child-Pugh Score, HBV, ECOG PS, Cirrhosis, Tumor thrombus, AFP among the three groups. The flowchart is shown in Supplementary Figure. 1 and Supplementary Figure. 2.
Table 1
Baseline characteristics and clinical features (n = 108)
| | L,n(%) N = 36 | LI,n(%) N = 36 | L-LI,n(%) N = 36 | P |
| BCLC stage | | | | 1.000 |
| B | 6(16.7%) | 6(16.7%) | 6(16.7%) | |
| C | 30(83.3%) | 30(83.3%) | 30(83.3%) | |
| Gender | | | | 0.617 |
| Male | 27(75.0%) | 30(83.3%) | 27(75.0%) | |
| Female | 9(25.0%) | 6(16.7%) | 9(25.0%) | |
| Age, years | | | | 0.065 |
| <60 | 14(38.9%) | 22(61.1%) | 13(36.1%) | |
| ≥ 60 | 22(61.1%) | 14(38.9%) | 23(63.9%) | |
| Child-Pugh Score | | | | 0.575 |
| 5 | 28(77.8%) | 26(72.2%) | 24(66.7%) | |
| >5 | 8(22.2%) | 10(27.8%) | 12(33.3%) | |
| HBV | | | | 0.750 |
| - | 11(30.6%) | 12(33.3%) | 14(33.3%) | |
| + | 25(69.4%) | 24(66.7%) | 22(66.7%) | |
| ECOG PS | | | | 0.617 |
| 0 | 27(75.0%) | 30(83.3%) | 27(75.0%) | |
| >0 | 9(25.0%) | 6(16.7%) | 9(25.0%) | |
| Cirrhosis | | | | 0.964 |
| NO | 18(50.0%) | 17(47.2%) | 17(47.2%) | |
| YES | 18(50.0%) | 19(52.8%) | 19(52.8%) | |
| Tumor thrombus | | | | 0.430 |
| Absent | 13(36.1%) | 8(22.2%) | 11(30.6%) | |
| Tumor thrombus | 23(63.9%) | 28(77.8%) | 25(69.4%) | |
| AFP | | | | 0.317 |
| < 400 ng/ml | 15(41.7%) | 21(58.3%) | 16(44.4%) | |
| ≥ 400 ng/ml | 21(58.3%) | 15(41.7%) | 20(55.6%) | |
| BCLC Barcelona Clinic Liver Cancer, HBV chronic hepatitis B virus, ECOG PS Eastern Cooperative Oncology performance status, AFP alpha-fetoprotein. |
Tumor response and survival in all patients
Table 2 summarizes the tumor responses of the three groups. There were 1, 7, 24, 4 patients had CR, PR, SD, PD in the L group, respectively. There were 1, 15, 18, 2 patients had CR, PR, SD, PD in the LI group, respectively. There were 0, 1, 35, 0 patients had CR, PR, SD, PD in the L-LI group, respectively. The patients in the LI group had a better ORR than the patients in the other two groups (44.44% vs. 22.22༅, 2.78༅, P < 0.01). There was no significant difference in DCR among the three groups (P = 0.120).
Table 2
Best anti-tumor response according to the mRECIST
| | L,n(%) N = 36 | LI,n(%) N = 36 | L-LI,n(%) N = 36 | P |
| CR | 1(2.78%) | 1(2.78%) | 0(0.00%) | 0.601 |
| PR | 7(19.44%) | 15(41.67%) | 1(2.78%) | 0.000 |
| SD | 24(66.67%) | 18(50.00%) | 35(97.22%) | 0.000 |
| PD | 4(11.11%) | 2(5.56%) | 0(0.00%) | 0.120 |
| ORR | 8(22.22%) | 16(44.44%) | 1(2.78%) | 0.000 |
| DCR | 32(88.89%) | 34(94.44%) | 36(100.00%) | 0.120 |
| Note: Responses were evaluated according to modified Response Evaluation Criteria in Solid Tumors version by investigators. |
The median OS of the LI and L-LI groups were significantly longer than that of the L group (18.8 months, 15.2 months vs. 12.0 months, P = 0.028, P = 0.021). There was no significant difference in median OS between the LI group and L-LI group (18.8 months vs. 15.2 months, P = 0.844). The LI and L-LI groups exhibited a significantly prolonged median PFS compared to the L group (11.4 months, 12.6months vs. 6.8 months, P = 0.047, P = 0.011), and the median PFS in the LI group and L-LI group demonstrated no significant difference (11.4 months vs. 12.6 months, P = 0.128) (Figure. 1).
Survival in subgroups of patients with or without distant metastases
In patients without distant metastases, it was shown that there was no significant difference in median OS (14.7 months vs. 18.8 months vs. 15.2 months, P > 0.05) was observed among the L, LI and L-LI groups. The LI and L-LI groups exhibited a significantly prolonged median PFS compared to the L group (11.1 months, 13.0months vs. 7.3 months, P = 0.006, P = 0.000), and the L-LI group showed a significantly prolonged median PFS compared to the LI group (13.0 months vs.11.1 months, P = 0.018) (Figure. 2). In patients with distant metastases, both the LI and L-LI groups had a significantly longer median OS than the L group (16.2months, 14.4 months vs. 10.4 months, P = 0.000, P = 0.028). There was no significant difference in median OS between the LI group and the L-LI group (16.2 months vs. 14.4 months, P = 0.104). The LI and L-LI group exhibited a significantly prolonged median PFS compared to the L group (12.2 months, 8.5months vs. 4.5 months, P = 0.000, P = 0.012), and the LI group showed a significantly prolonged median PFS compared to the L-LI group (12.2 months vs. 8.5 months, P = 0.039) (Figure. 3).
Prognostic Factors Associated with Good OS and PFS
Four prognostic factors that were significantly associated with prolonged OS, including BCLC stage of B (hazards ratio [HR]: 0.352; 95% confidence interval [CI]: 0.137–0.908; P = 0.031), ECOG PS of 0 (hazards ratio [HR]: 0.260; 95༅ confidence interval [CI]: 0.131–0.516; P < 0.01), Absent of tumor thrombus (hazards ratio [HR]: 0.384; 95༅ confidence interval [CI]: 0.182–0.808; P = 0.012), AFP< 400 ng/ml (hazards ratio [HR]: 0.471; 95༅ confidence interval [CI]: 0.252–0.879; P = 0.018) in the univariate analysis of all 108 patients. Two independent factors affecting OS were identified: AFP< 400 ng/ml(hazards ratio [HR]: 0.485; 95༅ confidence interval [CI]: 0.258–0.912; P = 0.025) and ECOG PS of 0 (hazards ratio [HR]: 0.300; 95༅ confidence interval [CI]: 0.148–0.610; P < 0.01) in the multivariate analysis (Table 3).
Table 3
Univariate and Multivariate Analyses of the prognostic factors for OS
| | Univariate analysis | Multivariate analysis |
| | HR (95%CI) | P value | HR (95%CI) | P value |
| BCLC | 0.352(0.137–0.908) | 0.031 | | |
| B | | | | |
| C | | | | |
| Gender | 0.975(0.490–1.941) | 0.943 | | |
| Male | | | | |
| Female | | | | |
| Age, years | 1.192(0.641–2.218) | 0.579 | | |
| <60 | | | | |
| ≥ 60 | | | | |
| Child-Pugh Score | 0.777(0.400–1.510) | 0.457 | | |
| 5 | | | | |
| >5 | | | | |
| HBV | 0.725(0.372–1.413) | 0.345 | | |
| - | | | | |
| + | | | | |
| ECOG PS | 0.260(0.131–0.516) | 0.000 | 0.300(0.148–0.610) | 0.001 |
| 0 | | | | |
| >0 | | | | |
| Cirrhosis | 0.876(0.480–1.599) | 0.666 | | |
| NO | | | | |
| YES | | | | |
| Tumor thrombus | 0.384(0.182–0.808) | 0.012 | | |
| Absent | | | | |
| Tumor thrombus | | | | |
| AFP | 0.471(0.252–0.879) | 0.018 | 0.485(0.258–0.912) | 0.025 |
| < 400 ng/ml | | | | |
| ≥ 400 ng/ml | | | | |
| * Bold values indicate: P < 0.05. |
| BCLC Barcelona Clinic Liver Cancer, HBV chronic hepatitis B virus, ECOG PS Eastern Cooperative Oncology performance status, AFP alpha-fetoprotein. |
Four prognostic factors that were significantly associated with prolonged PFS, including BCLC stage of B (hazards ratio [HR]: 0.381; 95% confidence interval [CI]: 0.192–0.756; P < 0.01), HBV negative (hazards ratio [HR]: 0.548; 95༅ confidence interval [CI]: 0.336–0.895; P = 0.016), ECOG PS of 0 (hazards ratio [HR]: 0.448; 95༅ confidence interval [CI]: 0.262–0.766; P < 0.01), Absent of tumor thrombus(hazards ratio [HR]: 0.496; 95༅ confidence interval [CI]: 0.294–0.835; P < 0.01) in the univariate analysis of all 108 patients. One independent factor affecting PFS was identified: ECOG PS of 0 (hazards ratio [HR]: 0.564; 95༅ confidence interval [CI]: 0.326–0.975; P = 0.040) in the multivariate analysis (Table 4).
Table 4
Univariate and Multivariate Analyses of the prognostic factors for PFS
| | Univariate analysis | Multivariate analysis |
| | HR (95%CI) | P value | HR (95%CI) | P value |
| BCLC | 0.381(0.192–0.756) | 0.006 | | |
| B | | | | |
| C | | | | |
| Gender | 1.173(0.705–1.949) | 0.539 | | |
| Male | | | | |
| Female | | | | |
| Age, years | 0.899(0.575–1.407) | 0.642 | | |
| <60 | | | | |
| ≥ 60 | | | | |
| Child-Pugh Score | 0.906(0.545–1.505) | 0.702 | | |
| 5 | | | | |
| >5 | | | | |
| HBV | 0.548(0.336–0.895) | 0.016 | | |
| - | | | | |
| + | | | | |
| ECOG PS | 0.448(0.262–0.766) | 0.003 | 0.564 (0.326–0.975) | 0.040 |
| 0 | | | | |
| >0 | | | | |
| Cirrhosis | 0.883 (0.567–1.374) | 0.580 | | |
| NO | | | | |
| YES | | | | |
| Tumor thrombus | 0.496(0.294–0.835) | 0.008 | | |
| Absent | | | | |
| Tumor thrombus | | | | |
| AFP | 0.887(0.569–1.382) | 0.596 | | |
| < 400 ng/ml | | | | |
| ≥ 400 ng/ml | | | | |
| * Bold values indicate: P < 0.05. |
| BCLC Barcelona Clinic Liver Cancer, HBV chronic hepatitis B virus, ECOG PS Eastern Cooperative Oncology performance status, AFP alpha-fetoprotein. |
Safety
Table 5 summarized the frequency of adverse events after treatment initiation for all 108 patients. The most common adverse events in the three groups were fatigue (n = 76), decreased appetite (n = 85). Overall, the frequency of grade ≥ 3 adverse events demonstrated no significant difference. However, one patient required discontinuation of Lenvatinib treatment on account of severe hypothyroidism and one patient required discontinuation of Lenvatinib plus ICIs treatment on account of severe gastrointestinal bleeding, two patients required discontinuation of Lenvatinib plus ICIs treatment on account of severe decreased platelet count. No treatment-associated death occurred in this study.
Table 5
Treatment-related adverse events
| Adverse events | L,n(%) N = 36 | LI,n(%) N = 36 | L-LI,n(%) N = 36 |
| | All Grade | Grade 3/4 | All Grade | Grade 3/4 | All Grade | Grade 3/4 |
| Hand foot skin rash | 4(11.1%) | 0(0.0%) | 5(13.9%) | 1(2.8%) | 5(13.9%) | 0(0.0%) |
| Hypertension | 12(33.3%) | 2(5.6%) | 15(41.7%) | 1(2.8%) | 13(36.1%) | 1(2.8%) |
| Proteinuria | 5(13.9%) | 0(0.0%) | 5(13.9%) | 0(0.0%) | 6(16.7%) | 0(0.0%) |
| Abdominal pain | 7(19.4%) | 1(2.8%) | 11(30.6%) | 2(5.6%) | 13(36.1%) | 0(0.0%) |
| Diarrhea | 6(16.7%) | 1(2.8%) | 4(11.1%) | 2(5.6%) | 7(19.4%) | 2(5.6%) |
| Nausea | 8(22.2%) | 1(2.8%) | 11(30.6%) | 0(0.0%) | 14(38.9%) | 0(0.0%) |
| Hypothyroidism | 9(25.0%) | 2(5.6%) | 13(36.1%) | 1(2.8%) | 11(30.6%) | 2(5.6%) |
| Gastrointestinal bleeding | 3(8.3%) | 0(0.0%) | 2(5.6%) | 0(0.0%) | 3(8.3%) | 1(2.8%) |
| Fatigue | 22(61.1%) | 1(2.8%) | 25(69.4%) | 0(0.0%) | 27(75.0%) | 1(2.8%) |
| Decreased appetite | 29(80.6%) | 1(2.8%) | 27(75.0%) | 1(2.8%) | 26(72.2%) | 1(2.8%) |
| Laboratory-related AEs, n (%) | | | | | | |
| Aspartate aminotransferase increased | 16(44.4%) | 2(5.6%) | 14(38.9%) | 2(5.6%) | 15(41.7%) | 1(2.8%) |
| Alanine aminotransferase increased | 14(38.9%) | 0(0.0%) | 12(33.3%) | 0(0.0%) | 14(38.9%) | 1(2.8%) |
| Decreased platelet count | 7(19.4%) | 1(2.8%) | 6(16.7%) | 2(5.6%) | 8(22.2%) | 2(5.6%) |
| Decreased white blood cell | 5(13.9%) | 0(0.0%) | 6(16.7%) | 0(0.0%) | 7(19.4%) | 0(0.0%) |
| Decreased red blood cell | 4(11.1%) | 0(0.0%) | 5(13.9%) | 1(2.8%) | 4(11.1%) | 0(0.0%) |
| Total bilirubin increased | 6(16.7%) | 1(2.8%) | 5(13.9%) | 2(5.6%) | 3(8.3%) | 2(5.6%) |
| Albumin decreased | 3(8.3%) | 0(0.0%) | 4(11.1%) | 0(0.0%) | 2(5.6%) | 1(2.8%) |
| AEs adverse events |