Whole seed transcriptome sequencing
To cover the entire J. curcas seed transcriptome, total RNA was extracted from six stages of seed maturation, and equal amounts of total RNA from each sample were pooled together. From this pool, mRNA was isolated and reverse transcribed into cDNA. Normalized cDNA libraries were generated and sequenced using the GS FLX Titanium. Sequencing of cDNA libraries yielded a total of 793,875 high quality (HQ) reads with an average read length of 358 nucleotides.
After trimming and cleaning, a total of 603,459 HQ reads were assembled into 19,841 contigs (unique transcripts) containing 13,171,840 bases using the cDNA assembly feature of Newbler software v.2.3. (Roche). Out of them, 48,978 reads were identified as singletons. The size of contigs ranged from 100 to 4,088 bases, with 1,035 bases as N50 contig size.
Functional annotation of whole transcript sequencing data
All 19,841 unique contigs were analyzed by Blast2GO [21] and aligned using BLASTX [36] search in the NCBI non-redundant nucleotide database using an E-value threshold of 1e-6. In total, 14,994 unique contigs were identified through BLAST search. The taxonomic distribution was examined, and over 8,000 transcripts had top hits to Ricinus communis (Figure S1), a species closely related to Jatropha. Based on text-annotation from the BLAST hits, approximately 3% (618 contigs) of the transcripts showed top BLAST hits with uncharacterized proteins, and 23% (4,847 contigs) had no significant similarity to any sequence in the public dataset. Generally, sequences without BLAST hits could not be annotated. Generally, sequences without BLAST hits could not be annotated. The average size of annotated and unannotated contigs was 800 and 400 bp, respectively.
Transcripts that show match with a BLAST were further classified into GO terms for biological process (BP), molecular function (MF), and cellular component (CC) (Figure 1). A total number of 13,705 Jatropha unique transcripts received at least one GO annotation (Table S1). Functional annotation of genes of the J. curcas library indicated that the highest percentage of GO terms was found in the category BP, containing 2,469 GO terms, followed by 1,891 in MF and 521 in CC (Table S1, Figure 1). The most abundance GO terms in the BP category were genes involved in oxidation-reduction processes (GO:0055114, 1,002 contigs, 5.1%), DNA-templated regulation of transcription (GO:0006355, 611 contigs, 3,1%) and response to cadmium (GO:0046686, 437 contigs, 2.2%). In CC, the most representative categories were nucleus (GO:0005634, 2,761 contigs, 13.9%), plasma membrane (GO:0005886, 1,796 contigs, 9.1%) and chloroplast (GO:0009507, 1,442 contigs, 7.3%). Within MF, the largest content of functionally assigned ESTs were related to ATP binding (GO:0005524, 1,285 contigs, 6.5%), zinc ion binding (GO:0008270, 975 contigs, 4.9%) and DNA binding (GO:0003677, 725 contigs, 3.7%).
InterProScan search was also used during the annotation process, using InterPro [22]. From the 19,841 contigs, 37.6% were also annotated based on homology to sequences in the InterPro database (Table S2). Out of the 13,705 sequences annotated with GO terms, 4,399 contigs were assigned with 5,703 EC numbers representing 1,040 unique enzymes, 799 of which are assigned to one or more KEGG pathways (Table S2). In addition, the data were compared with the Jatropha genomic sequences of Kazusa DNA Research Institute (JAT_r4.5, ftp://ftp.kazusa.or.jp/pub/Jatropha/)[37-38] and Chinese Academy of Sciences (JatCur_1.0, ftp://ftp.ncbi.nih.gov/ genomes/Jatropha_curcas/)[39-40] (Table S2). In total 73.7% (14,616 contigs), 1.3% (251 contigs), 13.4 % (2,671 contigs) showed sequence similarity to both, only to JAT_r4.5 or only to JatCur_1.0 databases, respectively. However, 11.61% (2,303 contigs) were found additionally in the transcript data set of the current study.
Additionally, 1001 different contigs were identified belonging to 20 transporter classes (Table S2). Out of them 233 and 246 contigs belong to the transporter classes 2A (porters) and 3A (p-p-bond-hydrolysis- driven transporters), respectively.
Protein domain characteristics for Resistance Gene Analogs (RGAs) have been identified in 85 contigs, with 70 carrying a kinase domain, 35 of which also harbored an additional serine/threonine (Ser-Thr) site. RGAs that contain Ser-Thr domain can phosphorylate serine and thereonine residues, which are involved in plant development, signaling and defense [41]. However, some RGAs like the Pto gene from tomato encode only Ser-Thr protein kinase. Four contigs with a nucleotide-binding site (NBS-ARC) domain and eight contigs with a leucine-rich repeat (LRR) domain were found. Both domains are abundantly present in plants and have an ATPase activity [42].
Moreover, 600 contigs from 52 different classes could be identified as TFs (Table S2). The most abundant TF families were MYB-related, MYB, bZIP, AP2, ERF and RAV, represented by 66, 54, 49, 49, 49 and 46 contigs, respectively.
Since a major goal of seed oil crop research is focused on oil quality and quantity, it is necessary to understand the processes involved in seed metabolism, especially in the accumulation of storage compounds like carbohydrates, triacylglycerols (TAGs) and proteins. To reconstruct the metabolic pathways active during J. curcas seed development, annotated sequences were mapped to KEGG pathways using the Blast2GO platform [25,28] in search of their biological function. As shown in Figure 2, in total, 2,660 contigs were located on 144 KEGG pathways (Table S3). Using the KEGG classifications allowed us to identify that the most highly represented pathways were purine metabolism (315 contigs), followed by starch and sucrose metabolism (226), pyrimidine metabolism (154) and phenylalanine metabolism (138). Further, glycolysis (129), pyruvate metabolism (111), flavonoid biosynthesis (111), glycerolipid metabolism (103) and phenylpropanoid biosynthesis (96) also were found in the top 20 highly represented pathways.
Array design and Microarray analyses
The examination of the changes in mRNA expression at selected points should allow the identification of genes associated with maturation and secondary metabolite biosynthesis.
An 8x60k oligonucleotide microarray containing 57,842 unique probes was produced from 19,841 transcriptome contigs (as described above). The probes were designed in sense and antisense direction with an average probe spacing of 250 bp (500bp sense + 500bp antisense) using the server based eArray platform from Agilent Technologies (https://earray.chem.agilent.com/earray/). In total 31,875 specific probes and 2,604 cross-hybridizing probes (Xhyb) in sense direction, as well as 21,680 specific probes and 1,683 Xhyb in antisense direction, were designed. The oligo microarrays were hybridized with probes of six stages of seeds maturation, each with three biological replicates.
Genome-wide variation in transcript expression during seed maturation
The microarray data were normalized and, differential expression patterns were identified using statistical analyses. Specific transcriptional profiles were established for each evaluated interaction. Further, genes exhibiting differential expression among seed maturation stages were submitted to in silico evaluations and were classified and categorized by their possible molecular function and involvement in metabolic pathways. Principle components analysis (PCA) on transcript expression (abundance) of 57,842 probes showed a clear separation of the six different stages related to seed maturation along the first principle component (PC1); which explained 53% of total variation, and was associated mostly with variation in transcript expression over the maturation stages, where expression from stage IV and V were closer to each other (Figure 3). Significant changes in transcript expression (abundance) were observed in the first and last stages, suggesting a higher physiological differentiation in these stages. Further, the values of probes on PC1 showed that probes with very low negative value were related to the early stage of seed maturation (I and II), while the probes with high positive value were in response to the later stage (IV-V) [43]. Furthermore, biological replicates of each stage clustered together, suggesting a minimal variation between replicates.
To identify changes in gene expression patterns during seed maturation, average log2 expression levels across all microarray data (greater than two-fold changes) with a cut-off of P-value < 1e-8 was performed (Table S4 and Figure S2). A total of 9,111 differentially expressed probes (16% of the total probes) from 7,299 contigs (38% of the total contigs) within the six stages of seed maturation were identified.
The co-expression patterns from the significant cut-off showed two intermodular hubs with around 40 edges and a broad range of nodes displaying between 15 and 10 edges (Figure 4A-B). The CB5-D hub with the highest number of edges belongs to a cytochrome B5 isoforms. HVA22J, an abscisic acid (ABA)- and a stress-inducible gene [44] from cluster 3 connected CB5-D from cluster 5 to aspartic proteinase (CDR1) from cluster 3, Dihydroflavonol reductase (DFR) from cluster 3 and Transparent Testa 8 (TT8) from cluster 6 (Figure 4A-B).
To focus on processes expected to be involved in seed storage and seed developments as well as hormone pathway, the GO terms from BP category were extracted. The co-expression results showed a high degree of connectivity between seed development and hormone pathways, while seed storage is less well connected to the other two pathways (Figure 4C).
Based on pairwise comparison between seed developmental, 135 and 231 contigs (300 and 144 probes) were up- and down-regulated between stage I and II, 426 and 535 contigs (479 and 659 probes) between stage II and III, 275 and 188 contigs (321 and 188 probes) between III and IV, 40 and 106 contigs (40 and 124 probes) between IV and V and finally the most contigs 889 and 272 (1,122 and 1,673 probes) were found between stages V and VI (Table S5). Data showed that most changes in transcript abundance occurred between last stages, suggesting that the timing of metabolic pathways during seed maturation in J. curcas is in late stages.
Cluster analysis of differentially expressed sequences (DESs)
To understand patterns of co-expression of the DESs during seed development, their expression profiles were clustered using hierarchical clustering analysis and visualized as a heatmap. The cluster analysis showed that different expression patterns could be classified into ten major clusters (1-10) (Figure 5-6). Up-regulated transcripts, whose expression was increased during seed maturation, were enriched in clusters 2, 4, 8, 9 and 10 (group A), while down-regulated transcripts were enriched in clusters 1, 3, 5, 6 and 7 (group B). The biological replicates of each stage clustered together, which underlines their high similarity. Further, each maturation stage of Jatropha seeds could be clearly separated from the others.
Cluster 1 (1,136 probes corresponding to 892 contigs) represented contigs with higher expression at earlier stages (green-half) which decreased over time. Cluster 2 (1,061 probes corresponding to 894 contigs) and 4 (1,069 probes corresponding to 882 contigs) showed slightly increased expression during maturation. Cluster 3 (409 probes corresponding to 336 contigs) and 5 (525 probes corresponding to 393 contigs) contained contigs with higher expression at earlier stages (I and II, in clusters 3 and 5, respectively), which decreased over time. Cluster 6 contained most probes (1,478 probes corresponding to 1,180 contigs) and revealed the highest expression in stage I, and decreased expression levels during maturation, while in cluster 7 (929 probes corresponding to 732 contigs) expression decreased from stage III (Figure 5). Both clusters showed a slightly higher expression in stage V. Cluster 8 (642 probes corresponding to 468 contigs) on the other hand, showed increased expression levels from early to later stages. Both cluster 9 (1,004 probes corresponding to 810 contigs) and 10 (858 probes corresponding to 712 contigs) showed increased expression from stage I to V and a decrease in stage VI (Table S4).
Based on the Transporter Classification Database, 431 transcripts (699 probes) were assigned to 94 transporter subfamilies, 15 subclasses and 7 classes. These transcripts are distributed among the 10 clusters, representing the intense activities during maturation process, which requires transport of metabolites within the cell and between different parts of the seed. The highest number (151) of transcripts related to transport activities were identified in class 3 (Primary active transporters), followed by class 2 (Electrochemical potential-driven transporters) with 151 transcripts. 13 transcripts were classified to be transporter subfamily 1.A.33, which is related to heat shock protein (Hsp) 70 (Table S4, Figure S2). Furthermore, different kinds of sugar transporters (2.A.1) and ATP/ADP transmembrane transport (2.A.29) represent the role of transporters to provide necessary energy metabolism during seed maturation. Among 24 transcripts that were classified as ABC transporters (3.A.1), subfamilies A, C, E, F, G and I were identified (Table S4).
In addition, 58 families of TFs showed differential expression between the six seed development stages, involving all expression pattern clusters (Table S4). The highest number of transcripts related to TFs were found in cluster 1 (54) flowed with cluster 6 (48), while the least number of TFs were found in cluster 3 (11). The most abundant TF families were identified as AP2/ERF-RAV (29).
GO enrichment analyses of DESs
To better understand the biological function of DESs during seed maturation, a GO set enrichment for each cluster was performed to identify the primary functional categories and pathways of these transcript clusters. GO enrichment analyses in BP categories for each cluster indicated that the most significantly over-represented DESs were found in cluster 6 containing 656 contigs with 314 GO terms, followed by cluster 4, with 509 contigs, while the most significantly under-represented DEs were also found in cluster 6, followed by cluster 2, with 570 contigs (detailed information and TOP 15 GO terms for each cluster are shown in Figure 7, S3, Table 1 and S6).
Visualization of enriched GO terms related to BP category for cluster group A, with higher DES expression level during late stage of seed maturation showed, that in cluster 8 GOs related to fatty acid metabolism (e.g. unsaturated fatty acid, linoleic acid), lipid storage, dormancy process, response to alcohol and UDP-glucose metabolism were significantly over-represented, while transports were under-represented. Further, GOs related to aromatic acid transports were over-represented in clusters 9 and 10, while GOs related to monoterpenoid metabolism were only enriched in cluster 10. Raffinose family oligossacharides (RFOs), which are associated with late maturation in Arabidopsis, Brasica napus and Medicago trunculata [45-47] were over represented in cluster 10. Transcripts related to biosynthesis of serine and glycine were over-represented in cluster 9. Embryo sac development, RNA modification and methylation were significantly over-represented in cluster 4, whereas, transcripts related to maintenance of seed dormancy, protein folding and RNA modification in cluster 2.
In contrast, GOs related to phenylpropanoid and flavonoid metabolism and biosynthesis, as well as cell wall modification and carbohydrate metabolism in clusters 3 and 5 (cluster group B) were significantly enriched with high expression levels during early stage of seed maturation (Figure S2). Transcripts involved in hormone transporters were significantly enriched in cluster 6, while sequences related to signaling were enriched in both clusters 6 and 7. Genes associated with ATP hydrolysis coupled protein transport and purine ribonuclease metabolism were enriched in cluster 7, however, RNA metabolic process, RNA processing, and cellular lipid metabolic processes were significantly under-represented in cluster 7.
Glucan and beta-glucan biosynthesis, which plays a key role in regulating seed coat-imposed dormancy [48] were over-represented in two clusters (3 and 8, respectively). GOs, involved in translation, RNA processing, and gene expression were under-represented in two different clusters (6 and 9), with different pattern of gene expression during maturation, indicating the involvement of two different groups of genes.
KEGG enrichment analysis of DESs
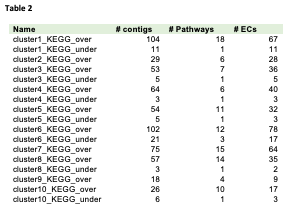
To further understand the biological function of DESs during seed development, enriched KEGG pathways in the set of DESs was assessed (Table 2 and S6, Figure S4). The KEGG pathways with P-value < 0.05 were considered as significantly enriched.
Pathway enrichment in DESs related to carbohydrate metabolism
Clusters from different stages of seeds share an enrichment of starch and sucrose metabolism. According to KEGG pathway analysis, starch and sucrose metabolisms contributed to clusters 5 with 14 enzymes.
Data revealed that carbohydrate metabolism was the most over-represented pathway in developing seeds of J. curcas, containing 90 enzymes involved in 11 pathways, belonging to cluster group B, which expression were decreased during maturation. The glycolysis/gluconeogenesis pathway was found to be significantly enriched in cluster 5 and 7. As shown in cluster 7 (Figure 5), over-represented contigs related to phosphoglucomutase (EC:5.4.2.2) catalyzing the reversible interconversion between glucose-6P and glucose-1P, the latter serving as a substrate for ADP-Glc pyrophosphorylase, the first deposited step in the starch biosynthesis pathway, indicate the reduction of starch biosynthesis during developmental stages [49-50]. The KEGG enrichment analysis of over-represented GO terms in the different clusters showed a reduced expression during seed maturation in 6 clusters with 158 contigs and 80 enzymes in 12 out of 15 pathways related to carbohydrate metabolism (ko00010, ko00020, ko00030, ko00040, ko00051, ko00053, ko00500, ko00520, ko00620, ko00630, ko00640, ko00660, Figure S5), mainly in clusters 3, 6 and 7. It is well known, that seed maturation is associated with a significant reduction of most sugars, organic acids, and amino acids, which relates to reserve accumulation and using the power of carbon compounds for the synthesis of fatty acids [51].
Pathway enrichment in DESs related to lipid metabolism
Pathways contributing to lipid biosynthesis can be divided into three steps and cell compartments: the first step of fatty acid biosynthesis occurs in the plastids, triacylglycerol (TAG) biosynthesis in the endoplasmic reticulum (ER) and oil body formation released into the cytoplasm.
From the first step, we could identify 3-oxoacyl-ACP reductase (KAR, EC:1.1.1.100, contig01408, contig07257, contig14836, in cluster 1 and contig02217, contig21412 in clusters 8). This enzyme produces beta-hydroxyacyl-AC, and following various reaction butyryl-ACP with four carbon is subsequently generated. Beta-ketoacyl-ACP synthase I is involved in the synthesis of palmitolyo-ACP with 16 carbon (KASI, EC:2.3.1.41, contig02910 in clusters 5 and contig01218 in cluster 8) which in the current study shows two different regulation patterns. The elongation from 16∶0-ACP or 18∶1-ACP [52] occurs in plastid by acyl-ACP desaturase (AAD, EC:1.14.19.2, contig03293, contig16368, contig18144 in cluster 5 and contig19191 in cluster 8). Oleoyl-ACP hydrolase (OAH, EC:3.1.2.14, contig04873 in cluster 1 and contig14233 in cluster 5) removes acyl group from ACP. Acyl-CoA synthetase (EC:6.2.1.3, contig05825, contig13897) enriched in cluster 8 is engaged in glycerophospholipid metabolism and fatty acid elongation.
Conversion of mono-unsaturated fatty acids to poly-unsaturated fatty acids by certain desaturases occur in the ER and are transferred to diacylglycerol (DAG) to produce triacylglycerol (TAG) by phospholipid: diacylglycerol acyltransferase (PDAT1, EC:2.3.1.158, contig02496, contig13416, in cluster 8). In the ER, glycerol kinase catalyzes glycerol to glycerol-3-phosphate (G3P), an initial substrate in the Kennedy pathway. Acylation of G3P, the first step of the Kennedy pathway, occurs by the G3P acyltransferase (GPAT) and lysophosphatidic acid (LPA) is formed, which is then converted to phosphatidic acid (PA) by LPA acyltransferase (LPAAT, EC:2.3.1.51, contig15092, contig19182 in cluster 2 and contig00099, contig02040, contig15096 in cluster 4). These products can be dephosphorylated by PA phosphatase (EC:3.1.3.4, contig03775 in cluster 2) to DAG, an essential intermediate in the biosynthesis of phosphatidylcholine (PC). Two contigs (contig04042, contig07701), belonging to cluster 10, encode diacylglycerol O-acyltransferase (DGAT, EC:2.3.1.20), contig02496 and contig13416 correspond to phospholipid diacylglycerol acyltransferase (PDAT, EC:2.3.1.158, in cluster 8), which are then acylating DAG to produce TAG. TAG is modified by triacylglycerol lipase (EC:3.1.1.3, contig02004, contig04368, contig12631, contig12633, contig13268 in cluster 4 and contig12671 in clusters 8) into fatty acids. Expression patterns of clusters 2, 4 and 8, showed an increase during the last stages of J. curcas seed development.
Contigs encoding enzymes like diacylglycerol kinase (ATP, EC:2.7.1.107, contig12203, contig16160 in cluster 4), aldehyde dehydrogenase (NAD+, EC:1.2.1.3, contig03833 in cluster 2, contig12312 in cluster 4 and contig03833 in cluster 8) and glycerate 3-kinase (EC:2.7.1.31, contig06990, contig 19842 in cluster 2), were found in cluster 2, 4 and 8. As expected, the synthesis of fatty acids requires a high amount of energy during seed maturation, which results in increased expression of enzymes related to photosynthesis as an energy supply [53].
Further, two important enzymes involved in alpha-linolenic acid metabolism and biosynthesis of unsaturated fatty acids were identified in cluster 1: acyl-CoA oxidase (EC:1.3.3.6, contig08139) and enoyl-CoA hydratase/3-hydroxyacyl-CoA dehydrogenase (EC:4.2.1.17, contig05058, contig09979).
Most of the enzymes involved in lipid biosynthesis in J. curcas were identified in the current study based on the annotation of the seed transcripts. Altogether, 97 contigs and 55 enzymes were annotated as being involved in lipid metabolism (Figure S6).
Pathway enrichment in DESs related to phenylpropanoid biosynthesis or monolignol biosynthesis
Among the significantly enriched pathways, the phenylpropanoid biosynthesis pathway contains 30 over-represented contigs and 11 enzymes located in clusters 3, 5 and 8 (Figure S7). Lignin, a complex of phenylpropanoid polymers, is the second most abundant polymer after cellulose, mainly located in the cell wall supporting the plant with structural stability [54]. The lignin deposition and lignification happen in seed coat cells, siliques cells, tracheary elements, sclerenchyma cells and endodermal cells [55]. The first step begins with the deamination of phenylalanine to cinnamic acid by phenylalanine ammonia-lyase (PAL, EC:4.3.1.24) [56] and phenylalanine/tyrosine ammonia-lyase (EC:4.3.1.25, contig05064, contig05269 in cluster 3 and contig05269 in cluster 5) in the phenylalanine, tyrosine, and tryptophan biosynthesis pathways. Next, one contig corresponding to trans-cinnamate 4-monooxygenase (EC:1.14.13.11, contig00044 in cluster 5) converts cinnamic acid to P-coumaric acid. P-coumaric acid can be conjugated by 4-coumarate: CoA ligase (4CL, EC 6.2.1.12, contig07594, contig07611, contig08856 in cluster 3 and contig07611, contig09522 in cluster 5), and enriched to coenzyme A to form p-coumaroyl-CoA, which is the precursor for the synthesis of flavonoids, stilbenes, and other phenylpropanoids [57].
Alternatively, P-coumaric acid and p-coumaroyl-CoA can be hydroxylated by p-coumarate 3-hydroxylase (EC:1.14.13.-) to produce caffeic acid and Cafeoyl-CoA. The newly added hydroxyl group can be methylated by caffeic acid 3-O-methyltransferase (COMT, EC:2.1.1.68) and caffeoyl-CoA O-methyltransferase (CCoA-OMT; EC:2.1.1.104, contig12200 in clusters 3 and 5, and contig11569, contig12199, contig21555 in cluster 8), ferulic acid and feruloyl-CoA. Ferulic acid is hydroxylated by ferulate-5-hydroxylase (EC:1.14.-.-) to form 5-hydroxyferulic acid; however, so far the enzyme responsible for hydroxylation of feruloyl-COA to 5-hydroxyferuloyl-COA is unknown.
Cinnamoyl-CoA reductase (CCR, EC:1.2.1.44) can catalyze the CoA thioesters to the corresponding aldehydes, which are reduced to monolignols by cinnamyl alcohol dehydrogenase (EC:1.1.1.195) and peroxidase (EC:1.11.1.7, contig02903, contig08820, contig14072, contig14904, in cluster 3 and contig00763, contig02903, contig09344, contig11593, contig1160, contig14503, contig21004 in cluster 5). Eleven contigs for peroxidase were significantly enriched and over-represented. The presence of different patterns of gene expression for an enzyme, e.g. peroxidase, may indicate the presence of different isoenzymes. Interestingly, the expression of peroxidase was twice as high in the last stage compared to the first stage of seed development (Figure 5). A previous study by Gijzen et al. [58] suggested that the highly expressed soybean peroxidase (Prx2) in the seed coat may be subjected to degradation during seed maturation.
Pathway enrichment in DESs of flavonoid biosynthesis-related pathways
p-Coumaroyl-CoA, which is synthesized in the monolignol biosynthetic pathway, can also lead to flavonoid biosynthesis. The decrease of carbon flow results in a limitation for the flavonoid pathway, leading to an increase of monolignols by p-coumaroyl-CoA [59]. However, flavonoid biosynthesis pathway is well conserved among plants [60].
After oil extraction, the Jatropha seed cake contains high amounts of polyphenols and pigments that result from flavonoid biosynthesis. In the current study were annotated and enriched in clusters 1, 3 and five as encoding 16 enzymes involved in flavonoid, flavone and flavonol biosynthesis and isoflavonoid biosynthesis based on KEGG pathways (Figure S8). Two contigs (contig11261, contig19461, cluster 1) were identified as 6'-deoxychalcone synthase (EC:2.3.1.170) and three contigs (contig16238, contig17619, contig19806 in clusters 3 and 5) as naringenin-chalcone synthase (EC:2.3.1.74), an important enzyme catalyzing the conversion of cinnamoyl-CoA to pinocembrin chalcone. Chalcone synthase is the first committed enzyme in this pathway and is a major regulator of flavonol biosynthesis, also playing an important role in flower development [61]. One contig was annotated for chalcone isomers (EC:5.5.1.6, contig04004, cluster 3) that catalyzes the conversion of pinocembrin chalcone to pinocembrin, a substrate for galangin synthesis [61]. Furthermore, it catalyzes 4,2´,4´,6´-tetrahydroxychalchone into naringenin. Four contigs (contig00198, contig01835, contig10674, contig14763) were identified as flavanone 3-dioxygenase or naringenin 3-dioxygenase (EC:1.14.11.9, contig00198, contig01835, contig14763 in cluster 5), which are involved in highly conserved pathways in plants to catalyze naringenin into dihydrokaempferol, an important intermediate product, that can be converted to kaempferol by flavonol synthase (EC:1.14.11.23, contig00445, contig00715, contig14188, contig19609, contig19806 in cluster 1, contig08632, contig12686 in cluster 3 and contig12095, contig12100, contig12686 in cluster 5). Thirty-seven contigs of flavonoid biosynthesis pathway were significantly enriched in J. curcas seeds. The presence of different expression patterns (from different clusters) of one enzyme could be explained by the existence of different isoenzymes and possibly by the interaction with other genes involved in flavonoid biosynthesis at multiple loci [62].
Kaempferol can be hydroxylated and glycosylated at its position six by flavonol 3-O-glucosyltransferase (EC:2.4.1.91, contig16343, contig21456 in cluster 1) to 6-hydroxykaempferol-3-O- β-D-glucoside or 6-hydroxykaempferol-3,6-di-O-β-D-glucoside. However, kaempferol can also be hydroxylated by flavonoid 3′-monooxygenase (EC:1.14.13.21, contig06562 in cluster 1 and contig05713, contig06160 in cluster 3) or flavonoid 3′, 5′-hydroxylase (EC: 1.14.13.88) to quercetin in J. curcas. Both enzymes can also convert dihydrokaempferol to dihydrocyanidin, which can be deoxidized by dihydroflavonol-4-reductase to leucoanthocyanidin, and further by leucoanthocyanidin reductase to catechin.
DESs related to hormone pathways and seed development
Several transcripts related to plant hormones like brassinosteroids (BR), abscisic acid (ABA), ethylene, and jasmonic acid (JA) were identified in different clusters. Cytochrome P450 family 1 subfamily A polypeptide 1 (EC:1.14.14.1, contig04060, contig16501 in cluster 8 and contig01390, contig04280, contig05390, contig16501 in cluster 10), corticosteroid 11-beta-dehydrogenase isozyme 1 (EC:1.1.1.146, contig02785, contig06502, contig16374 in cluster 8 and contig11252 in cluster 10), 17beta-estradiol 17-dehydrogenase (EC:1.1.1.62, contig11561) and 3beta-hydroxy-Delta5-steroid dehydrogenase / steroid Delta-isomerase (EC:1.1.1.145, contig00630, contig00631) are all involved in brassinosteroid (BR) biosynthesis via mevalonic acid (MVA) and steroid biosynthesis pathways. Interestingly, most enzymes were found only in cluster 10. The enzymes involved in this pathway were slightly up-regulated during seed maturation and showed a higher expression level in the last stages compared to early stages (Figure 5). BR is a steroid hormone, which acts throughout the plant growth, early fruit development, and regulates seed size and seed number [63]. The functions of BR in seed development were demonstrated using insensitive mutants of Arabidopsis, Oryza sativa, Pisum sativum, and Vicia faba [64]. Over-expression of a P450 monooxygenase family gene CYP72C1 in Arabidopsis dwarf mutant shk1-D produced a lower endogenous BR level and limited growth and smaller seeds [65]. Also, the characterization of a cytochrome P450 gene in a dwarf rice mutant implicated in BR biosynthesis led to a reduction of seed length [66]. Further, the effect of cytochrome P450 of J. curcas on seed size were examined in transgenic tobacco [67]. Over-expression of a BR-biosynthetic gene in rice could increase seed filling and yield. A BR-deficient mutant of Vicia faba and pea resulted in smaller seeds [68-69]. Although molecular mechanisms of BR involved in seed development are unclear, these facts show that BR is required for normal seed development and determines seed size [64].
Abscisic acid (ABA), on the other hand, is known to influence seed development, plant growth and dormancy, it regulates the synthesis of seed storage proteins, starch, and lipids as well as the withstanding of environmental stresses. Carotenoid biosynthesis pathway drives ABA synthesis from C40 epoxycarotenoid precursors in plastids. From the carotenoid biosynthesis pathway, four enzymes with four contigs were over-represented in clusters 8 and 10, and their expression increased during seed maturation. Among them, 9-cis-epoxycarotenoid dioxygenase (NECD, EC:1.13.11.51; contig02415) and (+)-abscisic acid 8'-hydroxylase (EC:1.14.13.93; contig17785) involved in ABA synthesis were identified to be differentially expressed in our dataset. Over two-fold up-regulation of these enzymes in stage IV may indicate the significant increase in ABA biosynthesis. Basnet et al. [43] also showed that ethylene and ABA from hormonal metabolism were over-represented during seed development in different Brassica rapa accessions, which suggests that their abundance increased during seed development. These data are in agreement with other studies [43,70-73], where ABA and ethylene were up-regulated during late stages of seed development, underpinning the role of both hormones in growth and development of seed, accumulation of seed reserves and their beneficial impact on germination, maturation, desiccation tolerance and induction of seed dormancy.
The biosynthesis of ethylene, known to be generally involved in plant development, fruit maturation and senescence, occurs through two amino acid pathways: alanine, aspartate and glutamate metabolism and cysteine and methionine metabolism. Both pathways produce l-aspartate, which is the substrate for the formation of aminocyclopropanecarboxylate (ACC) an immediate precursor for ethylene using methionine adenosyltransferase (SAM-synthase, EC:2.5.1.6, contig00728, contig03867, contig07733, contig15674 in cluster 6 and contig07733 in cluster 7), and for the last step aminocyclopropanecarboxylate oxidase (EC:1.14.17.4, contig07599 in cluster 6, contig02109 in cluster 7) which form ethylene. Both enzymes were found in clusters 6 and 7, which also contained 15 enzymes corresponding to 24 contigs in the cysteine and methionine metabolism pathway. Among them, three enzymes involved in ethylene biosynthesis were found, i.e., methionine synthase (EC:2.1.1.13, contig03731) in cluster 7, aspartate kinase (EC:2.7.2.4, contig03307, contig13782) and homocysteine S-methyltransferase (EC:2.1.1.10, contig04946) both in cluster 6. Finally, in stage VI, the enzymes were down-regulated compared to stage I (Figure 5). Ketring and Morgan [74] found that low levels of ethylene are produced by dormant peanut seeds.
Jasmonic acid (JA) acts in fruit ripening, seed germination, protein storage and resistance or response to biotic and abiotic stresses as well as plant development, and is synthesized from the alpha-linolenic acid pathway. It is the only hormone that is biosynthesized from the fatty acid or alpha-linolenic acid metabolism pathway, which was found to be significantly enriched with five enzymes and nine contigs in cluster 1. It is well known that JA biosynthesis requires the action of acyl-CoA oxidase (EC:1.3.3.6, contig08139), which was found in cluster 1. However, the expression of this enzyme is reduced during seed maturation. Soybean lines with the acyl-CoA oxidase antisense construct were used to reduce the level of acyl-CoA oxidase, which increased germination [75]. Treatment of acx1/5 JA deficient plants with JA restored normal seed set [76].
Validation of microarray data using qRT-PCR
A total of 70 contigs from the DESs represented transcripts in seeds, and three housekeeping genes were selected (Table S7) and used for independent validation using a 48.48 chip (Fluidigm) to confirm that the changes in expressions as indicated by microarray data were authentic and reliable. Candidates for qPCR were chosen based on expression levels, known function, clusters and length of contigs. Additionally, some contigs of unknown function were selected. The corresponding primers are listed in Table S7.
The expression patterns obtained by qRT-PCR correlate strongly to moderately with data from the microarray analyses (about half of the contigs correlate with the microarray data at a Pearson correlation < -0.8), thus confirming the reliability of the chosen approach (Figure S9).