Materials
Chemicals and Reagents
All reagents and chemicals including Trolox [(±)-6-hydroxy-2,5,7,8-tetramethylchroman-2-carboxylic acid], methanol and ethanol were purchased from Sigma-Aldrich (Steinheim, Germany). The standards were purchased from Chroma Dex (California, USA). The analytical-grade acetone, dimethyl sulfoxide (DMSO), tetrahydrofuran and orthophosphoric acid (89%) were purchased from Merck (Merck, Darmstadt, Germany).
Collection of medical plants and experimental site
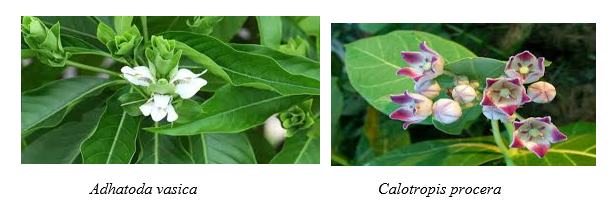
The mature leaves of Adhatoda vasica and Calotropis procera were freshly plucked from Kanpur valley, Haripur Pakistan. These species were shifted into Horticulture laboratory, The University of Haripur, Pakistan for biochemical analysis. The biochemical studied conducted through HPLC and X Bridge C18 detector. The repository codes of plants were 47070771 in Adhatoda vasica 1811 in Calotropis procera.
Extracts preparations process in Medical plants
The plant extract was prepared by taking 1 g of powdered dry sample of leaves with added of 10 ml of distilled water in these powdered. The sample was then mixed with the help of mechanical shaker and filtered through filter paper. The plant sample was then transferred into the separate bottle and the pure solution was kept in the refrigerator[26].
Solvents based efficacy of Extracts preparations in Medical plants
The powdered (250 g) of each plant was extracted with Methanol, Ethyl acetate, Chloroform Hexane Aqueous and Ascorbic acid (500 ml) separately for 48 hrs at room temperature. The mixture was then filtered through Whatman’s filter paper No 1. After filtration, the extracts were evaporated and concentrated at the temperature of 40°C by using rotary evaporator (BuchiRotavapor R-200). The concentrated solution was evaporated to dryness by hot air oven at 40°C for 1 hr. The dried residue was preserved in caped glass bottles at 4°C for future use.
Optimization of extraction processes on the base of solvents exaction process
The extraction processes were optimized through the potential solvents with their mode of accuracy and efficiency. The various solvent such as (Methanol, Ethyl acetate, Chloroform, Hexane, Aqueous, and Ascorbic acid) were used in this study with the concentrations of (20, 60, 70 and 100). The suitable solvents for all four bioactive compounds were measured in methanol with concentration of 70 %. The running time of samples in HPL- DAD/MS/MS for collections of all four compounds were determined [27].
Various methods of extractions for new compounds
The isolation of bioactive compounds were checked by using five different methods of extraction, these methods includes Cold extraction (CE), Super critical fluid extraction (SCFE) microwave assisted extraction (MAE), Liquid-liquid micro-extraction (LLME), Serial Exhaustive extraction (SEE). The SCFE was performed in 15 ml volume vessel by using the sample of 2.5 g of both herbal plants. The temperature range was 45 ◦C in static, flow of time 25 min followed by methylation process. The second extraction method was micro waves extraction, the weight of both herbal samples were crushed using a motor pistol after crushing it, the sample was placed into petri plate then complete heating was conducted into oven. After complete heating the samples were placed into ice water to reduce the heat. The serial exhaustive extraction method was improve the polarity range of solvent to insure range of bioactive compounds in proper quantity. The popular method of extraction; liquid-liquid micro extraction process adopted, the liquid extract of both herbal plants of (12-100 µl) was added into a stirring vortex with interface between the solvent and water and equal amount of both solvents were added into a capillary tube or springe tune, directly attached to HPLC-DAD with tandem mass spectrometer (MS/MS) detectors [1]
HPLC for column specification X Bridge C18 and Phase composition methods for active compounds
The HPLC machine linked with detector such as a (DAD) frequently used in MS/MS at wave length of 190-800 nm. The HPLC system attached with photodiode array detector and binary pump used (MA, Milford, USA). The system attached to an auto injector with water phase analytical column .The prepared samples (5 ml) of extracts were evaporated till complete dryness of samples then residues were dissolved in 2 ml of DMSO solution. The chromatographic separations were carried out using an X Bridge C18 (3.5 μm, 4.6 x 250 mm) column from waters company. The mobile phase consisted of 0.25 % orthophosphoric acid and 1.50 % tetrahydrofuran in water (solvent A) and methanol (solvent B) were used. The gradient conditions were as follows; 0-15 min 30-70 % A, 15-30 min 70-100 % A, 30-35 min 100 % A, 35-36 min 100-30 % A, and 36-50 min 30 %. The column was equilibrated for 10 min prior to each analysis. The mobile phase was checked through ultrasonic waves before operation of samples. The ultrasonic machine attached with digital timer and temperature controlled with range of power (400-900 W) and frequency for 45 Khz. The spectral measurement of bioactive compounds conducted at 190-800 nm using the detectors (DAD-MS/MS) and tandem mass spectrometer (MS/MS). The both detectors collected the spectral level while their peak were noted in inflection of each point during the running of samples in HPLC-DAD/MS/MS. The samples and standards were measured from the stored library of spectral order. The time is a crucial factor for proper analysis of bioactive compounds during HPLC analysis. The optimization of isolation for bioactive compounds with best regulation time was obtained using diverse mobile phase like (Methanol, 0.1 % aqueous ethylic acid v/v, acetonitrile and aqueous 0.1 % v/v 0.1% formic acid and methanol). It was observed that Formic acid and methonal 0.1 % was the best mobile phase for isolation and collection of four components under applied isocratic mode. The elution mode was followed by A) formic acid 0.1v/v and B) methanol with separation, a liner program was followed, 10-65% B 0-85 min, and standard mixture compounds were used as baseline of chosen markers [27].
Method of validation, accuracy, calibration new bioactive compounds in herbal plants
Subsequently, establishing optimal conditions of HPLC analysis, it was validated to ensure the applied developed method evaluated effectively. Calibration and linearity curves were created by plotting the peak area and the concentration of the corresponding working standard solution. Furthermore; the applied analytical method was validated with respect to the limit of detection (LOD) and limit of detection quantification (LOQ), precision, repeatability, stability and recovery, respectively. The standards compounds were compare with running of original samples of both herbal plants, the curves calibration were measured in each peak areas of four active compounds. The linear regression was apply in the equation y = ax ±b the variables, followed as the x was contractions and Y was the peak area. The linearity was confirmed through (R2) values. The precision was checked at three concentrations in curve calibrations. The intra and inter days were also calculated at 5 days of each replicates of samples were running in HPLC-DAD/MS/MS then the precision of methods and RSD were calculated [1,2].
Drugs activity and Biological Performance of new compounds
Positive and Negative bacterial strains used in this study
The two gram positive bacterial strains (Staphylococcus aureus and Bacillus cereus) and two negative bacterial strains (Escherichia coli and Klebsiella pneumoniae) were used in this study to check the potential antibacterial activity of new bioactive compounds for controlling these infectious the bacterial strains and their codes for identification were Staphylococcus aureus B.965, Escherichia coli O157, Bacillus cereus KA 80800 Klebsiella numoneae B.96.1
Minimum inhibitory concentration (MIC) against bacterial strains
The minimum bactericidal concentrations were test and applied on these new compounds of both plants. It was the possible lower most concentration at which an antimicrobial or antibacterial agent eradicate a specific microorganism. The MBC determined through agar test method by putting the sample and microbe on agar plate. The 5 μl of aliquots were transferred into TSA plates and incubated for period of 24 h, while the controls test was set with DMSO solution with amounts corresponding to the highest quantity present in the test solution where the appropriate reading was obtained in running of three replicates according to reported method of [28, 29, 30].
Ferric ion reducing antioxidant potential (FRAP) assay
The ferric ion reducing antioxidant potential (FRAP) assay of both plants were determined by modified method of Ahmed et al. 2019. The stock solutions were prepared with 300 mM acetate buffer (3.1 CH3COONa and 16 ml CH3COOH), pH 3.6, 10 mM TPTZ (2, 4, 6-tripyridyl-s-triazine) solution in 40 mM HCl, and 20 mM FeCl3 solution were used. The fresh working solution was prepared by mixing of 25 mL acetate buffer, 2.5 ml TPTZ and 2.5 ml FeCl3 solution was added in solution followed by recording the average activity of samples
Combined fractional inhibitory concentration index (CFICI index)
The combined fractional inhibitory concentration index test was apply on these herbal extracts of both plants were calculated under the formula of FIC index = FICA + FICB, where FICA = (MICA in combination/MICA alone) and FICB = (MICB in combination/MICB alone) by method [31]. The trails were replicated at least twice with duplicate for running of samples to analyze at per replicate of each samples.
Cytotoxicity test and potential activity
The cytotoxicity of both herbals plants samples were examined using a Kit of LDH was used. The extract of (2 ml) both herbal plants samples were taken where the release of lactate dehydrogenase (LDH, cytoplasmic enzyme) was treated with the cells were determined according to calorimetrically method as reported by [32]. The diverse concentrations were used (1, 0.4 and 8 g/ml) and setting the sample for 24 h. The lysates was obtained by application of 1 % X-100 Trition solution with similar ratio of DMSO solution. The process was further diffused and compared with control samples.
In vitro activity of lactate dehydrogenase (LD) assay of new bioactive compounds for antibacterial drugs
The membrane integrity was assessed by estimating the amount of LDH present in the culture media, the cytosolic enzyme LDH was released due to membrane damage was noted. The CytoTox 96 X assay (Anatech, Promega G 400) was used to measure the release of LDH in respected cells Fifty microliters of reconstituted reagent was added to an equal volume of cell culture medium and incubated in the dark at room temperature for 30 min. The colorimetric compound was measured through spectrophotometric at 490 nm (Perkin-Elmer, VICTOR3).
Drugs design on compartment and non-compartment modeling of pharmacokinetics study of bioactive compounds for future drug preparation and developments process
The compartment modeling of pharmacokinetics were applied for the first time on these new compounds, were obtained from herbal plants of Adhatoda vasica and Calotropis procera. The areas under plasma concentration, established half- life, while the maximal plasma concentration (C-max) and their time of occurrence (T-max) were obtained directly from the data achieved in this study. The modification of compartment model was adopted in herbal plants extracts, with auto calculation of software was attached with win-Nonlin ® Software (V-6.1, Pharsight) was applied on these bioactive compounds. The proposed model of compartment with small equation was given below where the area under plasma concentrations were measured AU Clast-∞ = Clast/Kel for new drug capacity and ranges of these compounds were measured as reported method of Ahmed et al. 2019.
Statistical Analysis
The obtained data were subjected to statistical studies using the software of chrom gate v 3.31 knauer. While the minimum bactericidal concentration (MBC) was calculated by non-linear regression based against the concentration response curve of each sample by graph pad prism 5. The compounds were further verified by the standards digital library. Furthermore; the fingerprinting of new compounds were evaluated by the software (Sciex City Foster USA). The data was evaluated for control, data acquisition, the peaks of samples were additionally measured and verified by the advance software of Multi-Quant 2.1, Foster CA USA, peak areas, standards curves, descriptive statistics were calculated and using software of Win Non Lin® version 6.