2.1. Experimental Animals
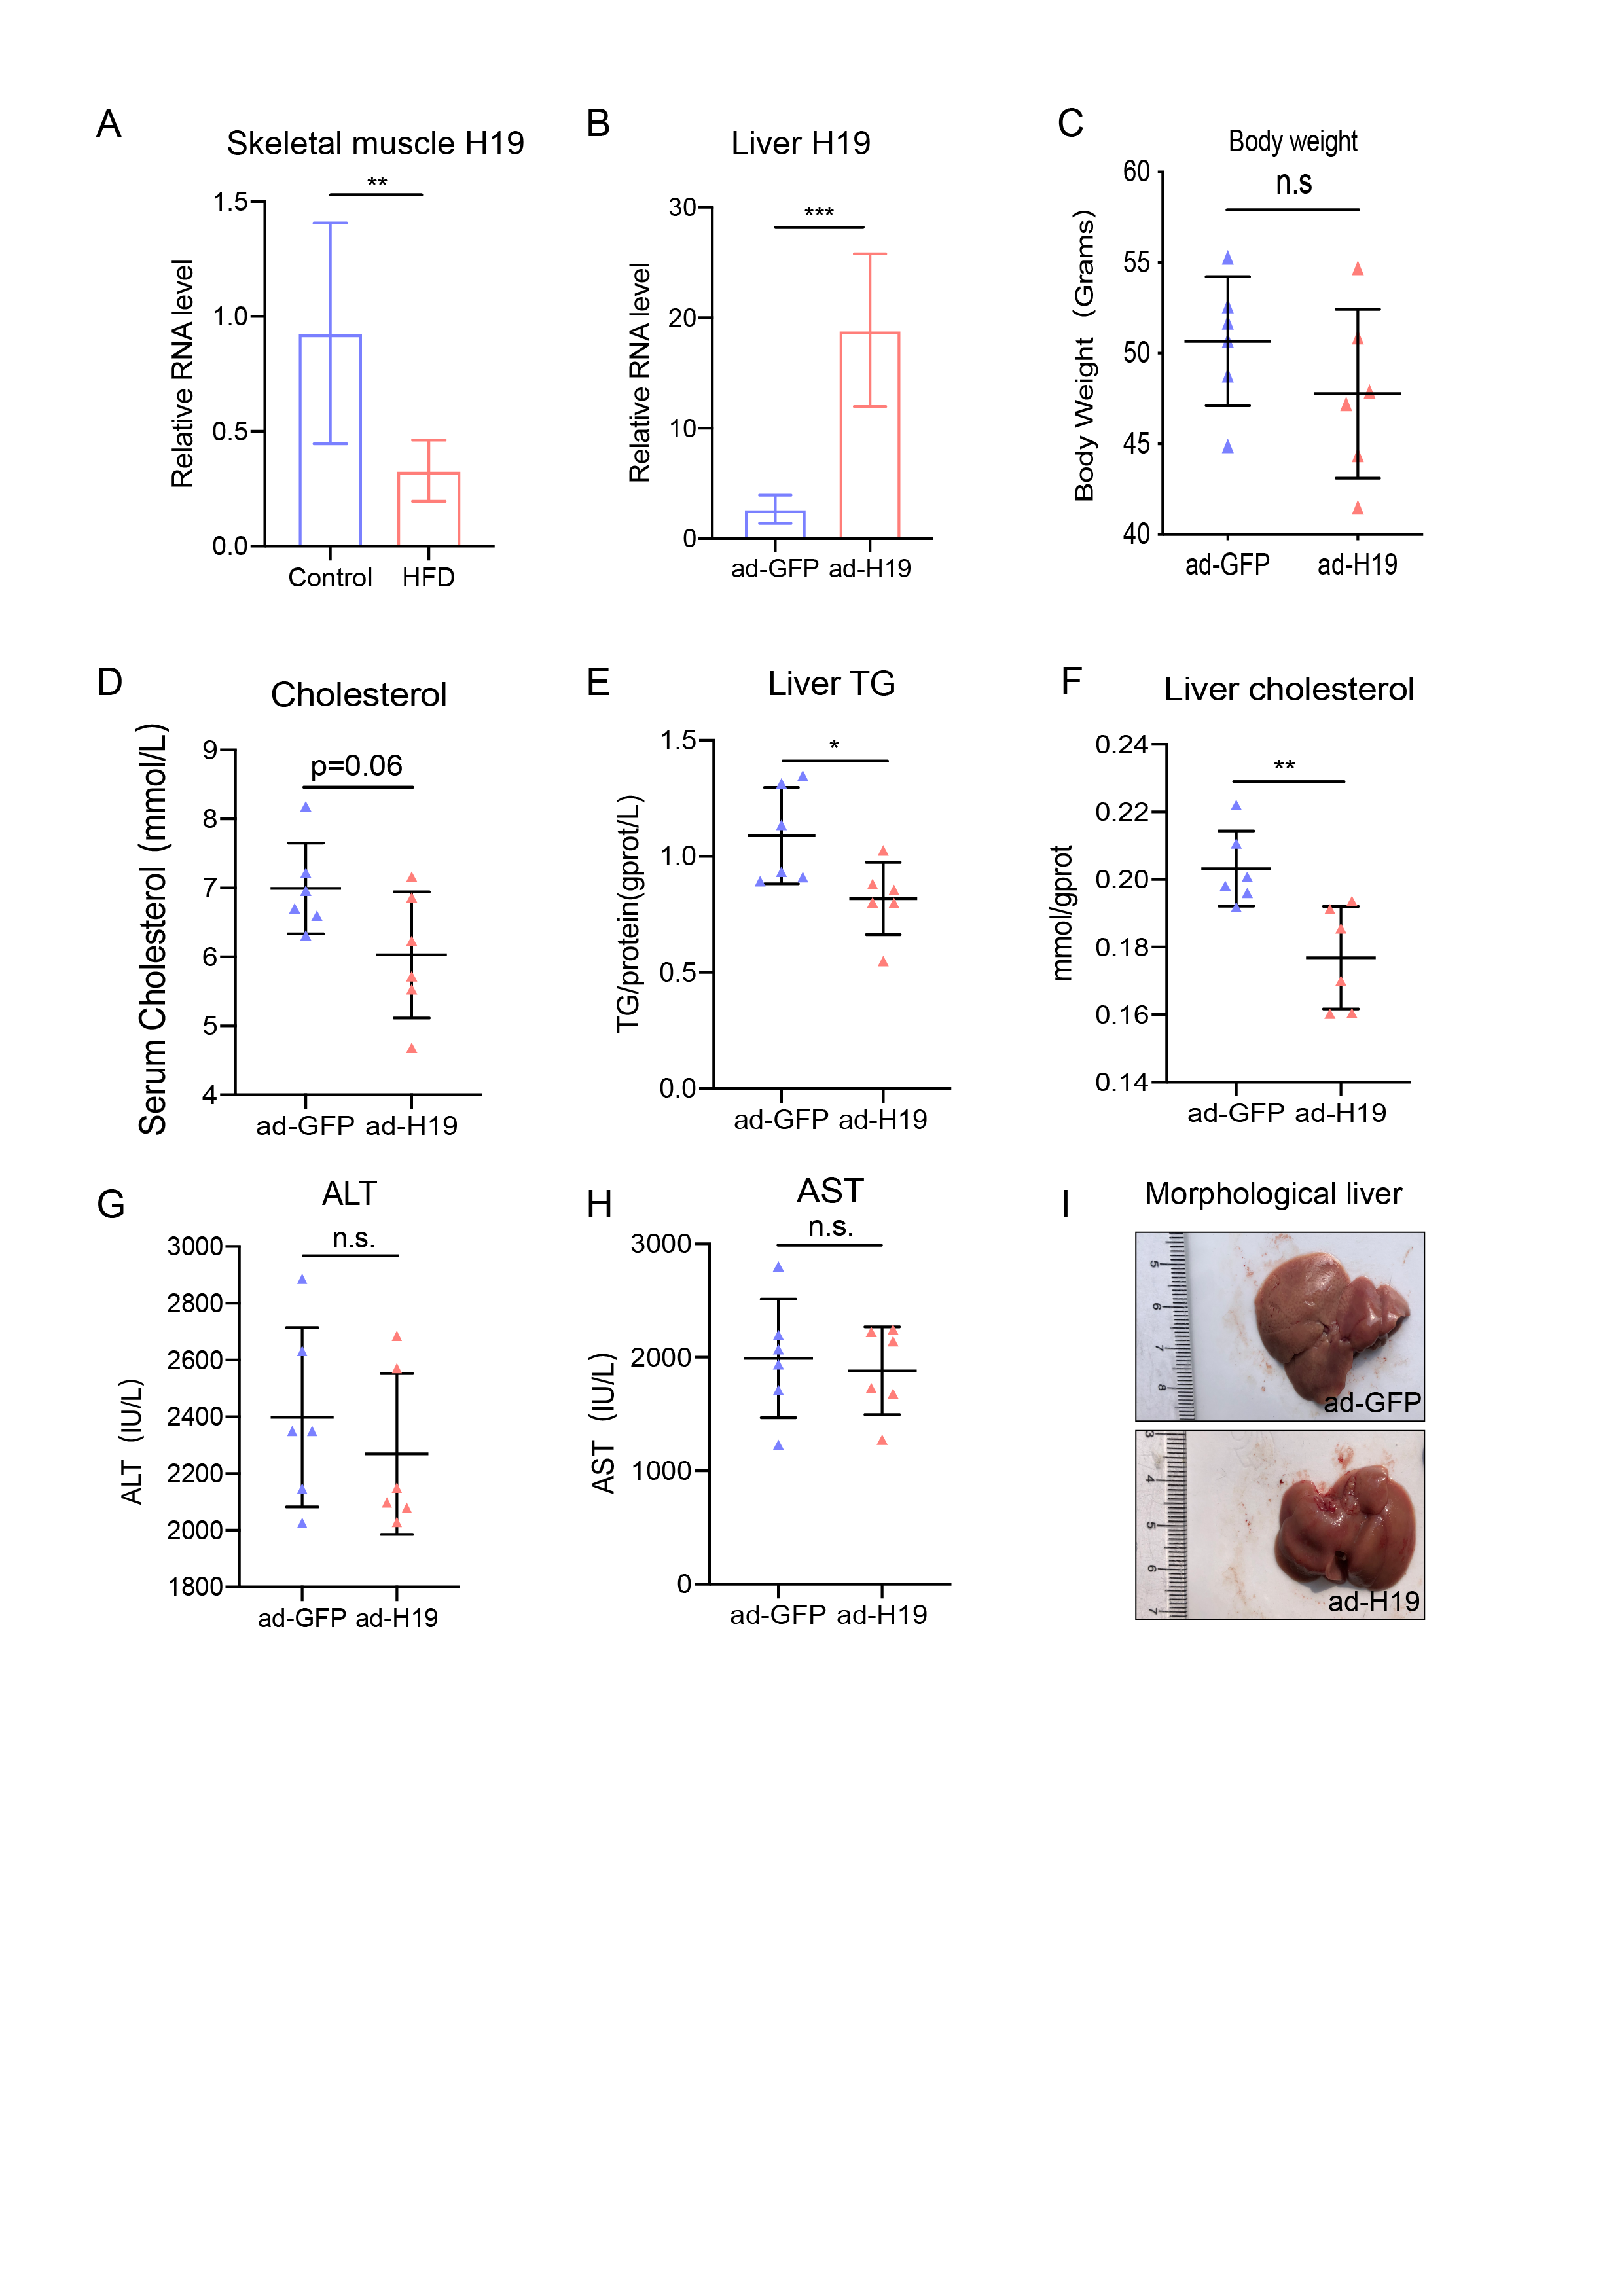
All the experiments were approved by the Animal Care Committee of Zhejiang University. Male 6-week-old C57BL/6J mice (n=14), male C57BL/KsJ-db/m (db/m) (n=6) and male C57BL/KsJ-db/db (db/db) mice (n=12) were purchased from the Model Animal Research Center of Nanjing University (Nanjing, China), and were maintained on a 12 h light-darkness cycle in a specific-pathogen-free animal laboratory. After a week of adaptive feeding, mice were granted free access to water and received either a normal-chow diet (NCD) (n=7) or high-fat diet (HFD, 35% carbohydrate, 20% protein and 45% fat) (n=7) for 3 months under controlled light and temperature conditions in order to induce phenotypes associated with obesity and insulin resistance. After 3 months, the quadriceps femoris muscle was collected from each mouse.
Db/db mice were provided free access to water and NCD, and were randomly divided into control mice and H19-overexpression mice after one week of adaptive feeding. There were 6 mice in each group.
2.2. Overexpression of H19 in db/db mice
The adenoviruses (Ad) expressing H19 and ad-green fluorescent protein (GFP) were constructed by Shanghai Genechem Company. To overexpress H19 in db/db mice, we injected 1.0 x 10⁹ plaque forming units of Ad-H19 or Ad-GFP into the tail vein once a week. After 2 weeks of treatment, oral glucose tolerance tests (OGTT) (1.0 g glucose/kg body weight) were carried out after an overnight fast, and tail blood was obtained to measure blood glucose levels using One Touch Ultra glucose stripes (LifeScan, PA, USA) at 0, 15, 30, 60 and 120 min. Two days later, the mice were sacrificed by cervical dislocation. Blood samples were obtained and serum was immediately frozen at -80°C for further tests. Tissues, including the quadriceps femoris muscle and liver, were carefully excised and weighed, and then stored at -80°C for follow-up experiments.
2.3. Isolation of satellite cells and cell culture
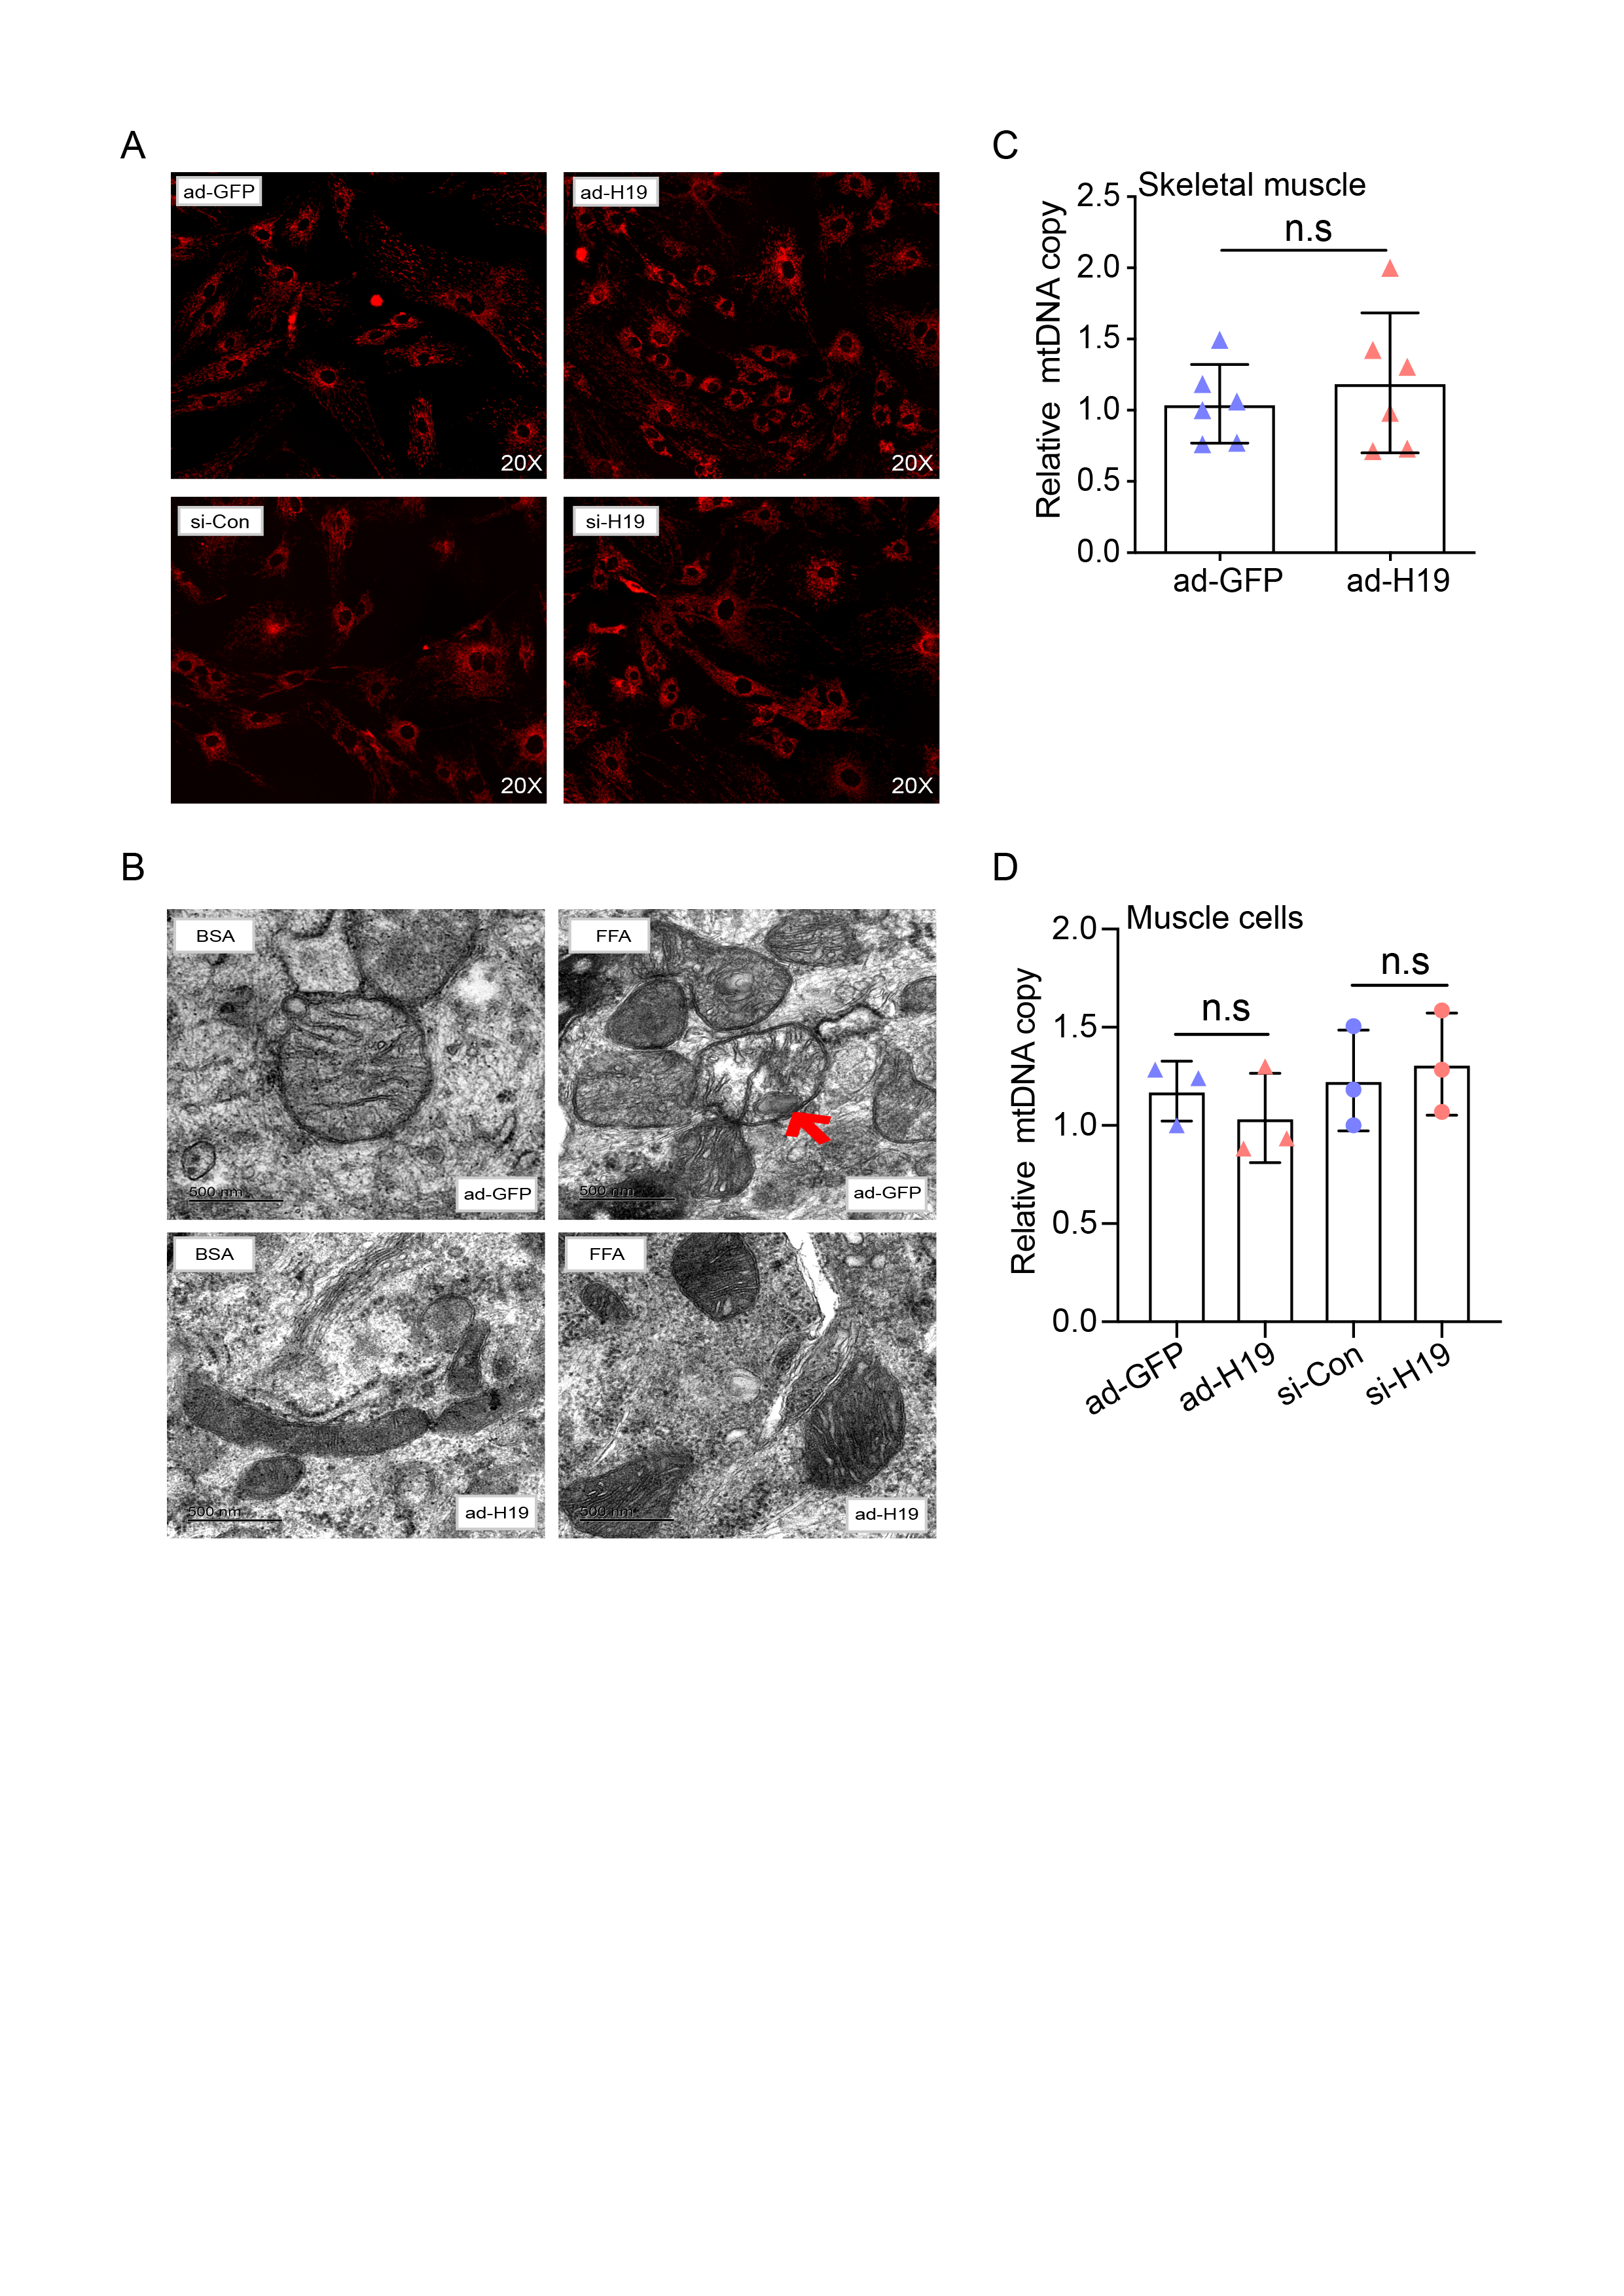
Primary satellite cells were separated from the quadriceps femoris muscles of 7-day-old C57BL/6J mice(29). Briefly, dissected muscles were washed twice with Hanks balanced salt solution (HBSS), then collected into digestive medium consisting of 1% collagenase (Solarbio), HBSS and phosphate-buffered saline (PBS). Samples were minced with fine scissors and transferred to a 50 ml centrifuge tube with 20 ml digestive medium. The tube was then incubated in a standard humidified tissue culture incubator (37°C, 5% CO2) for 45 minutes with two five-minute agitations during the incubation. The digestion was stopped using growth medium consisting of Ham's F10 medium (Invitrogen) with 10% fetal bovine serum (FBS, Bio-rad), and the specimen was then filtered through a 100 μm cell strainer. The mixture obtained was precipitated by centrifugation at 1400 g for 10 min, and only the satellite cells were collected for further experiments. To separate the satellite cells from fibroblasts, we adopted the density centrifugation method developed by Yablonka-Reuveni and Nameroff(30). Briefly, the cell suspension was transferred to a 15 ml Falcon tube that contained 20% colloidal polyvinylpyrrolidone coated silica (Percoll; Sigma) layered on top of a 60% Percoll cushion. The sample was centrifuged at 1800 g for 20 minutes, after which satellite cells could be obtained at the interface of the 20% and 60% Percoll layers.
For cell culture, satellite cells were grown in growth medium (Dulbecco’s modified Eagle’s medium (DMEM) containing 10% FBS and 100 IU/ml penicillin-streptomycin). When the cells reached 70-80% confluence, the growth medium was replaced with differentiation medium (DMEM containing 2% horse serum) for 5 days. Mouse C2C12 myoblasts (American Type Culture Collection, ATCC) were grown in growth medium (37°C, 5% CO2). The differentiation method use for myoblasts was similar to that used for primary satellite cells.
2.4. Differentiated primary satellite cells transfection and infection
Transfection of differentiated primary satellite cells was performed in a 6-well plate. For H19 and hnRNPA1 knockdown, small interfering RNAs were used. Briefly, 5 pmol of si-Con, si-H19 or si-hnRNPA1 was mixed with Lipofectamine 2000 transfection reagent (Thermo Fisher Scientific) and added to cells according to manufacturer's instructions. For H19-overexpression experiments, differentiated primary satellite cells were infected with ad-GFP or ad-H19. For hnRNPA1-overexpression experiments, the hnRNPA1-GV208 overexpression plasmid (OE-hnRNPA1) and GFP-GV208 (OE-vector) were obtained from Shanghai GeneChem Co., Ltd. (Shanghai, China). Lipofectamine 2000 transfection reagent was used for hnRNPA1 overexpression experiments. At 48 hours after transfection or infection, RNA and protein were extracted from the cells for further analysis. The siRNAs were designed by Ribo Biotechnology (Shanghai, China). The sequences of H19 siRNAs (three H19 siRNAs were constructed as a mixture) and hnRNPA1 siRNAs were as follows:
si-NC, 5'-CTCCAGGGAGGTGATAGGAG-3'
si-H19-1, 5'-GCAGAATGGCACATAGAAA-3'
si-H19-2, 5'-GGATCCAGCAAGAACAGAA-3'
si-H19-3, 5'-GCAGTCATCCAGCCTTCTT-3'
si-hnRNPA1-1, 5'-AGAAGACACTGAAGAACAT-3'
si-hnRNPA1-2, 5'-CGATGAAGGGAGGAAACTT-3'
2.5. RNA extraction and RT-qPCR analysis
Total RNA was isolated from frozen quadriceps femoris muscle and liver samples or from differentiated primary satellite cells using TRIzol reagent (Invitrogen). A reverse transcription kit (Yeasen, China) was used to synthesize cDNA in a 20 μl reaction containing 1-5 μg of total RNA. A SYBR Green kit (Yeasen, China) was used to perform RT-qPCR in a 20 μl reaction containing 0.5-1 μl cDNA. Target mRNA levels were normalized to that of β-actin as an internal control and changes in expression were calculated using the formula 2-△△Ct. The primer sets used are shown in Supplementary Table 1.
2.6. Western blot analysis
Differentiated primary satellite cells in 6- or 12-well plates were quickly lysed in situ in 1x SDS-sample buffer (200 μl/well for 6-well plates or 100 μl/well for 12-well plates), followed by denaturation. For muscle tissue samples, frozen samples (20 mg) were immediately ground on ice in 200 μl RIPA lysis buffer (Fdbio science, #FD008) in the presence of protease inhibitors (Solarbio, P0100). Samples were then homogenized in 5× SDS-sample buffer at a final concentration of 1×, followed by denaturation. Protein samples were run on a 10% SDS-polyacrylamide gel, and Western blot analysis was performed. Primary antibodies were diluted 1:1000, and included anti-phosphorylated (p) AMPK (Cell signaling technology 2535), anti-AMPK (Cell signaling technology 2532), anti-phosphorylated (p) ACC (Cell signaling technology 3661L), anti-ACC (Cell signaling technology 3662), anti-SIRT1 (Abcam, ab110304), anti-CPT1b (Proteintech, 22170-1-AP), anti-CD36 (Abclonal, A19016), anti-PGC1a (Abclonal, A12348), anti-OXPHOS (Abcam, ab110413) and anti-GAPDH (Abclonal, Ac001). GAPDH was used as a loading control. The bands on Western blots were analyzed using Image J.
2.7. Differentiated primary satellite cells lipid measurements
Lipid measurements from differentiated primary satellite cells were performed using a triglyceride assay kit (Nanjing Jiancheng, China, A110) and ELISA kit(Renjie bio,China,RJ17089. Briefly, following H19 overexpression or silencing in differentiated primary satellite cells, free fatty acids (FFA) consisting of 15mmol/l oleic acid and 15mmol/l palmitate acid were added to the cells for 16 h. The final working concentration of FFA in the cells was 0.75 mmol/l. After incubation, cells were lysed with standard RIPA lysis buffer and then centrifuged at 12,000 g for 10 minutes at 4°C. The supernatant was isolated and stored on ice. Triglyceride (TG) and diglyceride (DAG) levels were quantified using the previously mentioned kits according to the manufacturer's protocols.
2.8. Nile Red Staining
Differentiated primary satellite cells were pre-treated with free fatty acids as described above. Cells were then washed three times with PBS, fixed with 4% formaldehyde and stained for 15 minutes with 0.05 μg/ml Nile red solution (Solarbio, China, N8440) to visualize lipid droplets. Cell nuclei were counterstained with 496 diamidino-2-phenylindole (DAPI, Yeasen, China) and images were acquired using a fluorescent microscope (Zeiss Germany).
2.9. Immunohistochemical staining
Immunohistochemistry staining was performed on the muscle samples of db/db mice. Skeletal muscles were fixed in 4% formaldehyde and cut into 5 μm thick sections. Some sections were stained with hematoxylin and eosin (H&E) and the remaining sections were stained with Oli Red O solutions (Nanjing Jiancheng, China), according to manufacturer's guidelines, to determine the lipid content in the skeletal muscle samples. Histology images were obtained using a microscope with a digital camera attachment (Nikon, Japan).
2.10. Mitochondrial respiration analysis
The XF Mito Stress Test Kit (Seahorse Bioscience) was used to measure mitochondrial respiration of myotubes on an XFe96 Extracellular Flux Analyzer. The concentrations of oligomycin, carbonyl cyanide-4 (trifluoromethoxy) phenylhydrazone (FCCP) and rotenone/antimycin used were 1.0, 1.0 and 0.5 μmol/l, respectively. The oxygen consumption rate (OCR) was recorded as recommended by the manufacturer. The respiration experiments were normalized to the number of cells.
2.11. Transmission electron microscopy
Fixed differentiated primary satellite cells were washed within 0.1 M PBS, fixed with 1% buffered osmium tetroxide for 1 hour, and then stained with aqueous 2% uranyl acetate. The samples were washed three times in water and dehydrated in increasing concentrations of ethanol (50%, 70%, 90% and 100%). The samples were then cut into ultrathin 0.5 μm sections with a Leica UC7 ultramicrotome. A Hitachi H-7100 transmission electron microscope (Hitachi-High Technologies Co., Shimbashi, Tokyo, Japan) was used to analyze the stained sections.
2.12. RNA immunoprecipitation (RIP)
RIP was performed using a Magna RIPTM RNA-Binding Protein Immunoprecipitation Kit with minor modifications. Briefly, cell lysates from 2.0x10⁷ cells per RIP reaction were lysed in RIP Lysis Buffer, incubated on ice for 10 minutes and centrifuged for at 4°C 15 minutes at 14000 g. Anti-hnRNPA1 or mouse IgG (5 μg) was added to 50 μl magnetic beads, and the samples were incubated at RT for 30 minutes with gentle rotation. Then supernatant protein was added into each antibody/bead reaction, and the samples were incubated at 4°C overnight with gentle rotation. After incubation, RNA was extracted from the binding reaction with TRIzol and analyzed by RT-PCR.
2.13. RNA Pull-Down Assay and Mass Spectrometry
PierceTM Magnetic RNA-Protein Pull-Down Kit was used to perform RNA pull-down experiments. Biotin-labeled RNA probes were synthesized by Tsingke and 100 pmol of biotinylated RNAs were used for pull-down experiments. Total protein extracts were obtained from C2C12 myoblast cells using standard lysis buffer (25 mmol/l Tris-HCl, pH7.4, 150 mmol/l NaCl, 1% NP-40, 1 mmol/l EDTA, 5% glycerol). Protein extracts were precleared with streptavidin magnetic beads (Thermo scientific) and then incubated with 100 pmol of biotinylated RNAs for 1 hour at 4°C. Beads were washed with wash buffer and the proteins bound to the RNA were analyzed by SDS-polyacrylamide gel followed by silver staining and mass spectrometry.
2.14. Statistical Analysis
All data are shown in this study as mean ± standard deviation (SD). Statistical significance was determined using two-tailed Student's t-test, with P values < 0.05 considered significant. Each in vitro experiment was conducted in triplicate.