Chloroplast genome sequencing and assembly
The cp genome of ‘Wuyi narcissus’ cultivar of C. sinensis var. sinensis was constructed by PacBio long-reads with Illumina paired-ends data support. In total, 46,941,086 Illumina reads (7.04 Gb, Average read length 145 bp) and 364,638 PacBio reads (10383 reads >5000 bp, Average read length 1139 bp) were mapped to the complete genome, respectively. The average organelle coverage reached 43,419× and 2650× sequencing depth, respectively. The de novo assembly using error‐corrected PacBio reads resulted in a circular genome of 156,762 bp length (Fig. 1). Raw reads, assembled cp genome sequences and accompanying gene annotations had been deposited in the NCBI GenBank (SRA: SRR12002624, Accession numbers: MT612435).
Chloroplast genome structure and characteristics analyses
All four complete cp genomes displayed the typical quadripartite structure of most angiosperms, including the large single copy (LSC), the small single copy (SSC) and a pair of inverted repeats (IRa and IRb). Among these cp genomes, genome size ranged from 156,762 bp to 157,353 bp due to expansion and contraction of cp genomes. The length varied from 86,301 bp to 87,214 bp in the LSC region, from 18,079 bp to 18,285 bp in the SSC region, and from 26,030 bp to 26,090 bp in IR region (Tab. 1).
Each cp genome contained a total of 137 genes, including 92 protein-coding genes, 37 transfer RNA (tRNA) genes and 8 ribosomal RNA (rRNA) (Supplementary Tab. S5). Of them, 60 protein-coding and 22 tRNA genes were located within LSC, 16 protein-coding genes, 14 tRNA coding genes and eight rRNA coding genes were located within IRs and 11 protein-coding and one tRNA gene were located within SSC. The rps12 gene was a divided gene with the 5′ end exon located in the LSC region while two copies of 3′ end exon and intron were located in the IRs. The ycf1 was located in the boundary regions between IR/SSC, leading to incomplete duplication of the gene within IRs. There were 18 genes containing introns, including 6 tRNA genes and 12 protein-coding genes. Except for two introns in the ycf3 and clpP genes, all other genes contained only one intron. MatK gene was located within the intron of trnK-UUU with the largest intron (2,489 bp). Overlaps of adjacent genes were found in the complete genome, rps3-rpl22, atpB-atpE, and psbD-psbC had a 16 bp, 4 bp, and 53 bp overlapping region, respectively. Unusual initiator codons were observed in rps19 with GTG and orf42 with ATC in four cp genomes. The initiation codon of ndhD in CIA was ATG, while that of other three cp genomes was GTG.
Sequence variation analyses
The differences and evolutionary divergences among four cp genomes were compared using nucleotide substitutions and sequence distance. Across all four species, the value of nucleotide differences was 70-185, and the p-distance was 0.00045–0.00118. The value of nucleotide difference (70) and the p-distance (0.00045) between triploid CWN and diploid CSS was smallest (Tab. 2).
To identify the potential genome rearrangements and inversions, the cp genome sequences of four species were plotted to check their identity using the program mVISTA. No gene rearrangement and inversion events were detected (Fig. 2). Sequence divergence analyses showed four regions (including rp12/trnH-UGU, psaA/ycf3, atpB/rbcL and psbT/psbH) had relatively higher divergence values (Pi > 0.006) (Fig. 3). Mutations of the base replacement or deletion may cause changes in the length of the coding gene sequence, leading to changes in the coding and non-coding regions. Therefore, the variable characters in coding and non-coding regions among four cp genomes were further analyzed. The results showed that the proportion of variability in non-coding regions was with a mean value of 1.82%, while in the coding regions was 1.15%. Five coding genes had over 4% variability proportion, such as rps19, ndhF, ndhD, ndhI and ycf1. Five non-coding regions had over 10% variability proportions, such as rpl2/trnH-GUG, trnE-UUC/trnT-GGU, ndhD/psaC, ndhI/ndhA and rps15/ycf1 (Fig. 4).
To further observe the potential contraction and expansion of IR regions, the gene variation at the IR/SSC and IR/LSC boundary regions of the four plastomes was compared (Fig. 5). The genes rps19, ycf1-5'end/ndhF, ycf1 and rp12/trnH-GUG were located in the junctions of LSC/IR and SSC/IR regions. The rps19 gene in CSS, CSA, and CWN was 279 bp, and crossed the LSC/IR region by 46 bp while the rps19 gene in CIA was just 150 bp, and all located in the LSC region, 1bp away from the IR region. The ycf1-5'end gene in CSS, CSA, and CWN was 1071 bp, and crossed the IR/SSC region by 2 bp while in CIA was 1065 bp, and crossed the IR/SSC region by 33 bp. The ndhF gene in all four cp genomes was located in the SSC region. The ndhF gene in CSA, CIA, and CWN was 2247 bp while in CSS was 2139. The ndhF gene in CSS was 165 bp away from the IR region, in CSA or CWN was 57 bp away from the IR region while in CIA was 88 bp away from the IR region. The ycf1 gene in CSS or CWN was 5622 bp, in CSA was 5628 bp while in CIA was only 1038 bp. The ycf1 genes in all four cp genomes crossed the IR/SSC region. The ycf1 gene in CSS or CWN was with 4553 bp located in the SSC region and 1069 bp in IR region, in CSA was with 4559 bp located in the SSC region and 1069 bp in IR region while in CIA was with only 6 bp located in the SSC region and 1032 bp in IR region. The rpl2 gene in CSS, CSA or CWN was 107 bp away from the LSC region while in CIA was 82 bp away from the LSC region. The trnH-GUG gene in CSS, CSA or CWN was 2 bp away from the IR region while in CIA was 637 bp away from the IR region.
Repeat and indel sequence analyses
Simple sequence repeats (SSRs) are small repeating units of cpDNA, a total of 671 SSRs were identified in four cp genomes (Fig. 6A), of which 57% were in IGS, 34% were in CDS, and 9% were in Intron (Fig. 6B). 74.0% of these SSRs were monomers, 19.3% of dimers, 0.5% of trimers, 5.3% of tetramers, 0.9% of hexamers and no pentamers found. Comparing the four genomes, except for 167 SSRs of CIA, the other three were all 168. A total of 128 SSRs were identical among four cp genomes (Fig. 6C). There were 47 loci with different SSR types, most of which existed in the LSC region. Among them, CSS had 7 unique types, CSA had 18 unique types, CIA had 9 unique types, and CWN had 14 unique types (Fig. 6C, Supplementary Tab. S6).
A total of 270 long repeats were detected in four plastomes, including three categories of long repeats: tandem, forward and palindromic. The number of the three repeated types was consistent in CSS and CWN, as follows: 23, 20, 23. However, it was 19, 20, 23 in CSA and 21, 23, 32 in CIA. The sizes of repeats ranged from 11 to 82 bp (Fig. 7A, 7C). The four cp genomes have a total 57 identical long repeat sequences. In addition, CSS had 1 unique long repeat, CIA had 1 unique long repeat, CWN had 2 unique long repeats, while CSA had no unique long repeat (Fig. 7B). These unique repeats were found mainly in the intergenic psaA/ycf3, atpB/rbcL, trnW-CCA/ trnP-UGG, rps19/rpl2, psbT/psbN, rpl2/trnH-GUG and gene rpl2, ycf1, ycf2. Only one repeat was in the intron regions (ndhA) (Supplementary Tab. S7).
A total of 100 indels were found, and indels ranged in size from 1 to 637 bp (Fig. 8A). Most of the indels events occurred in IGS regions (70%), with 23% in CDS regions and only 7% in Intron regions (Fig. 8B). As expected, single-nucleotide indels (1 bp) were the most common, but some long indels also were found. The longest one was an insertion of 637 bp in CIA (intergenic rp12/trnH-GUG), followed by a 335 bp deletion in CWN (intergenic trnE-UUC/trnT-GGU) and a 107 bp deletion in CIA (gene rps19). Paired comparison showed that the CIA had the most indels compared to the other three species (Fig. 8C). In addition, CIA also possessed the most species-specific indels, with 49, followed by CSA with 16, CWN with 11 and CSS with 5 (Fig. 8D, Supplementary Tab. S8).
The regions with relatively high divergence values (rp12/trnH-UGU, psaA/ycf3, atpB/rbcL and psbT/psbH, Pi > 0.006) (Fig. 3) all were associated with the repeat and the indel sequences. For example, the repeat sequences Would be found within the region of rp12/trnH-UGU, atpB/rbcL and psbT/psbH. The indel sequences could be found within the region of rp12/trnH-UGU, psaA/ycf3 and psbN/psbH.
Correlation analysis of three types of mutation
Correlations were highly significant in the pairwise comparisons between the three types of mutations: “repeats and substitutions”, “indels and substitutions” and “repeats and indels”. The strength of correlations was greatest for “indels and substitutions” (r: 0.165-0.435) followed by“repeats and indels” (r: 0.090-0.120) and then “repeats and substitutions” (r: 0.028-0.049), and“indels and substitutions” had relatively higher significance value (t: 0.144-0.195) than “repeats and substitutions” (t: 0.103-0.145) (Tab. 3).
Codon usage analyses
ENc plots analysis showed only a few points lie near the curve, however, most of the genes with lower ENc values than expected values lay below the curve (Fig. 9), suggesting the codon usage bias of the cp genome was slightly affected by the mutation pressure, but selection and other factors play an important role. To further investigate the extent of influence between mutation pressure and natural selection on the codon usage patterns, Neutrality plot (GC12 vs. GC3) was performed. The correlation between GC1 and GC2 was strong (CSS: r = 0.445; CSA: r = 0.453; CIA: r = 0.445; CWN: r = 0.464, p <0.01). However, no significant correlation was found for GC1 with GC3 (CSS: r =0.141; CSA: r = 0.139; CIA: r = 0.078; CWN: r = 0.141) or GC2 with GC3 (CSS: r = 0.146; CSA: r = 0.143; CIA: r = 0.078; CWN: r = 0.152), which suggested mutation pressure had a minor effect on the codon usage bias. The slope of Neutrality plot showed that mutation pressure accounts for only 0.52%-8.42% on the codon usage patterns in four cp genomes, while natural selection accounts for 91.58%-99.48% (Fig. 10).
The distributions of codon usage in four cp genomes showed that RSCU values of the 37 codons (37/64, 57.81%) were identical in the three Chinese teas, but different from those in Indian tea (Tab. 4).
Analysis of cp sequence characterized amplified region (SCAR)
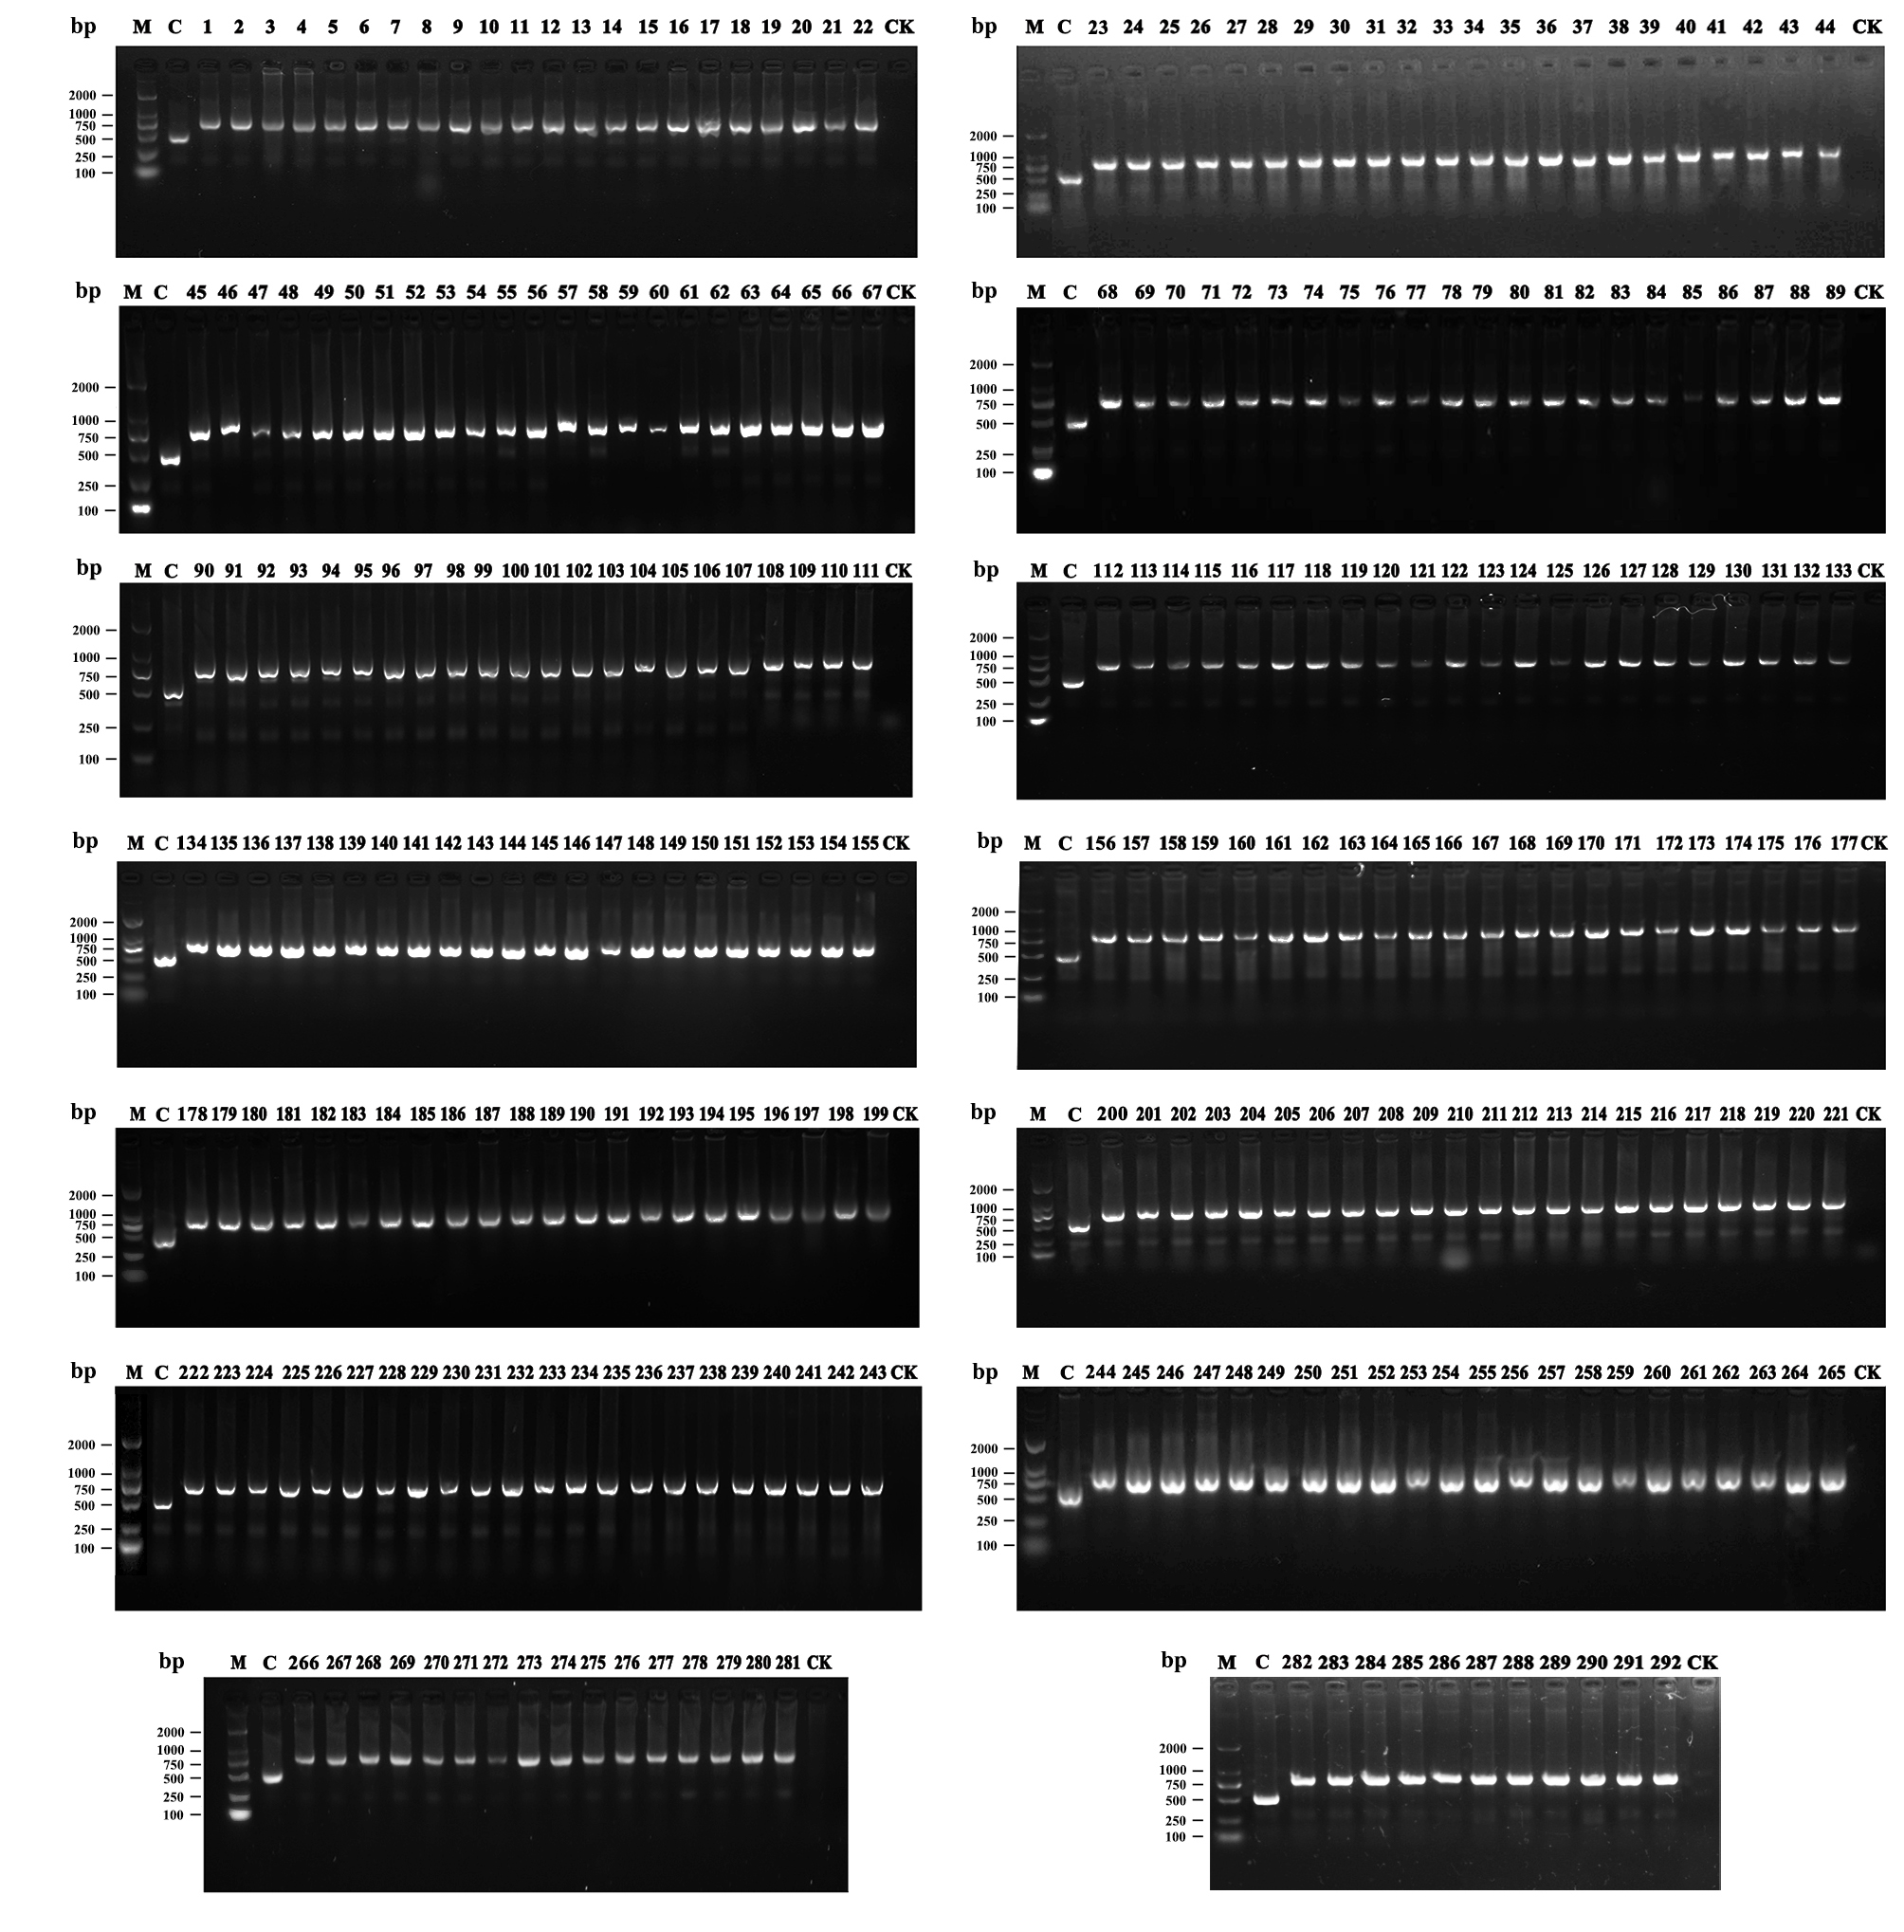
By comparing with the cp genomes of three representative diploid C. sinensis species, a 335 bp long deletion in the trnE/trnT intergenic spacer was found in triploid CWN (Fig. 11A). We used this marker for SCAR analysis in 292 individuals covering the majority of C. sinensis cultivars in China. No cultivar with similar sequence deletion characteristics to triploid CWN was detected (Fig. 11B,Supplementary Fig. S1). However, we could find similar sequence deletion in C. cuspidate (Accession numbers: NC022459), C. renshanxiangiae (Accession numbers: NC041672), C. elongata (Accession numbers: NC035652) and C. gymnogyna (Accession numbers: NC039626) by comparing the cp genome sequences (Fig. 11A).
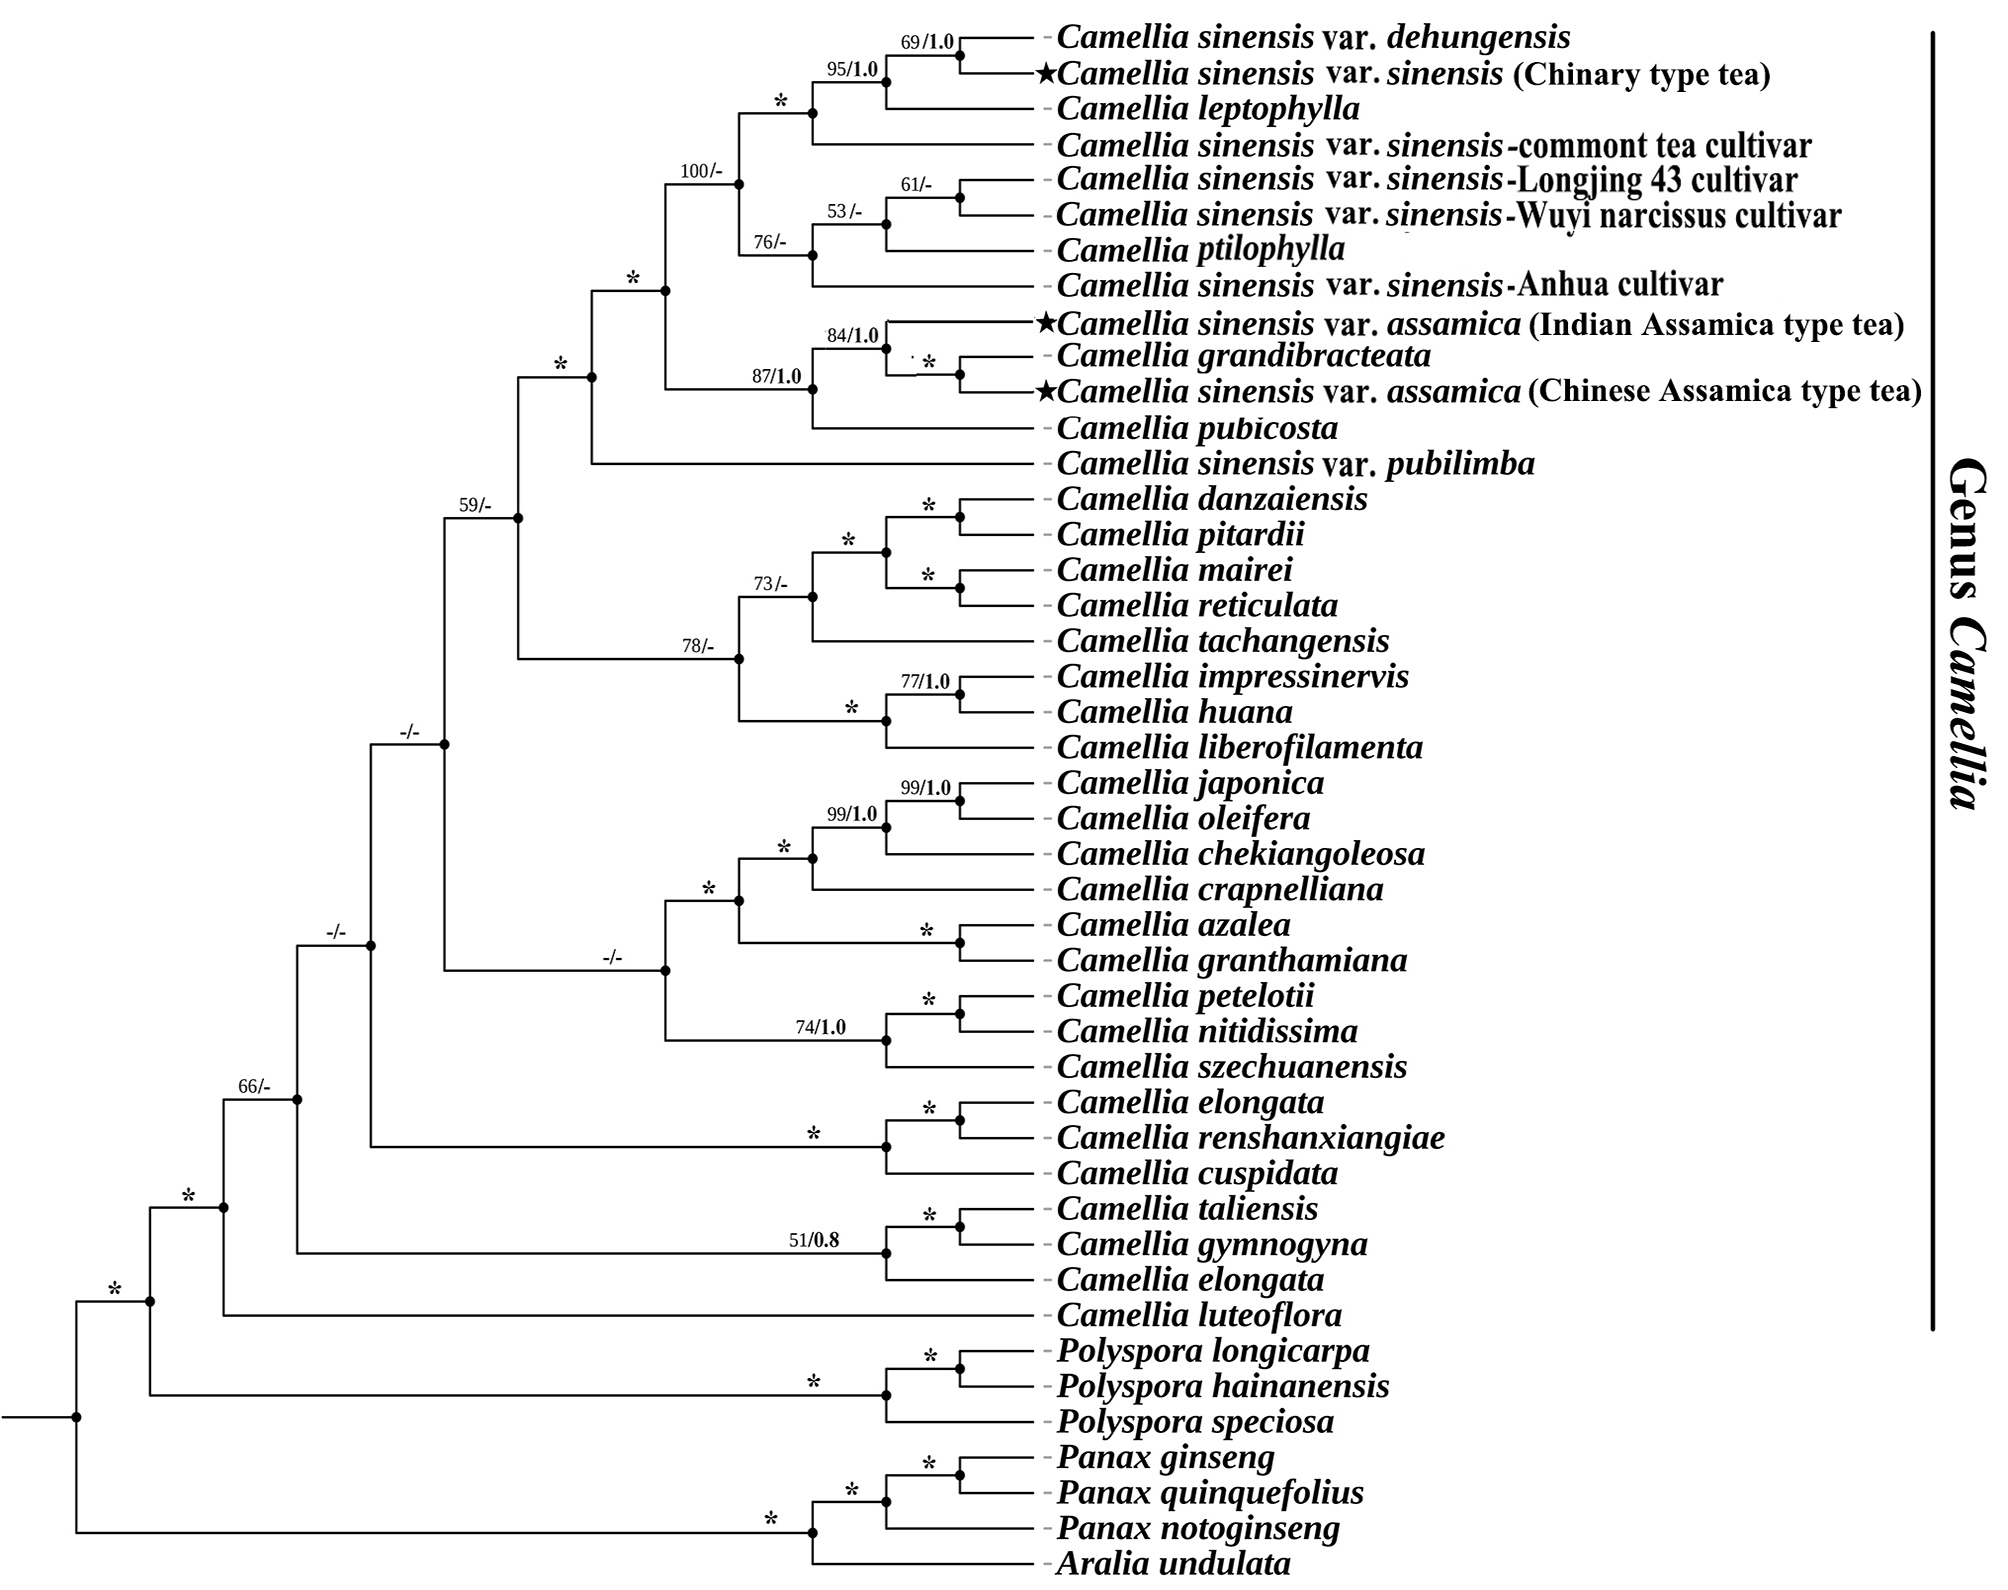
Phylogenetic analysis and the divergence time estimation of three tea plants
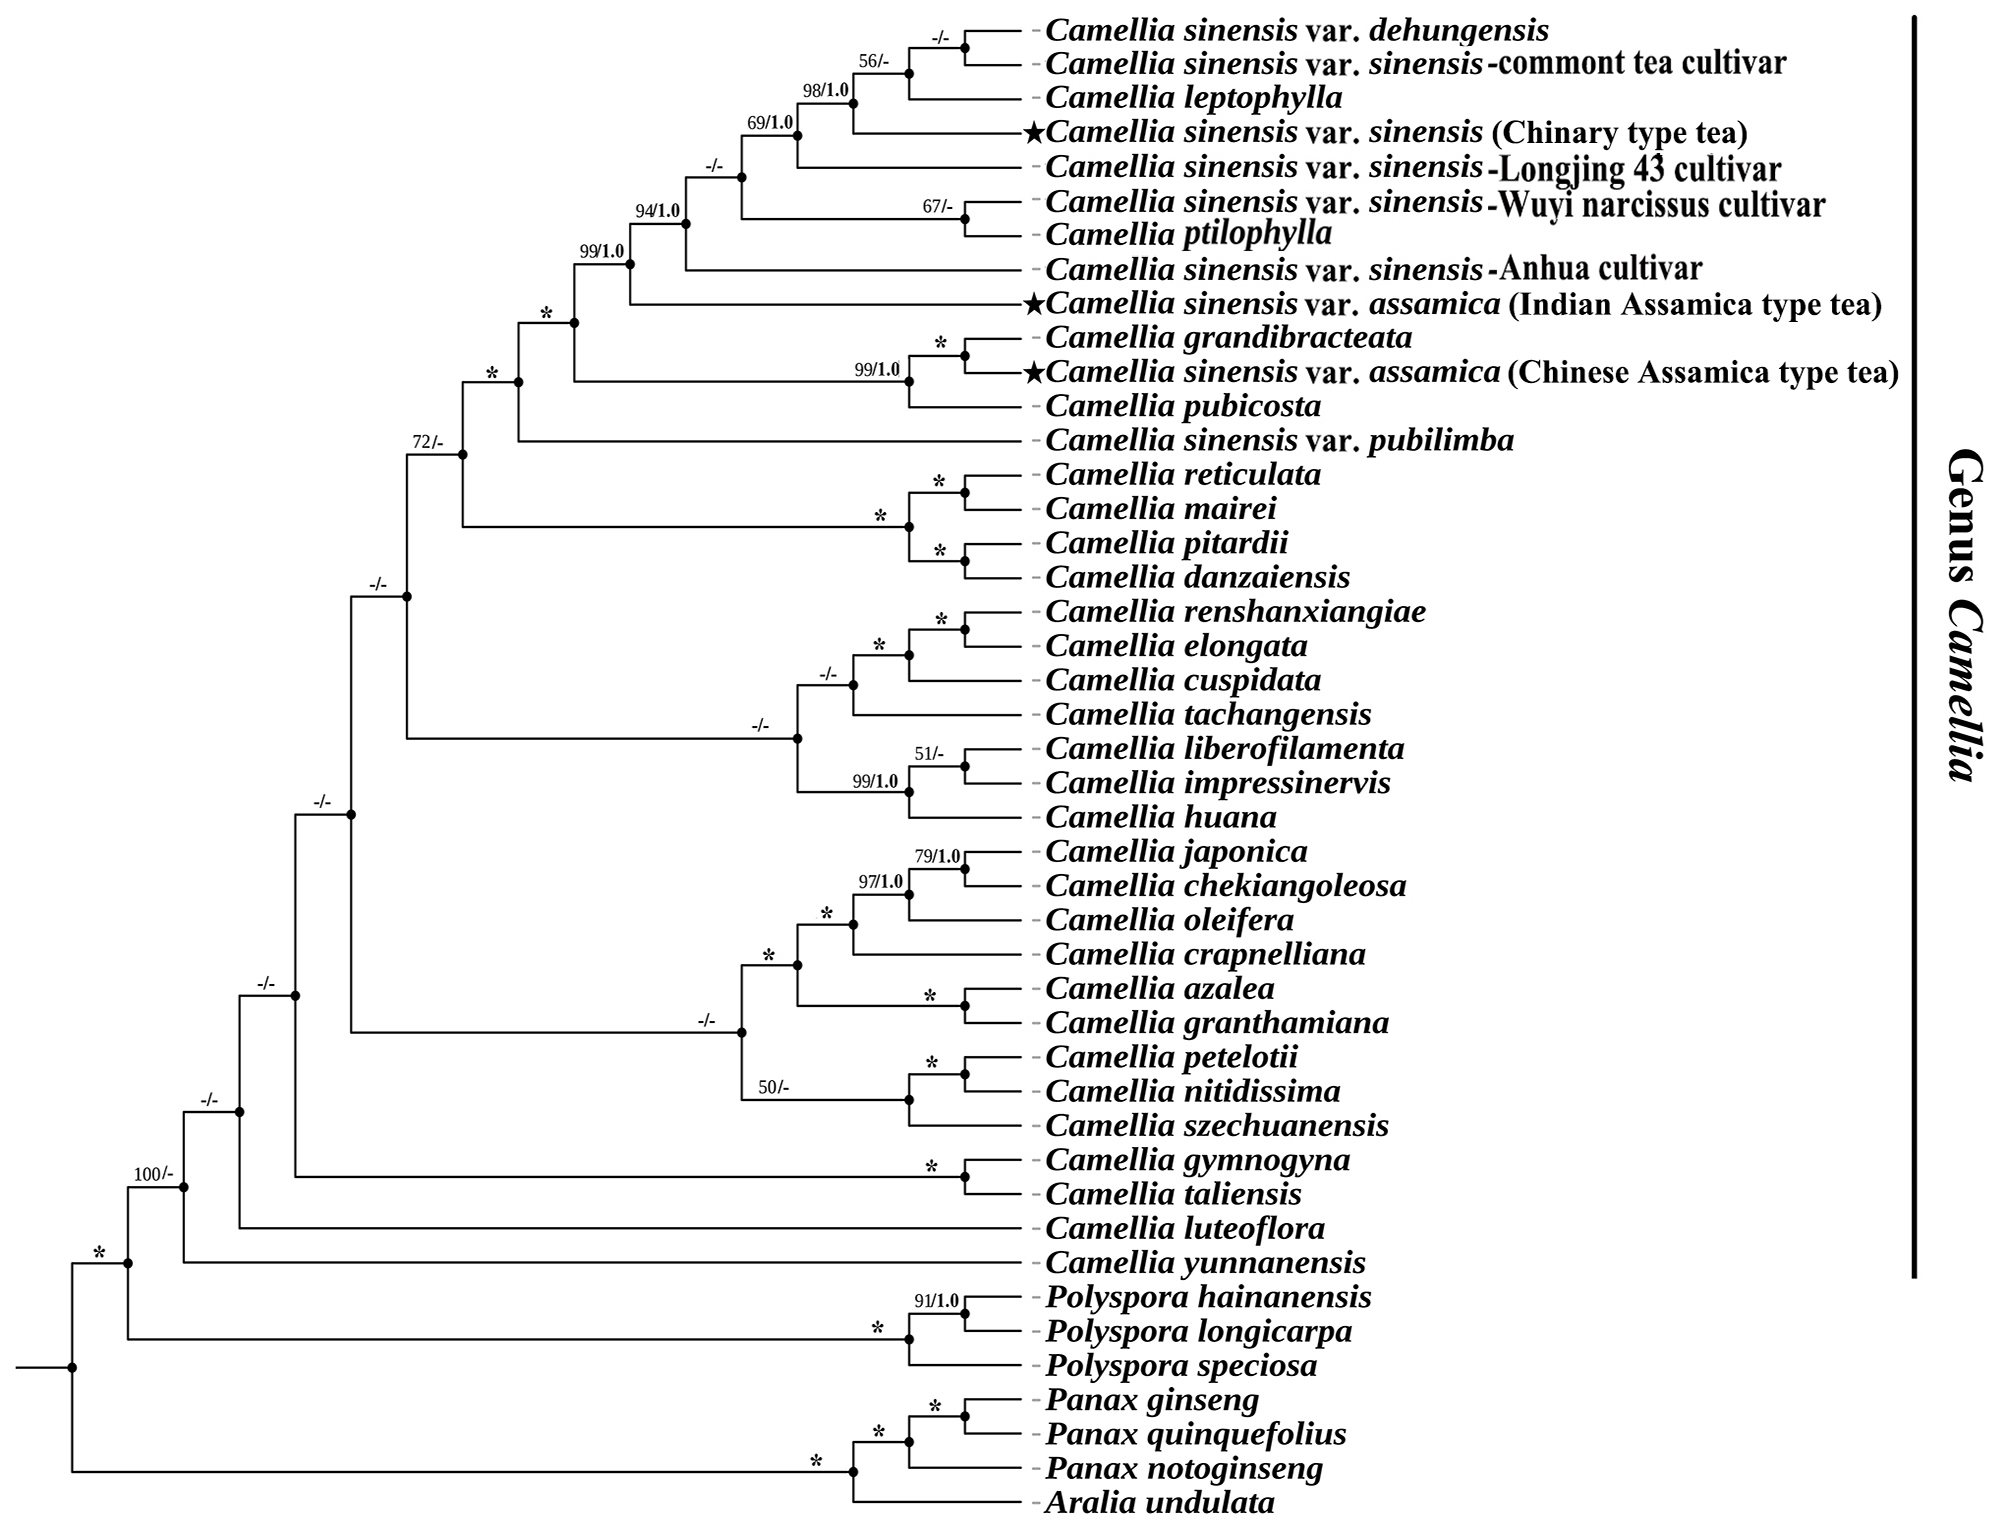
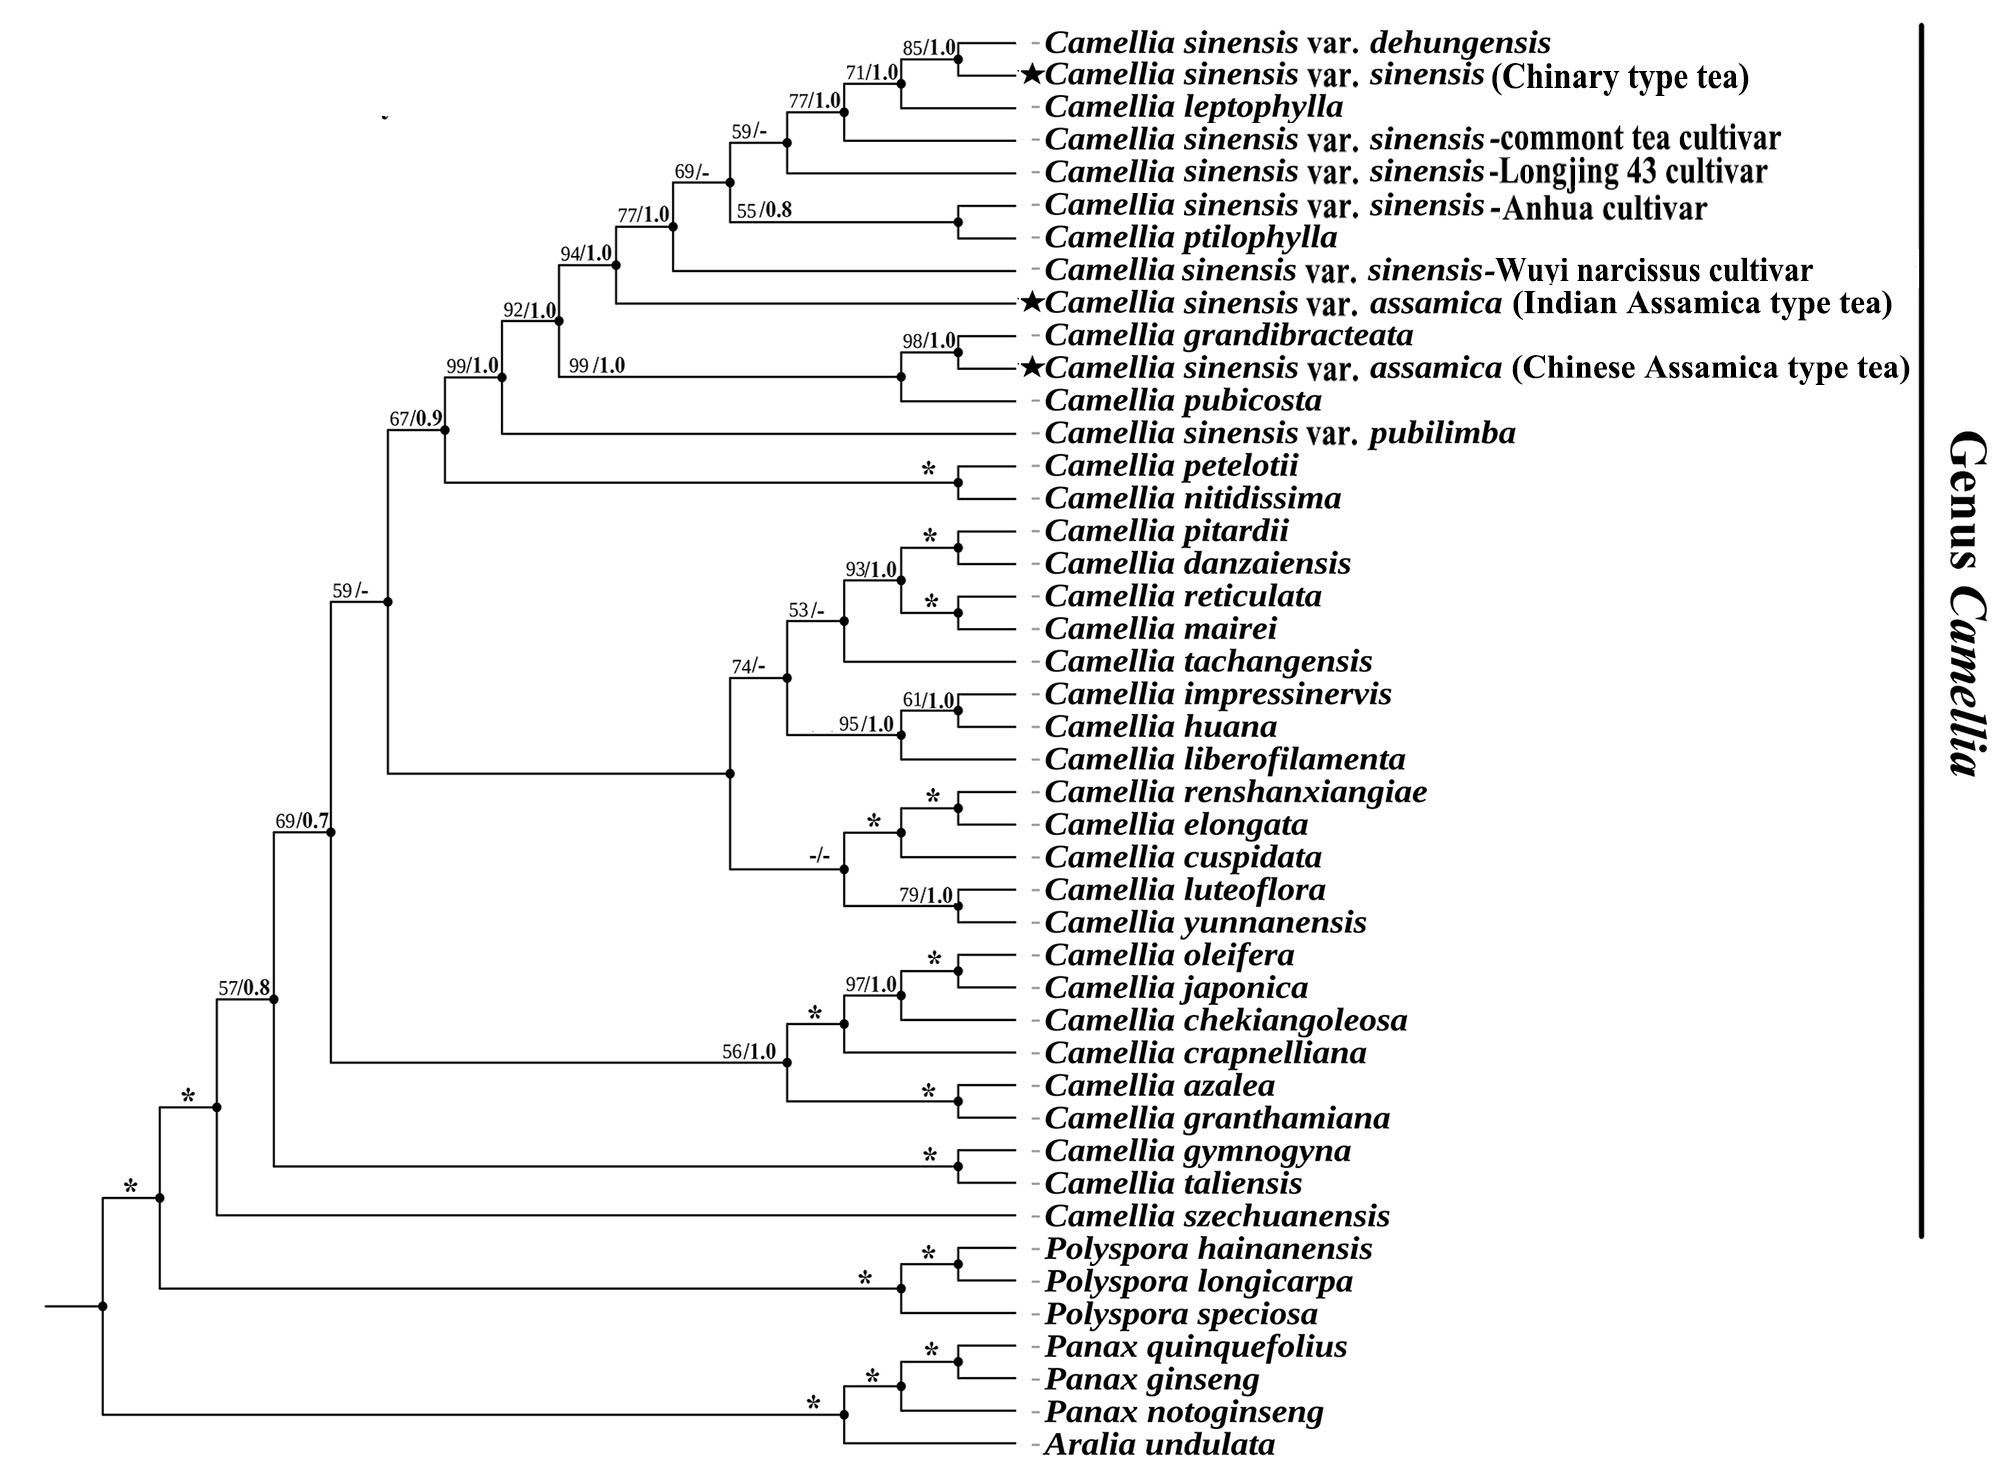
Phylogenetic trees were generated by ML and BI analysis based on 44 complete cp genomes showed the same topology. Cultivated tea plants were clustered into a single clade, within which Chinary type tea, Chinese Assamica type tea and Indian Assamica type tea were in separate lineages with high support, respectively (Fig. 12-13).
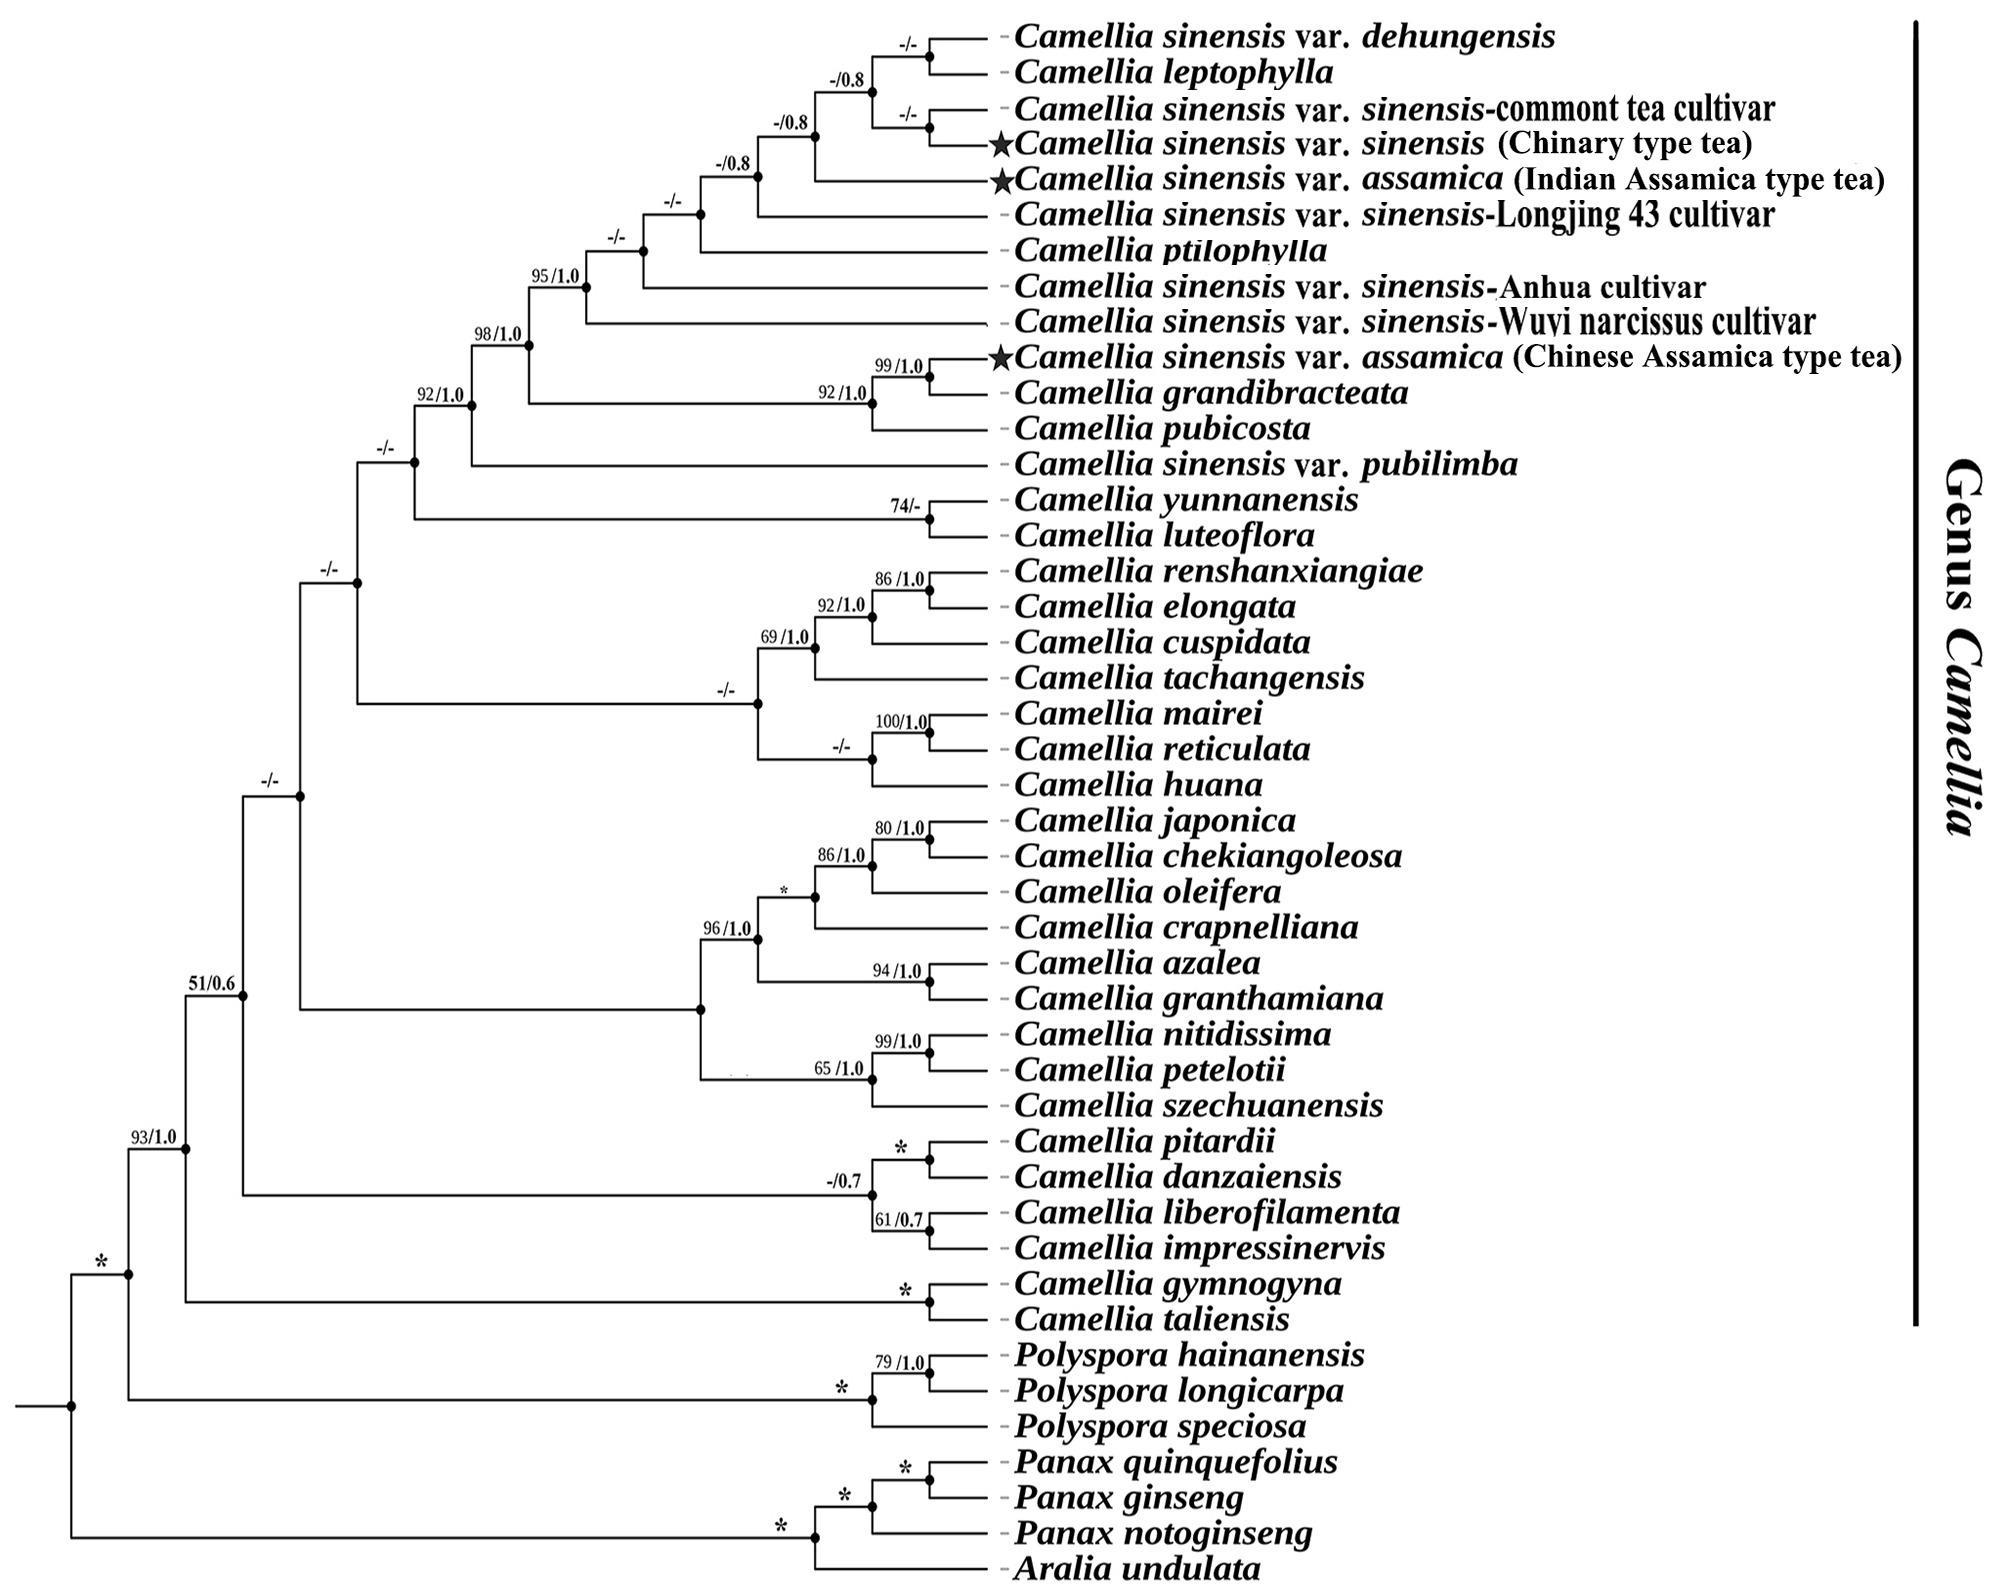
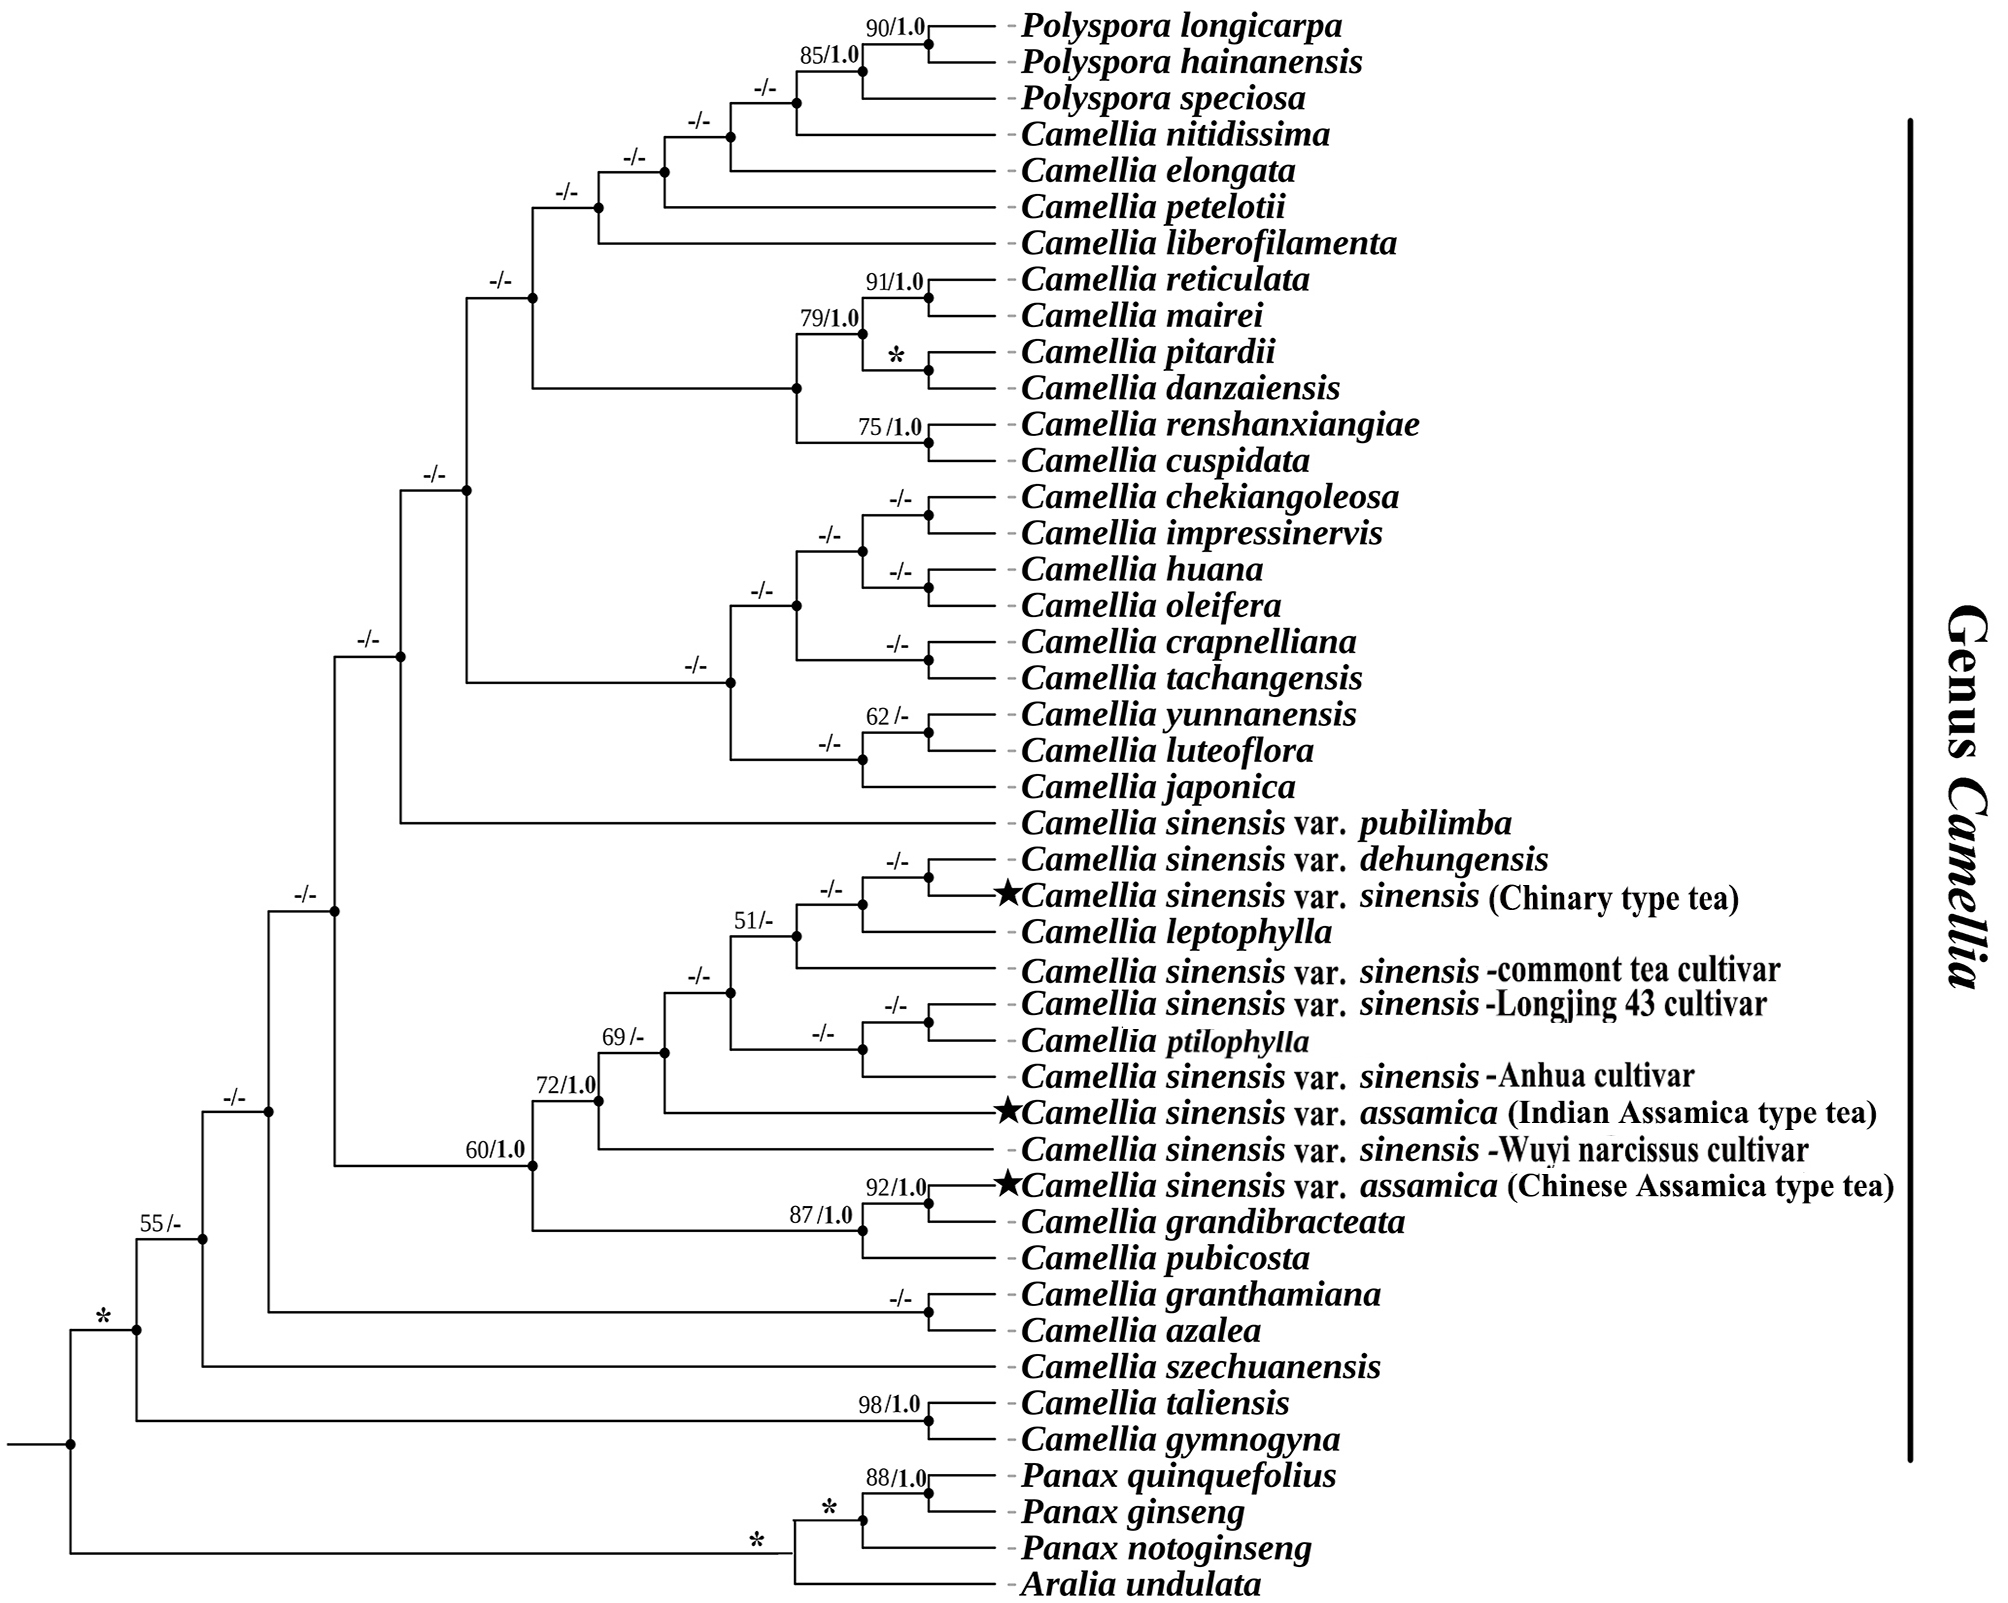
Excluding seven non-Camellia species, the sequence variation of the 37 Camellia species associated with the six datasets (Complete cp genome, LSC, SSC, IR, PCGs, and non-PCGs) showed different percentage variation (Supplementary Tab. S4). SSC had the highest percentage variation at 2.32%, followed by non-PCGs at 1.65%. The IR regions were least variable at 0.5%. The cp genome, LSC, and PCGs, were 1.3%, 1.54% and 1.21%, respectively. Phylogenetic trees based on six different data sets showed mostly similar topologies. A few individual species were retrieved incongruently among different clades across the six data partitions, but all Camellia species remained grouped separately, except IR regions that were shown to be mixed with Polyspora species of Theaceae. The support values of nodes increased significantly with the increasing of the sequence length in the different data partitions. In terms of interspecific relationships of three tea plants (Chinary type tea, Chinese Assamica type tea and Indian Assamica type tea), the results showed the same topology across all six datasets (Fig. 12-13, Supplementary Fig. S2-S6).
Estimated divergence time showed the three types of tea plant were diverged to each other during 0.8-6.2 million years ago (Mya) (CI: 0.3-8.1 Mya). Indian Assamica type tea diverged from the ancestor of Indian Assamica type tea and Chinese Assamica type tea about 6.2 Mya (CI: 4.4-8.1 Mya, Miocene), Chinese Assamica type tea diverged separately about 0.8 Mya (CI: 0.3-1.6 Mya, Quaternary), and Chinary type tea diverged separately from the ancestor of Indian Assamica type tea and Chinary type tea about 0.8 Mya (CI: 0.4-1.5 Mya, Quaternary) (Fig. 12).