Data collection
The gene expression data and corresponding clinicopathological characteristics (including age, gender, survival status, survival time, tumor grade, tumor stage, TNM stage.) of bladder cancer patients were downloaded from The Cancer Genome Atlas (TCGA) database (https://gdc-portal.nci.nih.gov/), which including 412 BLCA samples and 19 normal bladder samples. GSE13507 from Gene Expression Omnibus (GEO) database (https://www.ncbi.nlm.nih.gov/geo/) was downloaded as test cohort. Simple nucleotide variation (SNV) data was obtained from TCGA database, and tumor mutation burden (TMB) was defined as the total number of nonsynonymous alterations (SNVS or indels) for each patient.
Dentification of differentially Expressed HRGs and IRGs
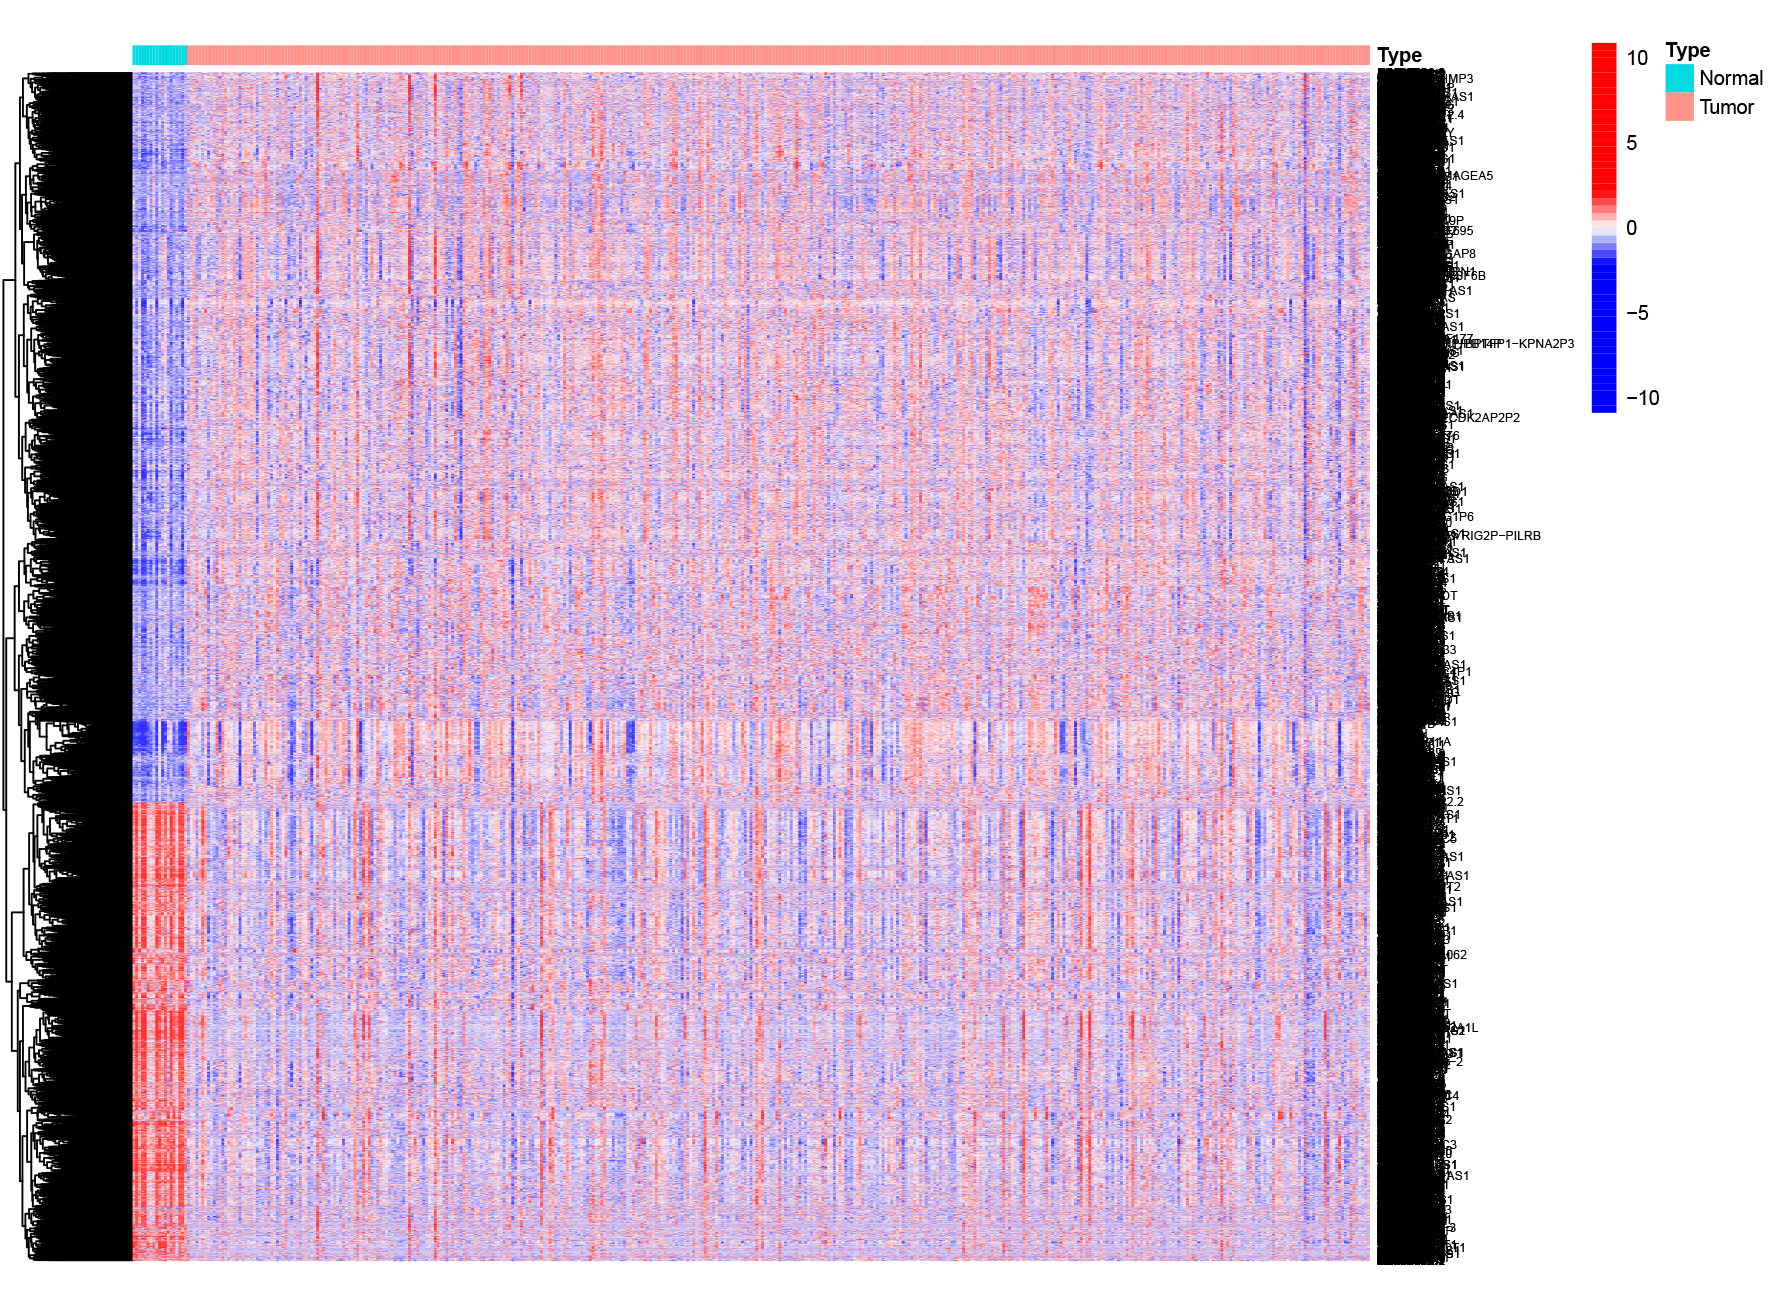
254 hypoxia-related genes were collected from GSEA database (http://www.gsea-msigdb.org/gsea)19,20. IMMPORT database (https://www.immport.org/home) was used to collect IRGs and 1794 IRGs were selected. “limma” R package was employed to identify the differentially expressed genes (DEGs) between tumor and normal samples with FDR < 0.05 and |logFC| > 1. These DEGs were visualized by heatmap and volcano plot. Venn diagrams were used to graphically describe the combination, intersection, and difference between DEGs, HRGs and IRGs21.
Pathway Enrichment Analysis
To better understand the pathways and bioactivities of these intersection genes, Kyoto Encyclopedia of Genes and Genomes (KEGG) was employed to analysis signaling pathways and Gene Ontology (GO) was used to analyze biologic processes, molecular functions, and cellular components through “clusterProfiler” R package. These analyses were aimed to determine whether the genes filtered for further investigation were indeed involved in hypoxia and immunity.
Construction of risk model based on intersection genes
First, we used univariate Cox regression analysis to identify the relationship between the expression of HRGs and IRGs and overall survival. Then the least absolute shrinkage and selection operator (LASSO) and multivariate Cox regression were used to determine the optimal prognostic factors of the model. After that, risk score model was calculated according to the following formula:
The Coef means the coefficient of each relevant mRNA in the risk model. Based on the median risk score, TCGA cohort and GEO cohort was divided into high-risk and low-risk groups while the TCGA cohort was defined as train cohort and GEO as test cohort.
Analysis and validation of risk model
Kaplan-Meier curves were plotted to illustrate the different OS between high- and low-risk groups in train and test cohorts via “survival” and “survminer” R packages. Patients’ survival status and survival time were also estimated. Besides, progression-free survival (PFS) between subgroups of BLCA patients in test cohort was plotted via Kaplan-Meier curves. Univariate and multivariate Cox regression were conducted to assess whether risk model could be regarded as independent risk parameter. Principal component analysis (PCA) were employed to the model feasibility and accuracy. The accuracy, sensitivity, and specificity of the model were estimated by the Receiver Operating Characteristic (ROC) curves.
Identification the association of risk score model and clinicopathological features
Heatmap was plotted by “pheatmap” R package to illustrate the relationship between eight genes’ expression and different clinicopathological features including risk, age, gender, stage, grade, T, N and M. Box plots illustrated the different risk score in different clinicopathological features.
Construction of nomogram
We constructed a nomogram survival model via“rms” R package to predict the 1-, 3- and 5-year survival probability. Calibration curves, ROC curves,univariate Cox and multivariate Cox analysis were employed to illustrate the high accuracy of nomogram.
Analysis of DEGs between subgroups
The different expressed genes (DEGs) between subgroups were identified with FDR < 0.05 and |log2FC|≥1. Gene set variation analysis (GSVA) by “GSVA”R package was used to estimate the functional enrichment pathways in two subgroups.
Estimation of the immune cell infiltration, immune microenvironment, and genetic alterations analysis
The immune microenvironment including stromal score (stromal content), immune score (degree of immune cell infiltration), ESTIMATE score (a composite marker of stroma and immunity) and tumor purity was illustrated by “estimate” R package. The immune cell infiltration between two groups were calculated by CIBERSORT and visualized in box plots. The coalition of different immune cell and OS were plotted through Kaplan-Meier curves. TMB was analyzed by the “maftools” R package. The survival probability of low-TMB and high-TMB patients in subgroups was also assessed.
Checkpoint estimation and immune therapy estimation
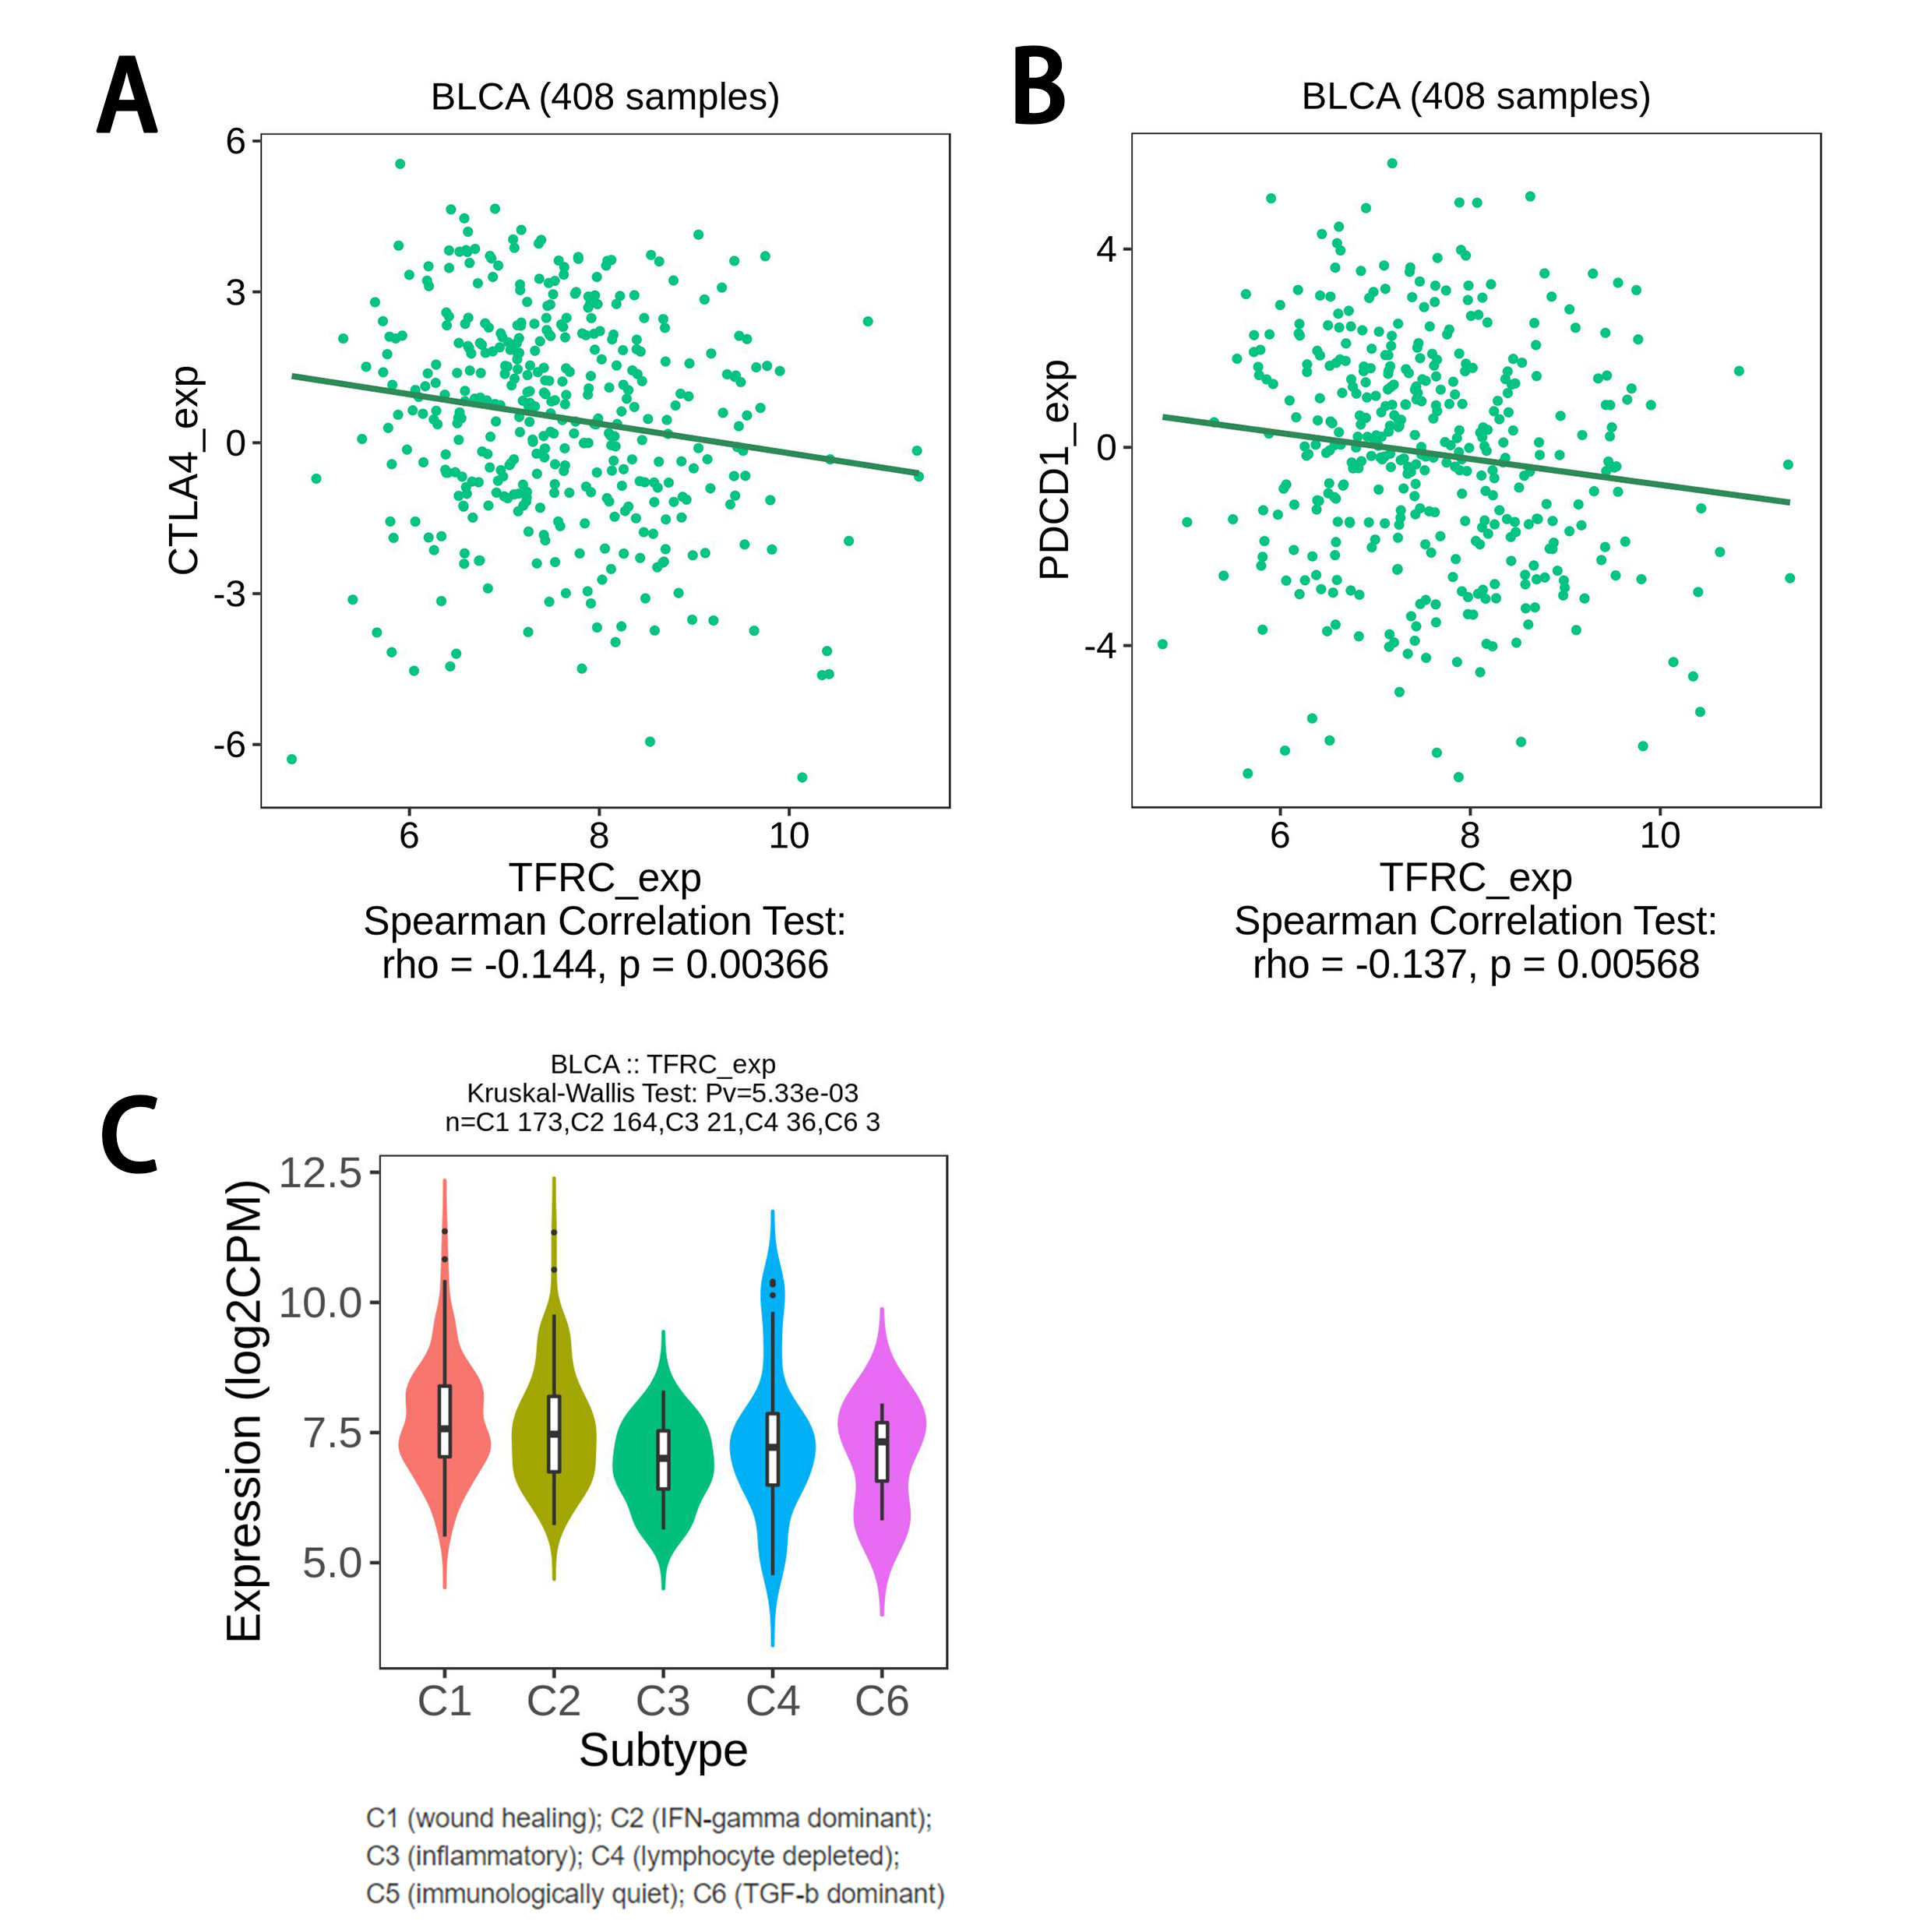
Immune-checkpoint between high-and low-risk groups was estimated. The expression of common checkpoint including CTLA4, PD-L1, PDCD1, LAG3 and HAVCR2 between two subgroups was investigated, and their coalition with risk score was also searched. Furthermore, the tumor immune dysfunction and exclusion (TIDE) algorithm was to conducted to determine response to immunotherapy in TCGA cohort. Then we used Cancer Immune Atlas (TCIA) database (http://tcia.at/) to obtain immunotherapy files of BLCA patients and further investigated the potential predictive roles of risk score in immunotherapy response in different treatments.
Potential drugs prediction
Furthermore, we calculated the chemotherapy sensitivity of each BLCA patient according to the Genomics of Drug Sensitivity in Cancer (GDSC) database. IC50 values for each chemotherapy drug were further determined by regression analysis. IC50 values for each drug was further determined and was compared between high-risk and low-risk groups via boxplots.
Cell lines and culture conditions
T24 and UMUC3 cells are acquired from Procell Life Science & Technology Co., Lt. T24 cells are cultured with RPMI-1640 medium supplemented with 10% FBS and 1% ABAM, while UMUC3 cells are cultured in the UM-UC-3 Cells Complete Medium. All cells were maintained at 37℃ in a humidified 5% CO2 incubator.
Edu assay
T24 and UMUC3 cells were seeded at a density of 4000cells/well into 96-well plates then transported with two independent siRNA targeting TFRC. After 48h, cells were added with EdU and continued incubating for another 2h. Then, the cells were fixed with a 4% paraformaldehyde solution for 30 min. The staining process was conducted in accordance with the manufacturer's instructions. Images were captured under microscope, and the number of positive cells was quantified utilizing imageJ software.
Wound healing assay
T24 and UMUC3 cells were seeded in 6-well plates in triplicates for each condition, two of which were treated with two independent si-TFRC. The cells were allowed to grow until full confluency was achieved. A 10 µL pipette was used to form a uniform size wound in the center of the cell monolayer for each condition, and a photograph was taken at 0 h. Cells were then observed for wound healing and photomicrograph at 48 h was taken under microscope.
Invasion assay
The cells were transfected with either control or siRNA and seeded on the Matrigel-coated PET membrane in the upper compartment. The lower compartment was filled with complete growth media and the plates were maintained at 37 °C for 24 h. Cells that migrated to the lower side of membrane were fixed and stained with crystal violet. The cells were then photographed using a light microscope and the number of cells were counted using ImageJ software.
Statistical analysis
All statistical analyses were used R software (Version 4.1.3). P<0.05 was served as the cutoff criterion.