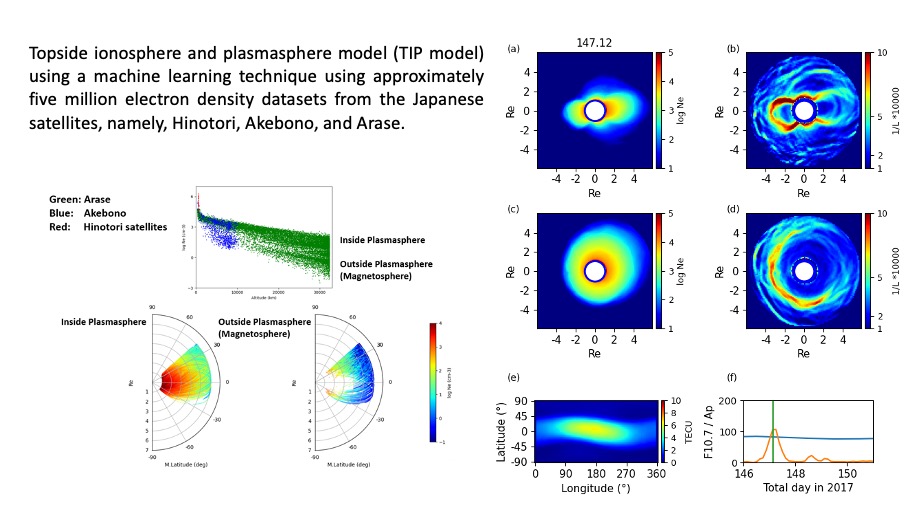
We developed a new topside ionosphere and plasmasphere model using a machine learning technique using approximately five million electron density datasets from the Japanese satellites, namely, Hinotori, Akebono, and Arase. The topside ionosphere and plasmasphere model (TIP-model) can estimate electron densities at altitudes ranging from 500 km to 30,000 km in terms of latitude, longitude, universal time, season, and solar and magnetic activities with time history. The model shows the time-dependent 3D structure of the plasmasphere in response to solar and magnetic activities. The constructed TIP-model reproduces plasmapause, plasma tail/erosion of the plasmasphere, and the plasma escape near the magnetic pole. The total electron content (TEC) in the plasmasphere was also obtained through the integration of electron density from 2,000 km to 30,000 km altitudes. The TEC of the plasmasphere is approximately 5 TECU near the magnetic equator, and it depends strongly on geomagnetic latitude, longitude, local time, and solar and magnetic activities.
Full paper
Modeling of Topside Ionosphere and Plasmasphere
https://doi.org/10.21203/rs.3.rs-380095/v1
This work is licensed under a CC BY 4.0 License
You are reading this latest preprint version
Topside Ionosphere
Plasmasphere
Modeling
Machine learning
Hinotori satellite
Akebono satellite
Arase satellite
The plasmasphere is an inner part of the Earth’s magnetosphere. Dense and cold plasmas (a few eV) are generated in the Earth’s ionosphere. Electrons in the ionosphere move along the Earth's magnetic field lines and those with energies larger than the escape energy can reach the inner magnetosphere; however, because ions are heavier, they cannot move to the inner magnetosphere. Therefore, an electric field develops in the region between the ionosphere and the inner magnetosphere. The ionospheric ions begin to move upward because of the generated electric field. The ionospheric electrons and ions move to the inner magnetosphere together. Light ions such as H+, He+, and O+ can easily escape from the ionosphere. During some hours and days, the escaping plasma accumulates until an equilibrium state is reached. The plasmasphere nearly rotates with the Earth. The region of the plasmasphere changes in size because of the geomagnetic activity, which causes a substantial loss of the plasmaspheric plasma and/or the refilling of the plasmasphere to occur during the geomagnetic active periods.
Whistler radio waves produced by lightning propagate along the Earth's magnetic field lines through the ionosphere, plasmasphere, and magnetosphere. The radio waves change frequencies during the propagation. Carpenter (1966) observed a sharp drop in frequency dispersion at approximately 3 Re, which is the plasmapause. The imager for magnetopause-to-aurora global exploration (IMAGE) satellite observed the resonance scattering of sunlight by He+ in the plasmasphere and captured images of the plasmasphere (Burch, 2000; Sandel et al., 2000). A tail on the plasmasphere, caused by plasmaspheric rotation and the electric fields generated by solar wind and magnetosphere interaction (Nishida, 1966), was also observed by the IMAGE satellite. The IMAGE satellite also showed the occurrence of interesting phenomena such as fingers, crenulations, channels, notches, shoulder, and shadow.
The plasma density gradient in the radial direction at the equator was estimated using ULF wave observations on the ground and satellite observations (Angerami and Carpenter, 1966; Denton et al., 2009; Sandhu et al., 2016). The plasma density gradient was estimated at 4–6 using the power-law model.
Plasmasphere models can either be based on satellite or ground-based observation data or are physical models. Carpenter and Anderson (1992) developed an empirical model of equatorial electron density in the range 2.25 < L < 8 using sweep frequency receiver radio measurements obtained by the international Sun-Earth explorer (ISEE) 1 satellite. The model shows the structures of the plasmasphere, plasmapause, and plasma trough for solar cycle variation. O'Brien and Moldwin (2003) developed an empirical model of the plasmapause location as a function of Kp, AE, and Dst using the combined release and radiation effects satellite (CRRES) observations. The global core plasma model (GCPM) is based on data from the dynamics explorer (DE) and ISEE satellites (Gallagher, 2000). The GCPM provides empirically derived plasma densities and ion compositions of H+, He+, and O+ as functions of geomagnetic and solar conditions. The GCPM also includes models for the plasmapause, trough, and polar cap. Plasma parameters below 2,000 km altitudes were calculated using the international reference ionosphere (IRI) (Bilitza et al., 2011). An electron temperature model at 1000–10,000 km altitudes was developed based on Akebono satellite measurements (Kutiev et al., 2004). The electron densities obtained from the upper hybrid resonance (UHR) frequency measured by the plasma wave and sounder (PWS) on the Akebono satellite were fitted to field-aligned electron density profiles using the sum of exponential and power-law functions (Kitamura et al., 2009). The transition height from O+ to H+ was found. The IMAGE model comes from radio plasma imager (RPI) measurements by the IMAGE satellite (Huang et al., 2004). The model provides a density distribution with L-value and latitude. The Institute of Terrestrial Magnetism, Ionosphere and Radio wave Propagation (IZMIRAN) model presents vertical profiles of electron density at altitudes of 1000–36,000 km based on whistler observations (Chasovitin et al., 1998). The global plasma ionosphere density model (GPID) is a physical model used to estimate the ion density and electron temperature in the plasmasphere along a magnetic flux tube (Webb and Essex, 2001). The model gives O+ and H+ densities and temperatures depending on solar and magnetic activities. The Sheffield university plasmasphere ionosphere model (SUPIM) estimates the densities, field-aligned fluxes and temperatures of O+, H+, He+, N2+, O2+, and NO+ ions, and electrons with time-dependent equations of continuity, momentum, and energy balance along eccentric-dipole magnetic field lines (Bailey et al., 1997). The field line interhemispheric plasma (FLIP) model solves the equations of continuity, momentum, and energy conservation for O+, H+, He+, and N+ ions along the inclined dipole geomagnetic field lines (Tu et al., 2003). A suprathermal ion mass spectrometer (SMS) on the Akebono satellite revealed ion heating and outflow in the polar region, which are important for the refilling of the plasmasphere (Watanabe et al., 1992; Abe et al., 1993).
A neural network was applied to build a plasmasphere model. Bortnik et al. (2016) developed a plasmasphere model that reconstructed the equatorial electron number density of the inner magnetosphere as a function of space and time from the electron number density estimated by three time history of events and macroscale interactions during substorms (THEMIS) probes between 2008 and 2014 and use the SYM-H index. The model shows the dynamics of plasmaspheric plume formation and corotation. Zhelavskaya et al. (2017) constructed a plasmasphere density distribution model with a neural network for the period from October 1, 2012 to July 1, 2016 using IMAGE/EUV data. The model showed the global evolution, erosion, and plume of the plasmasphere. Zheng et al. (2019) developed a three-dimensional solar wind-driven global dynamic plasmapause model using a neural network based on multi-satellite measurements with 37,859 plasmapause crossing events from January 4, 1995 to December 31, 2015. The model uses the parameters of solar wind speed, Bz of interplanetary magnetic field, SYM-H, and AE indices. The shape of the plasmapause was highly sensitive to these parameters as well as diurnal, seasonal, and annual variations.
Electron densities in the topside ionosphere and plasmasphere were estimated from the UHR emissions measured by the plasma wave experiments conducted by the Hinotori, Akebono, and Arase satellites. The Hinotori (ASTRO-A) satellite was launched by the M-3S rocket on February 21, 1981 at an approximately circular orbit of 600km and an inclination of 31°. The main objective of the Hinotori satellite is to study solar flares during the solar maximum. To investigate the ionospheric response to solar flares, a plasma electron density measurement instrument (IMP) and a plasma electron temperature measurement instrument (TEL) were installed on the Hinotori satellite (Oya et al., 1986, Oyama et al., 1996). The electron densities obtained by IMP were estimated from the measurements of UHR emissions from February 23, 1981 to June 19, 1982. The Akebono (EXOS-D) satellite is used to study the aurora and Earth's magnetosphere environment. It was launched by the M-3SII rocket on February 22, 1989 at an inclination of 75° with an initial perigee and apogee of 274 km and 10,500 km, respectively. Successful observations and operations were performed over 26 years. The plasma waves and sounder experiments (PWS), one of the installed instruments, has three subsystems: natural plasma wave observations (NPW), stimulated plasma wave experiments (SPW), and measurement of electron number density (NEI) (Oya et al., 1990). Accurate electron densities were obtained from the UHR measurements by PWS. The Arase (ERG) satellite was launched by the Epsilon rocket on December 20, 2016. The Arase satellite has apogee and perigee altitudes of ~32,000 km and ~440 km, respectively, and an inclination of 31°, and it stays in the radiation belts most of the time (Miyoshi et al., 2018a). The Arase satellite aims to elucidate the acceleration and loss mechanisms of relativistic electrons in the Earth’s radiation belts during geomagnetic disturbances. Electron densities are obtained from plasma wave measurements of high frequency analyzer (HFA) (Kumamoto et al., 2018) through a plasma wave experiment (PWE) conducted on the Arase satellite (Kasahara et al., 2018).
Figure 1 shows the electron density distributions obtained from the three satellites. Electron densities of more than five million datasets were obtained in the topside ionosphere and plasmasphere. The top panel of Figure 1 shows the electron density as a function of altitude. Green, blue, and red dots show the electron densities from the Arase, Akebono, and Hinotori satellites, respectively. Two different distributions were observed with different electron density gradients for altitude. The upper and lower parts of the electron density distribution with respect to altitude show densities inside and outside of the plasmasphere, respectively. The upper and lower parts of the electron density distributions are also plotted in the bottom two panels. These electron density datasets include the structures of the topside ionosphere, plasmasphere, plasmapause, and plasma tail. We used the electron density datasets to construct a topside ionosphere and plasmasphere model using machine learning (TIP-model).
Many structures such as equatorial density anomaly, plasma trough, plasma heating/outflow in the polar region, plasmapause, plasma tail, plasma erosion, plasma refilling, and so on are in the topside ionosphere and plasmasphere, and these phenomena are strongly dependent on geographic/geomagnetic latitude and longitude, local time and season, and solar and magnetic activities. The time history effects of the plasmasphere are important for building the plasmasphere model because the plasma refilling takes a few days to achieve the plasma density along a magnetic flux tube. Because the three satellites do not cover the whole plasmasphere in time and space, approximately five million electron density datasets from the three Japanese satellites are still insufficient to construct an empirical model of a time-dependent 3D ionosphere and plasmasphere.
A neural network combined with machine learning is a powerful technique for data modeling. We applied the neural network as a satellite in situ data interpolation method for building a time-dependent 3D topside ionosphere and plasmasphere model. The neural network model is shown in Figure 2. This model is a simple supervised model consisting of an input layer, nine hidden layers with 9216 nodes, and an output layer. The input parameters are universal time from January 1 (UT), geographic latitude and longitude, altitude, and 5 days solar flux (F10.7) and magnetic activity (Ap) indices. The output is electron density. Approximately five million datasets were divided into 1000 groups. The TIP-model, using machine learning, learns the data of each group repeatedly. Gaussian random noise with a 1% standard deviation was added to each dataset during the learning process. The method involving learning 1000 groups repeatedly and adding Gaussian random noise was useful in avoiding overfitting, which is a serious problem in building a plasmasphere model from the limited in situ satellite data. Of the approximately five million datasets, 0.017% of the datasets, which were not used for learning, were used as test datasets to validate the learning results. Figure 3 shows the comparison between the observed electron densities of the test data and the predicted electron densities obtained by the TIP-model. Red, blue and green dots indicate the observed/predicted electron densities from the Hinotori, Akebono, and Arase satellites, respectively. The standard deviation of the difference between the observed and the predicted data is 0.17 in the topside ionosphere, plasmasphere, and magnetosphere. The TIP-model constructs the plasmasphere using the median value of the inferred electron densities from the five training results.
Figure 4 shows the predicted electron density distributions in the plasmasphere on 146.38 total day in 2017. Figure 4 (a) shows the electron densities in the geographic meridian plane. Horizontal and vertical axes indicate day–night (dayside on the right) and north–south (northern pole on the top) directions, respectively. Figure 4 (c) shows the electron densities in the geographic equatorial plane in the altitude range of 500 km to 5 Re with day–night in the horizontal (dayside on the right) and dawn–dusk in the vertical (dusk on the top) directions, respectively. The electron density gradient in the radial direction was calculated using

Where n is the electron density, Ris the radial distance, and L is the characteristic electron density gradient length (km). Absolute value of the electron density gradients in the radial direction in the geographic meridional plane are shown in Figure 4 (b). The absolute value of electron density gradients in the radial direction in the geographic equatorial plane are shown in Figure 4 (d). Figure 4 (e) shows the total electron content (TEC) integrating the electron densities from 2,000 km to 30,000 km altitudes in the geographic latitude–longitude space. F10.7 (blue line) and Ap (orange line) indices from 146 to 151 total days in 2017 are shown in Figure (f). The green line indicates the time at which the plasmasphere was predicted. Because the magnetic activity was low for a few days, the plasmapause was outside of the satellite apogee. The electron density gradient associated with the plasmapause is not shown in Figure 4 (d). The density gradient increase before the morning may be a part of the plasmapause. The plasmasphere has day–night and dawn–dusk asymmetries in terms of the electron density distribution (see Figure 4 (b)). The TEC of the plasmasphere shows geomagnetic latitude and longitude and local time dependences. The TEC of the plasmasphere is high during the daytime of the low latitude region, with approximately 6 TECU on the magnetic equator. This value is approximately 10% or more of the TEC on the ground, which is obtained from the global navigation satellite system (GNSS).
On 147.12 total day in 2017, the magnetic activity increased and the Ap index reached 106. However, the solar activity did not change. F10.7 was 81. The plasmapause was clearly shown around 3 Re with the electron density decreasing from approximately 1,000 cm-3 (see Figure 5). The plasmapause moved to approximately 3 Re and the plasma’s escape to the magnetosphere occurred in the afternoon region. The electron density increased and the escape was also observed near the northern and southern magnetic poles (see Figure 5 (a) and (b)). The characteristic density gradient of plasmapause was less than 2000 km. The TEC of the plasmasphere increased to seven TECU near the equator in the dayside.
After 147.88 total day of magnetic activity increase, the small plasmasphere was still seen (Figure 6). The small plasmasphere continued for a couple of days after the magnetic activity increased. The tail of the plasmasphere moved from afternoon to evening because of corotation of the plasmasphere. The TEC of the plasmasphere was approximately 3 TECU near the magnetic equator on the dayside. On 149.00 total day, two days after the magnetic activity increase, a clear plasmapause was generated again (see Figure 7) because of the magnetic activity increase. Therefore, it is suggested that the generation of plasmapause depends strongly on both magnetic activity and the time history.
The IMAGE satellite found small-scale structures near the plasmapause such as fingers, crenulations, channels, notches, shoulder, and shadow (Sandel et al., 2000). Because the TIP-model reproduces the average electron density distribution of plasmasphere, it cannot predict small-scale density structures. However, the accuracy of the TIP-model depends on the number of observed datasets. The use of a large number of in situ satellite data will enable the TIP-model to reproduce small-scale density structures.
The TIP-model is the first to predict the time-dependent 3D electron density distribution of the plasmasphere based on the satellite in situ observation data. The TIP-model uses 5 days Ap and F10.7 indexes because of the time history of the plasmasphere. This is important for constructing the plasmasphere response to the magnetic activity. The TIP-model estimated the TEC in the plasmasphere for the first time. The TEC of the plasmasphere shows the magnetic latitude and longitude and local time dependences. The maximum TEC is near the magnetic equator on the dayside, and the TEC decreases during/after the geomagnetic active periods. The decrease continues for two to three days. We suggest that the TEC of the plasmasphere cannot be ignored for positioning using the GNSS.
Approximately five million electron density datasets measured by the Hinotori, Akebono, and Arase satellites were used to develop a time-dependent 3D topside ionosphere and plasmasphere model (TIP-model) using a machine learning technique for the first time. The TIP-model predicts the electron densities at altitudes ranging from 500 km to 30,000 km as a function of universal time from January 1, geographic latitude/longitude, and solar and magnetic activities with five-day histories. The TIP-model reproduces plasmapause, plasma tail/erosion of the plasmasphere, and plasma escape near the magnetic pole. The structure of the plasmasphere is strongly dependent on magnetic activity. The plasmapause moves to approximately 3 Re, and the plasma escape to the magnetosphere occurs in the afternoon region during the magnetic active period. The electron density enhancement and the escape occur near the northern and southern magnetic poles. The characteristic density gradient of the plasmapause is less than 2000 km. The TEC of the plasmasphere integrates the electron densities from 2,000 km to 30,000 km altitudes, it is ~5 TECU near the magnetic equator, and contributes to some extent to the TEC on the ground. The TEC depends strongly on the geomagnetic latitude, longitude, local time, and solar and magnetic activities.
Availability of data and materials
Data of the ERG (Arase) satellite is obtained from the ERG Science Center operated by ISAS/JAXA and ISEE/Nagoya University (http://ergsc.isee.nagoya-u.ac.jp).
Competing interests
No competing.
Funding
This work is supported by JAPS KAKENHI Grants 18K03726.
Authors' contributions
S. Watanabe: Data analyses and modeling
Y. Miyoshi: Development of database
F. Tsuchiya: Satellite observation and dataset construction
A. Kumamoto: Development of the instrument onboard satellite, satellite observation, and dataset construction
Y. Kasahara: Development of the instrument onboard satellite, satellite observation, and dataset construction
F. Matsuoka: Development of the instrument onboard satellite, satellite observation, and dataset construction
I. Shinohara: Satellite observation and dataset construction
Acknowledgements
This work was supported by JAPS KAKENHI Grants 18K03726. Science data of the ERG (Arase) satellite were obtained from the ERG Science Center operated by ISAS/JAXA and ISEE/Nagoya University (http://ergsc.isee.nagoya-u.ac.jp, Miyoshi et al., 2018b). The present study analyzed PWE/HFA Level03 v01.02 data and orbit Level-2 v02 (Miyoshi et al., 2018c). We would like to thank Editage (www.editage.com) for English language editing.
S.Watanabe thanks the collaboration research with Dr Yoshizumi Miyoshi, Dr Fuminori Tsuchiya, Dr Atsusi Kumamoto, Dr Yoshiya Kasahara, Dr Ayako Matsuoka, and Dr Iku Shinohara.
Acknowledgments
This work was supported by JAPS KAKENHI Grants 18K03726. Science data of the ERG (Arase) satellite were obtained from the ERG Science Center operated by ISAS/JAXA and ISEE/Nagoya University (http://ergsc.isee.nagoya-u.ac.jp, Miyoshi et al., 2018b). The present study analyzed PWE/HFA Level03 v01.02 data and orbit Level-2 v02 (Miyoshi et al., 2018c). We would like to thank Editage (www.editage.com) for English language editing.
- Abe, T., B.A. Whalen, A.W. Yau, S. Watanabe, E. Sagawa, K.I. Oyama, (1993) Altitude profile of the polar wind velocity and its relationship to ionospheric conditions, Geophys. Res. Lett., 20, 2825-2828.
- Bailey, G.A., N. Balan, Y.Z. Su, (1997) The Sheffield University plasmasphere ionosphere model—A review, J. Atmos. Terr. Phys., 59, 1541-1552.
- Bilitza, D., L. McKinnell, B. Reinisch, T. Fuller-Rowell, (2011) The international reference ionosphere today and in the future, J. Geod., 85, 909-920.
- Bortnik, J., W. Li, R. M. Thorne, V. Angelopoulos, (2016) A unified approach to inner magnetospheric state prediction, J. Geophys. Res. Space Physics, 121, 2423–2430, doi:10.1002/2015JA021733.
- Burch, J. L., (2000) IMAGE mission overview, Space Sci. Rev., 91, 1-14.
- Carpenter, D. L., R. R. Anderson, (1992) An ISEE/Whistler model of equatorial electron density in the magnetosphere, J. Geophys. Res., 97, 1097.
- Carpenter, D.L., (1966) Whistler studies of the plasmapause in the magnetosphere1. Temporal variations in the position of the knee and some evidence on plasma motions near the knee, J. Geophys. Res., 71, 693-709.
- Chasovitin, Yu.K., T.L. Gulyaeva, M.G Deminov, S.E. Ivanova, (1998) Russian, Standard model of ionosphere (SMI). In, RAL, UK, 161-172, COST251TD(98)005, 161-172.
- Gallagher, D. L., P. D. Craven, R. H. Comfort, (2000) Global core plasma model, J. Geophys. Res., Vol. 105, 18819-18833.
- Hedin, A. E., (1991) Extension of the MSIS thermospheric model into the middle and lower atmosphere, J. Geophys. Res. 96, 1159-1172.
- Huang, X, B. W. Reinisch, P. Song, J. L. Green, D. L. Gallagher, (2004) Developing an empirical density model of the plasmasphere using IMAGE/RPI observations, Adv. Space Res., 33, 829-832.
- Kasahara, Y., Y. Kasaba, H. Kojima, S. Yagitani, K. Ishisaka, A. Kumamoto, F. Tsuchiya, M. Ozaki, S. Matsuda, T. Imachi, Y. Miyoshi, M. Hikishima, Y. Katoh, M. Ota, M. Shoji, A. Matsuoka, I. Shinohara, (2018) The Plasma Wave Experiment (PWE) on board the Arase (ERG) satellite, Earth Planets Space, 70, 86, doi:10.1186/s40623-018-0842-4.
- Kitamura, N., A. Shinbori, Y. Nishimura, T. Ono, M. Iizima, and A. Kumamoto, (2009) Seasonal variations of the electron density distribution in the polar region during geomagnetically quiet periods near solar maximum, J. Geophys. Res., 114, A01206, doi:10.1029/2008JA013288.
- Kumamoto, A., F. Tsuchiya, Y. Kasahara, Y. Kasaba, H. Kojima, S. Yagitani, T. Imachi, M. Ozaki, S. Matsuda, M. Shoji, A. Matsuoka, Y. Katoh, Y. Miyoshi, I. Shinohara, (2018) High frequency analyzer (HFA) of plasma wave experiment (PWE) onboard the Arase spacecraft, Earth, Planets Space, 70:82, doi:10.1186/s40623-018-0854-0.
- Kutiev, I., K.-I. Oyama, S. Watanabe, T. Abe, A. Kumamoto, (2004) Plasmasphere electron temperature structures, Adv. Space Res., 34, 2010-2015.
- Miyoshi Y, Shinohara I, Takashima T, Asamura K, Higashio N, Mitani T, Kasahara S, Yokota S, Kazama Y, Wang S-Y, Tam SW, Ho, P.T.P, Kasahara, Y, Kasaba Y, Yagitani S, Matsuoka A, Kojima H, Katoh H, Shiokawa K, Seki, (2018a) Geospace Exploration Project ERG, Earth Planets Space, 70:101, doi:10.1186/s40623-018-0862-0.
- Miyoshi, Y., T. Hori, M. Shoji, M. Teramoto, T-F. Chang, T. Segawa, N. Umemura, S. Matsuda, S. Kurita, K. Keika, Y. Miyashita, K. Seki, Y. Tanaka, N. Nishitani, S. Kasahara, S. Yokota, A. Matsuoka, Y. Kasahara, K. Asamura, T. Takashima, and I. Shinohara, (2018b) The ERG Science Center, Earth, Planets, Space., 70:96, doi:10.1186/s40623-018-0867-8.
- Miyoshi, Y., I. Shinohara, C.-W. Jun, (2018c) The Level-2 orbit data of Exploration of energization and Radiation in Geospace (ERG) Arase satellite. ERG science Center. https://doi.org/10.34515/DATA.ERG-12000.
- Nishida, A., (1966) Formation of plasmapause, or magnetospheric plasma knee, by the combined action of magnetospheric convection and plasma escape from the tail, J. Geophys. Res., 71, 5669–5679, doi:10.1029/JZ071i023p05669.
- O’Brien, T. P., M. B. Moldwin, (2003) Empirical plasmapause models from magnetic indices, Geophys. Res. Lett., 30, 1152, doi:10.1029/2002GL016007.
- Oya, H., T. Takahashi, S. Watanabe, (1986) Observation of low latitude ionosphere by the impedance probe on board the Hinotori satellite, J. Geomagn. Geoelectr., 38, 111-123.
- Oya, H, A. Morioka, K. Kobayashi, M. Iizima, T. Ono, H. Miyaoka, T. Okada, T. Obara, (1990) Plasma wave observation and sounder experiments (PWS) using the Akebono (EXOS-D) satellite - Instrumentation and initial results including discovery of the high altitude equatorial plasma turbulence, J. Geomagn. Geoelectr., 42, 411-442, doi:10.5636/jgg.42.411.
- Oyama, K.-I., S. Watanabe, Y. Su, T. Takahashi, K. Hirao,(1996) Season, local time, and longitude variations of electron temperature at the height of ~600 km in the low latitude region, Adv. Space Res., 18, 269-278.
- Scherliess, L., and B. G. Fejer, (1999) Radar and satellite global equatorial F region vertical drift model, J. Geophys. Res., 104, 6829-6842.
- Sandel, B. R., et al., (2000) The extreme ultraviolet imager investigation for the IMAGE mission, Space Sci. Rev., 91, 197–242.
- Volland, H., (1973) A semiempirical model of large-scale magnetospheric electric fields, J. Geophys. Res., 78, 171-180.
- Watanabe, S., B.A. Whalen, A.W. Yau, (1992) Thermal ion observations of depletion and refilling in the plasmaspheric trough, J. Geophys. Res., 97, 1081-1096.
- Webb, P.A., E.A. Essex, (2001) A dynamic diffusive equilibrium model of the ion densities along plasmaspheric magnetic flux tubes, J. Atmos. Sol-Terr. Phys. 63, 1249-1260.
- Zhelavskaya, I.S., Y.Y. Shprits, M. Spasojevi, (2017) Empirical modeling of the plasmasphere dynamics using neural networks, J. Geophy. Res. Space Physics, 122, 11227–11244, https://doi.org/10.1002/2017JA024406.
- Zheng, Z., J. Lei, X. Yue, X. Zhang, F. He, (2019) Development of a 3-D plasmapause model with a back-propagation neural network, Space Weather, 17, 1689-1703, https://doi.org/10.1029/2019SW002360.