1.1 Pan-cancer analysis
We retrieved RNA-sequencing expression profiles at level 3 and associated clinical data for different cancer types from the Cancer Genome Atlas (TCGA) database, accessible via the website https://portal.gdc.com. Subsequent statistical analysis was carried out using R version 4.0.3 software, provided by the R Foundation for Statistical Computing, based in Vienna, Austria, with a significance threshold set at P-value < 0.05.
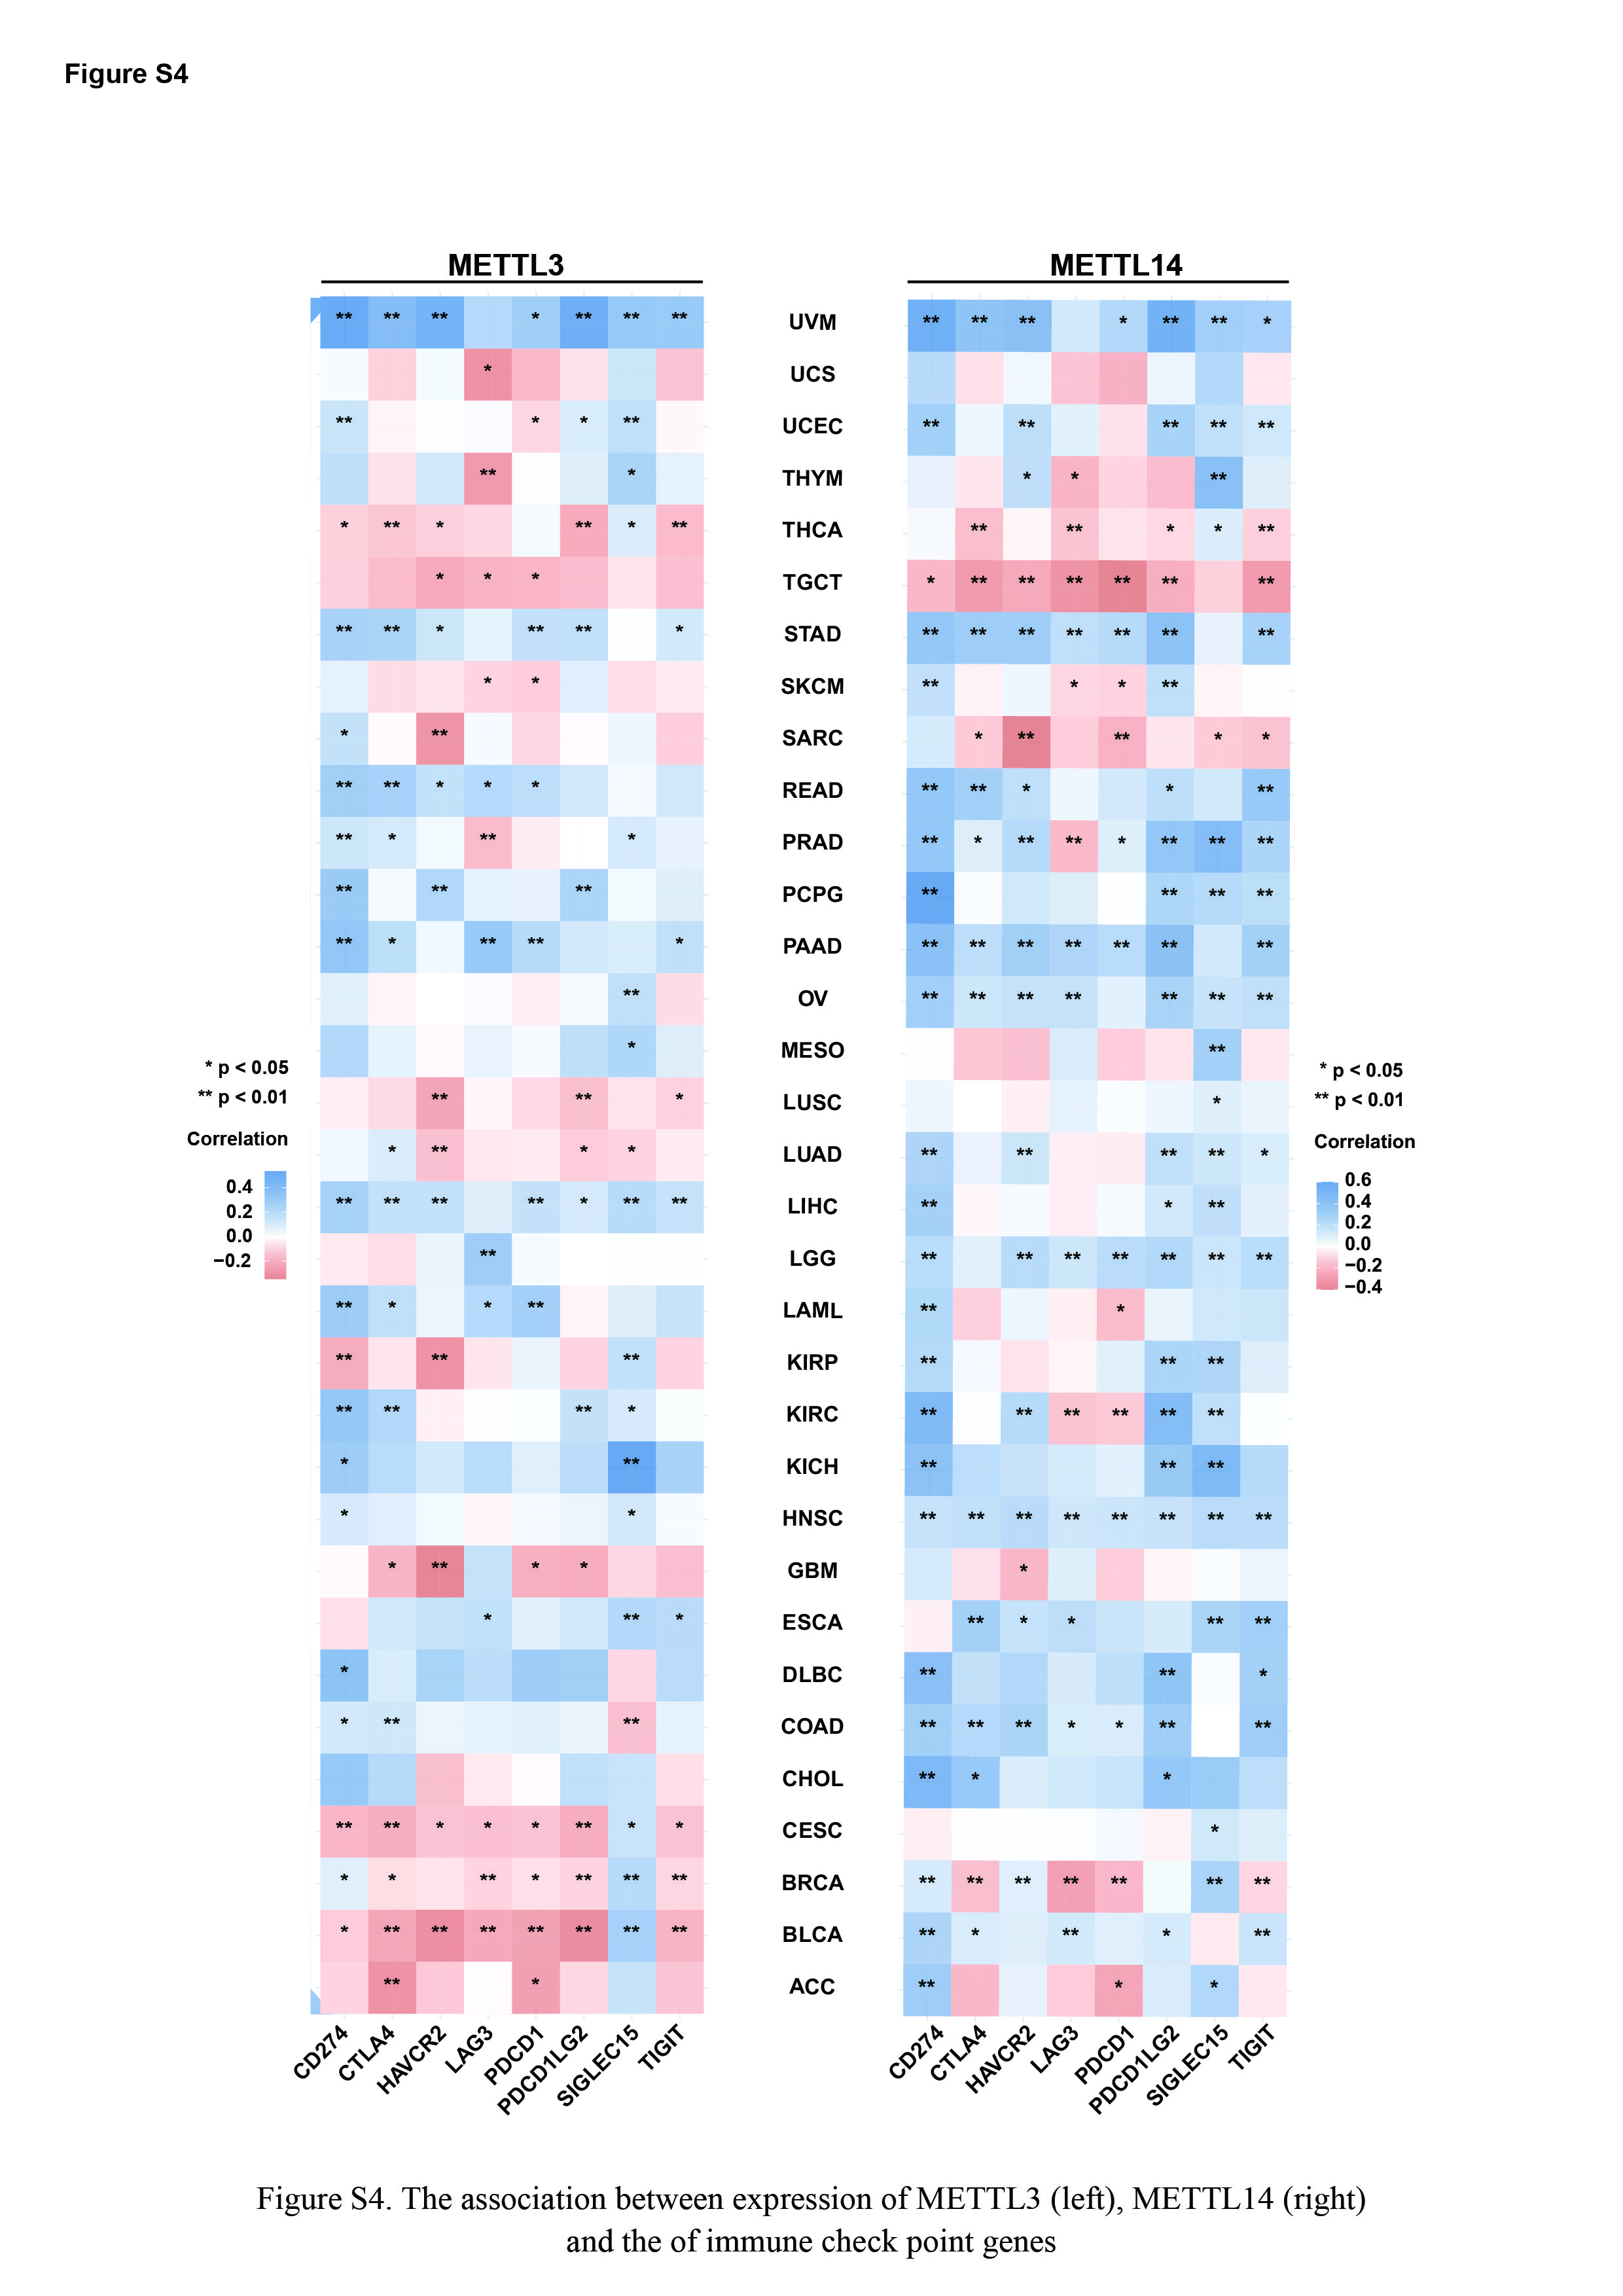
For the purpose of evaluating correlations with immune checkpoints, we identified a panel of genes comprising SIGLEC15, TIGIT, CD274, HAVCR2, PDCD1, CTLA4, LAG3, and PDCD1LG2 as markers relevant to immune checkpoint mechanisms. We then isolated the expression data for these eight genes from the dataset.
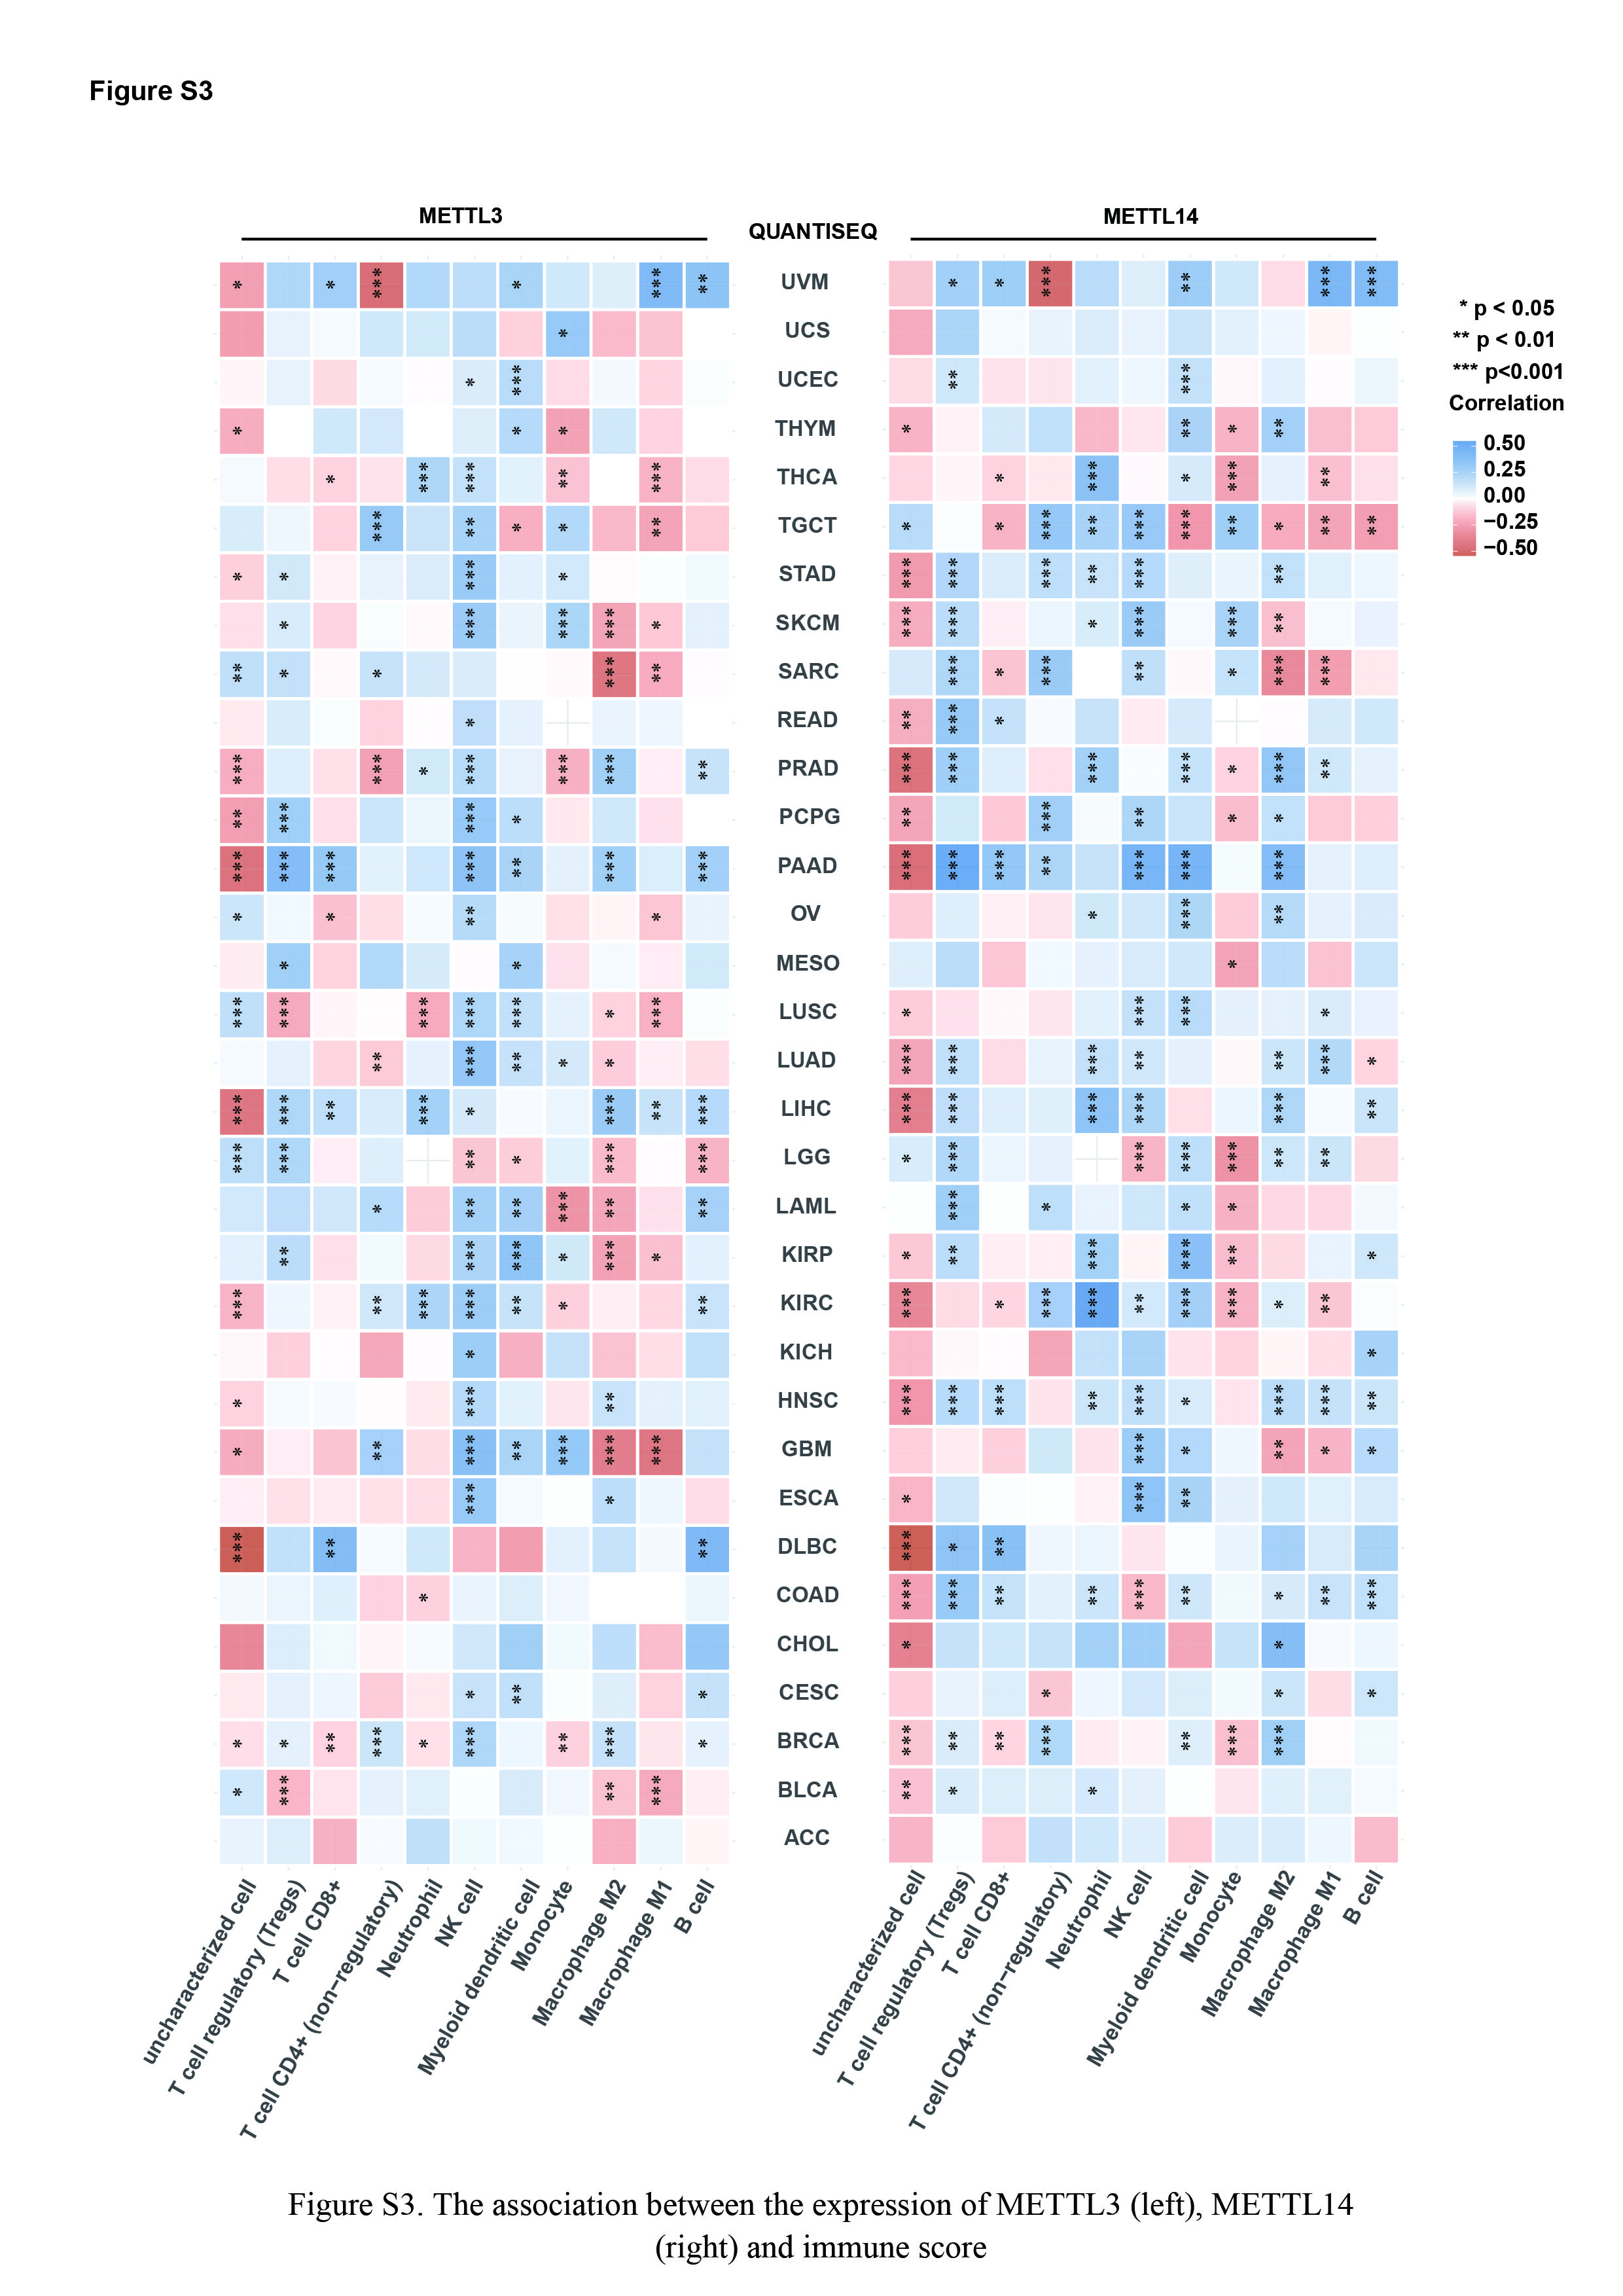
To calculate the immune cell score, we employed the immuneeconv package within the R programming environment. This package is specifically designed to provide reliable assessments of immune scoring, combining the strengths of six state-of-the-art algorithms, namely TIMER, xCell, MCP-counter, CIBERSORT, EPIC, and quanTIseq. Each of these algorithms has been rigorously benchmarked and offers its own unique advantages for analyzing the tumor microenvironment.
All the analyses and implementations of the aforementioned methods were conducted using R version 4.0.3, which is supported by the R Foundation for Statistical Computing (2020). We utilized the ggplot2 package for creating clear and concise graphics, and the pheatmap package for generating informative heatmaps to visualize our data.
1.2 Correlation map
We applied Spearman’s correlation analysis to quantify the relationship between non-normally distributed quantitative variables. For determining statistical significance, we adopted a P-value cutoff of less than 0.05, with results achieving *P < 0.05 being considered statistically noteworthy.
1.3 Pathways clustering
The clustering analysis were performed at Metascape (https://metascape.org/)(Zhou et al., 2019).
1.4 Transfection
The EC109 cells utilized in the experiments were obtained from the Cell Resource Center, Peking Union Medical College (PCRC). The cells were cultured in high-glucose DMEM medium, incubated at 37 degrees Celsius in a 5% CO2 incubator, with the medium containing 10% serum. Lentiviral vector targeting METTL3 and METTL14 were purchased from Bocui technology (Shanxi China). The plasmid pLKO.1-U6-EF1a-mcherry(copGFP)-T2A-Neo(puro) were was constructed to knockdown the expression of the target gene. After virus infection, G418 or puromycin is used for selection. The sh-RNA sequence used for knockdown is as follows:
sh-METTL14-1: AAGGATGAGTTAATAGCTAAACTCGAGTTTAGCTATTAACTCATCCTT
sh-METTL14-2:
TGGTGCCGTGTTAAATAGCAACTCGAGTTGCTATTTAACACGGCACCA
sh-METTL3-1: CTGCAAGTATGTTCACTATGACTCGAGTCATAGTGAACATACTTGCAG
sh-METTL3-2:
AGGAGCCAGCCAAGAAATCAACTCGAGTTGATTTCTTGGCTGGCTCCT
1.5 Western blot
To isolate total protein from esophageal carcinoma cells, RIPA lysis buffer (Beyotime, Shanghai, China) was utilized. Following the extraction process, the membranes were washed six times with TBST for five minutes each. Subsequently, they were incubated with HRP-conjugated secondary antibodies specific to rabbit or mouse IgG at a dilution of 1:5000, at 4°C for a 12-hour period. Protein levels were detected using the ChemiDOC™ XRS + imaging system (Bio-Rad). For quantification of protein bands, Olympus Image-Pro Plus software was employed. The immunoblots were captured digitally using said imaging equipment. The antibodies applied in the western blot analysis included: anti-METTL3 (Abcam, ab195352), anti-METTL14 (Abcam, ab300104), anti-beta-actin (Abcam, ab8226), Goat Anti-Rabbit IgG H&L (HRP) (Abcam, ab205718), and Goat Anti-Mouse IgG H&L (HRP) (Abcam, ab205719).
1.6 Clonal formation assay
EC109 cells underwent an initial trypsinization process, followed by cell counting. Then, 1000 cells were seeded into each well of a 6-well plate. These cells were cultured in a humidified incubator set at 37℃ with 5% CO2 for a duration of 10 days, which allowed for colony formation. After the colonies had formed, we discarded the culture medium and gently washed the cells with PBS. For fixation, formaldehyde was applied, after which the cells were stained using crystal violet solution (Sangon Biotech, E607309) to visualize the colonies.
1.7 Tumor-bearing mouse models
The conduct of mouse-related experiments was approved by the animal ethics committee at Changzhi Medical College, ensuring adherence to all pertinent guidelines and regulations. We ensured compliance with the ARRIVE guidelines throughout the execution of mouse experiments. All mice were housed in specific pathogen-free conditions, with regulations on temperature and humidity maintained, alongside a consistent 12-hour light/dark cycle. Mice consumed soya-free laboratory chow and had access to tap water ad libitum. EC109 cells were subcutaneously injected into the left flank of 5-week-old female BALB/c nude mice. Subsequent to the injection, tumor size and survival rate were monitored bi-daily. Once the tumors attained a volume of 300 mm^3, the animals were humanely euthanized through CO2 inhalation in concordance with ethical practices.
1.6 Apoptosis analysis
Cells undergoing routine culture were digested with EDTA-free trypsin to dissociate them into a single cell suspension after reaching confluence. The detached cells were then suspended in PBS, and subsequently stained with Annexin V-FITC and propidium iodide (PI) (Beyotime, C1062S) for apoptosis analysis. This staining procedure took place in a dark environment for 20 minutes to prevent photobleaching of the fluorescent dyes. Immediately following the incubation period, the stained cells were analyzed using a flow cytometer for apoptosis detection.
1.8 mRNA-seq
Total RNA was extracted employing the Trizol reagent (Thermo Fisher) in strict accordance with the instructions provided by the manufacturer. The isolated RNA was then utilized to construct an RNA-seq library using the NEBNext® Ultra™ II Directional RNA Library Prep Kit for Illumina (NEB). Sequencing was performed for both non-immunoprecipitated (initial sample) and m6A-immunoprecipitated RNA (m6A IP sample), involving 150 bp paired-end sequencing on the Illumina HiSeq platform. The sequencing data obtained was of high quality, with a Q30 score assessment conducted to ensure reliability. Trimming of 3’ adaptors and removal of low-quality reads were executed using cutadapt software (version 1.9.3). Cleaned reads were aligned to the reference human genome (UCSC HG19) with the aid of the Hisat2 software (version 2.0.4).
1.9 Immunofluorescence staining
SCC cells were cultured on coverslips, washed with PBS, and fixed with 4% paraformaldehyde. Post-fixation, they were blocked with bovine serum albumin for 60 minutes and incubated with anti-METTL14 and anti-METTL3 antibodies overnight at 4°C. Following three PBS washes, cells were incubated for 60 minutes with Alexa Fluor® 488-conjugated goat anti-rabbit IgG (Abcam, ab150077, 1:1000) and Alexa Fluor® 594-conjugated goat anti-mouse IgG (Abcam, ab150116, 1:1000). After mounting with Sigma’s mounting medium (F6057), cells were observed under an Olympus IX73 microscope. ESCC tissue microarrays were purchased from Shanghai Outdo Biotech in Shanghai, China (HEsoS060CS01). Experiments using human samples have been approved by the Human Ethics Committee.
1.10 LC-MS/MS Analysis
The phosphoproteomic study was conducted using a Thermo Fisher Scientific Easy nLC 1200 system, paired with a Q Exactive HF-X mass spectrometer. Phosphopeptides were loaded onto a custom-packed column with buffer A and eluted over a 110-minute period at a flow rate of 300 nL/min, utilizing a linear increase of buffer B covering 2–40%. Mass spectra were collected in a range from m/z 350 to m/z 1800, at a resolution of 60,000 at m/z 200, and a maximum injection time of 50 ms per scan. The top 15 most intense precursor ions from the MS scan were selected for higher-energy collisional dissociation (HCD) MS/MS with an isolation window of 1.6 Th, dynamic exclusion for 30 seconds, and a resolution of 15,000 at m/z 200.
1.11 Statistics
In this study, comparisons between two groups were conducted using Student’s t-test, and comparisons among multiple groups were performed via one-way ANOVA. The results are presented as mean ± standard deviation.
1.12 Statement
All methods were carried out in accordance with relevant guidelines and regulations. All experimental protocols were approved by Changzhi medical college licensing committee. We confirm that informed consent was obtained from all subjects and/or their legal guardians.