The protocol for the present study was preregistered in the International Prospective Register of Systematic Reviews (PROSPERO) (#CRD42023467670) [24]. The present study deviates from the protocol in the following ways: a) due to an existing systematic review on healthcare workers, physicians were no longer included as a population of interest, and b) due to a lack of studies, compassion fatigue was not included as a focus of this review. The review was conducted in accordance with the guidelines for Meta-Analysis Of Observational Studies in Epidemiology (MOOSE) [25] and is reported in line with the Preferred Reporting Items for Systematic Reviews and Meta-Analyses (PRISMA) guidelines [26].
2.1 Search strategy and selection criteria
A comprehensive literature search was conducted on September 22, 2023 as per protocol, with an updated search conducted on January 10, 2024. The updated search only included medical students because physicians were no longer a population of interest. No publication date restrictions were applied. The electronic databases searched were: PubMed, EMBASE, CINAHL, The Cochrane Library, and PsycINFO. Where possible, relevant MeSH (Medical Subject Headings) terms or MeSH term equivalents were included in each database search. The specific search terms were: medical student* AND empathy AND burnout.
The study inclusion criteria were guided by the PICO (Population, Intervention/Exposure, Comparator, Outcome) approach [27]. Population: Medical students; Exposure: Medical school; Comparator: N/A; Outcome: Empathy and burnout assessed with a standardized, validated measurement scale.
We included correlational studies, including cross-sectional and longitudinal, prospective survey-based studies. Furthermore, only English-language papers published in peer-reviewed journals were considered eligible. We excluded randomized controlled trials, qualitative studies, case studies, open trials, uncontrolled trials, reviews and study protocols. Grey literature, for example, conference abstracts, trial registrations, dissertations and studies with N<10 were also not considered eligible.
The literature search and data extraction were conducted using the Covidence systematic review software [28]. In the first round of screening, PC and AEI independently screened the title and abstract of all identified references and excluded ineligible studies. In the second round of screening, the full-text of the remaining studies were evaluated independently by PC and AEI and reasons for exclusion were registered. After each screening, the two authors discussed discrepancies, and reached a negotiated decision. Uncertainties and disagreements were discussed with the last author (RZ).
2.2 Quality assessment
A methodological quality assessment was undertaken independently by two authors (PC and AEI) for all included studies, using the National Institutes of Health Quality Assessment Tool for Observational Cohort and Cross-Sectional Studies [29]. The quality terms included whether the studies had a clearly defined research question and study population, whether the participation rate of eligible participants was at least 50%, whether the subjects were recruited from the same or similar populations, whether inclusion and exclusion criteria were used for all participants, whether a sample size justification such as a power description was provided, and if key confounding variables were measured and adjusted for statistically, among other questions.
2.3 Data extraction
Data extraction was performed independently by two authors (PC and AEI) and included authors, publication year, empathy aspect (cognitive, affective or behavioral), burnout dimension (emotional exhaustion, depersonalization or personal accomplishment), correlation statistic (Pearson's r, Spearman's ρ, or standardized β values) , sample size, effect direction, whether the correlation was adjusted for other covariates (yes or no), number of covariates, study design (cross-sectional or longitudinal), response rate (as percentage), whether the relationship between empathy and burnout in medical students was the primary focus of the study (yes or no), sampling method (convenience, random), sample mean age, gender of participants (percent women), country, region (e.g., North America, Middle East, Europe, Asia), study level (early, late, or mixed), empathy scale, empathy subscale, burnout scale and burnout subscale. A meta-analysis was conducted when a minimum of three studies assessing an association between an empathy and a burnout dimension were available.
2.4 Categorization of empathy and burnout data
Empathy in the context of medical education is a multidimensional construct that encompasses cognitive, emotional, and behavioral components [12]. Cognitive empathy refers to the ability to understand the thoughts and perspectives of others, emotional empathy involves feeling and sharing the emotions of others, and behavioral empathy entails demonstrating empathetic behaviors, such as active listening and providing emotional support [30]. In the caring professions, 11 empathy measurement tools are available [31]. In order to make a meta-analysis possible and reduce the complexity of the findings, all empathy questionnaires were categorized as measuring either cognitive, affective or behavioral empathy. The study characteristics table (Table 1) provides the measurement tool used in each study and the empathy aspect it was categorized as by the authors.
Burnout among medical students is usually conceptualized within the framework of the Maslach Burnout Inventory (MBI), which identifies three key dimensions: emotional exhaustion, depersonalization, and reduced personal accomplishment [1]. Emotional exhaustion refers to feelings of fatigue and emotional depletion, depersonalization involves cynicism and detachment from patients, and reduced personal accomplishment reflects a diminished sense of personal achievement and competence [1]. However, at least four other measurement tools for occupational burnout exist [32] with various dimensions, broadly aligning with the three dimensions of the MBI. All burnout questionnaires were categorized as measuring either emotional exhaustion, depersonalization or personal accomplishment. The study characteristics table (Table 1) provides the measurement tool used in each study and the burnout dimensions it was categorized as covering.
The three dimensions of burnout have different directions. For emotional exhaustion and depersonalization, greater scores signify greater burnout. For personal accomplishment, higher scores indicate less burnout. Therefore, when examining the association between global empathy and global burnout, correlations between empathy and personal accomplishment were reverse scored. When calculating the associations between the specific aspects of empathy and the various dimensions of burnout, personal accomplishment was not reverse scored.
2.4 Meta-analytic strategy
The effect size correlation (ESr) was used as the standardized effect size for the association between empathy and burnout. If correlations were not reported directly, ESr was converted from other data, for example, differences between means and standard deviations, regression coefficients, numbers or rates of study participants in relevant groups, χ², F, or t statistics using various formulas. The calculations were conducted independently by two authors (PC and AEI) and checked by a third author (RZ) in case of disagreement. In case of missing data from the published report, the data was requested from the authors.
Effect sizes were calculated for both the unadjusted bivariate associations and the associations found in multivariate analyses adjusted for other covariates. Correlations between global empathy and global burnout were operationalized as the averaged correlations across the various individual dimensions for each study. The ESr was also used as a standardized effect size for the association between the different aspects of empathy (cognitive, affective and behavioural) and the dimensions of burnout (emotional exhaustion, depersonalization and personal accomplishment). The pooled effect size (ESr) and its 95% confidence interval was calculated using a random effects model. Heterogeneity was explored by calculating the I² statistic. The I2 statistic is an estimate of the variance in a pooled ES that is accounted for by heterogeneity, i.e., true differences between effect sizes rather than sampling error [33]. We also calculated Tau (T), which represents the standard deviation of the true effect sizes, and the 95% prediction interval. The prediction interval takes both the random error and the systematic variance into consideration and quantifies the distribution of the ESs, indicating the range that 95% of results of future studies (from the same family of studies) are expected to fall within [34].
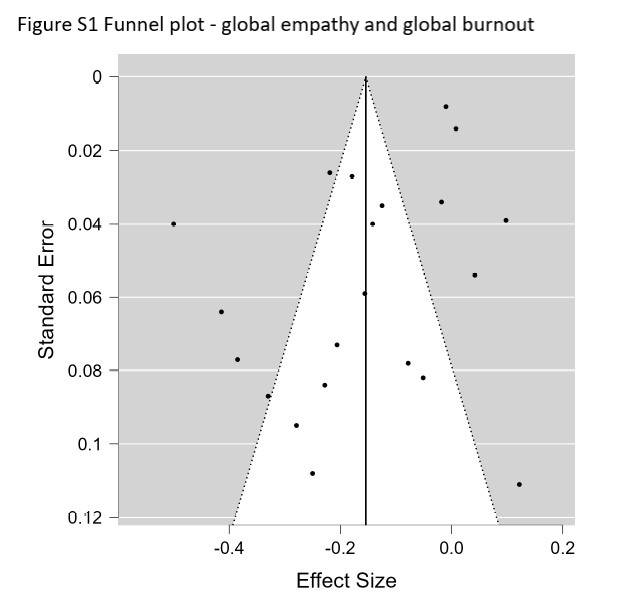
Publication bias, i.e., the tendency for statistically significant findings in the hypothesized direction to be more likely to be published, is a widespread problem in meta-analyses [35]. Although publication bias may be less likely in correlational than effect studies, we explored the possibility of using funnel plots and Egger's tests [36], but only when K > 10 (K = number of studies) [35]. If the results were suggestive of possible publication bias, we planned a sensitivity analysis adjusting the effect sizes using the Duval and Tweedie trim-and-fill method [37].
Possible sources of heterogeneity were explored with moderator analyses. When data were available for 10 independent samples or more, the possible influence of both continuous moderators (i.e., mean sample age, percent of women in the sample, response rate) and dichotomous moderators (i.e., student study level (late vs. early) and study quality (good or fair vs. poor)) were analyzed with meta-regression (computational model: maximum likelihood). For dichotomous moderators, the variable had to show sufficient variability, i.e. K > 3 in the smallest category. The R2 equivalent was calculated for moderators reaching statistical significance.
All analyses were conducted using Comprehensive Meta-Analysis v4 [38] and various formulas in Microsoft Excel.
2.5. Supplementary Bayesian analyses
To aid the interpretation of the results, a Bayesian Model-Averaged meta-analysis [39] was conducted. The procedure examines the results of four models: a) Fixed-effect null hypothesis (fH0), b) fixed-effect alternative hypothesis (fH1), c) random-effects null hypothesis (rH0), and d) random effects alternative hypothesis (rH1). Bayesian Model-Averaged analysis thus avoids selecting either a fixed- or random-effects model and addresses two questions considering the observed data: What is the plausibility that the overall effect is non-zero and the ES are heterogeneous? An uninformed prior probability was chosen, i.e., 25%, of each of the four models, and 2000 iterations were used. With regard to parameter distributions, previously recommended defaults were chosen [39]. Thus, a zero-centered Cauchy prior with a scale of 0.707 for the ES was used. For the between-study variation, an empirically informed prior distribution on non-zero between-study deviation estimates based on standardized mean difference ESs from 705 meta-analyses published in Psychological Bulletin between 1990 and 2013 was used [40]. This distribution has been approximated by an Inverse-Gamma (1, 0.15) prior on the standard deviation (Tau) [39]. For each analysis, we calculated the Bayes Factor (BF) [41], which represents the posterior probability of the alternative hypothesis (H1) relative to the probability of the null hypothesis. Based on the BF, the strength of the evidence was then categorized as "weak", “moderate”, “strong”, “very strong”, and “decisive” [42]. The Bayesian analyses were conducted with the computer software JASP (Version 0.17.1) [43].