Characteristics of elderly and non-elderly NAFLD patients
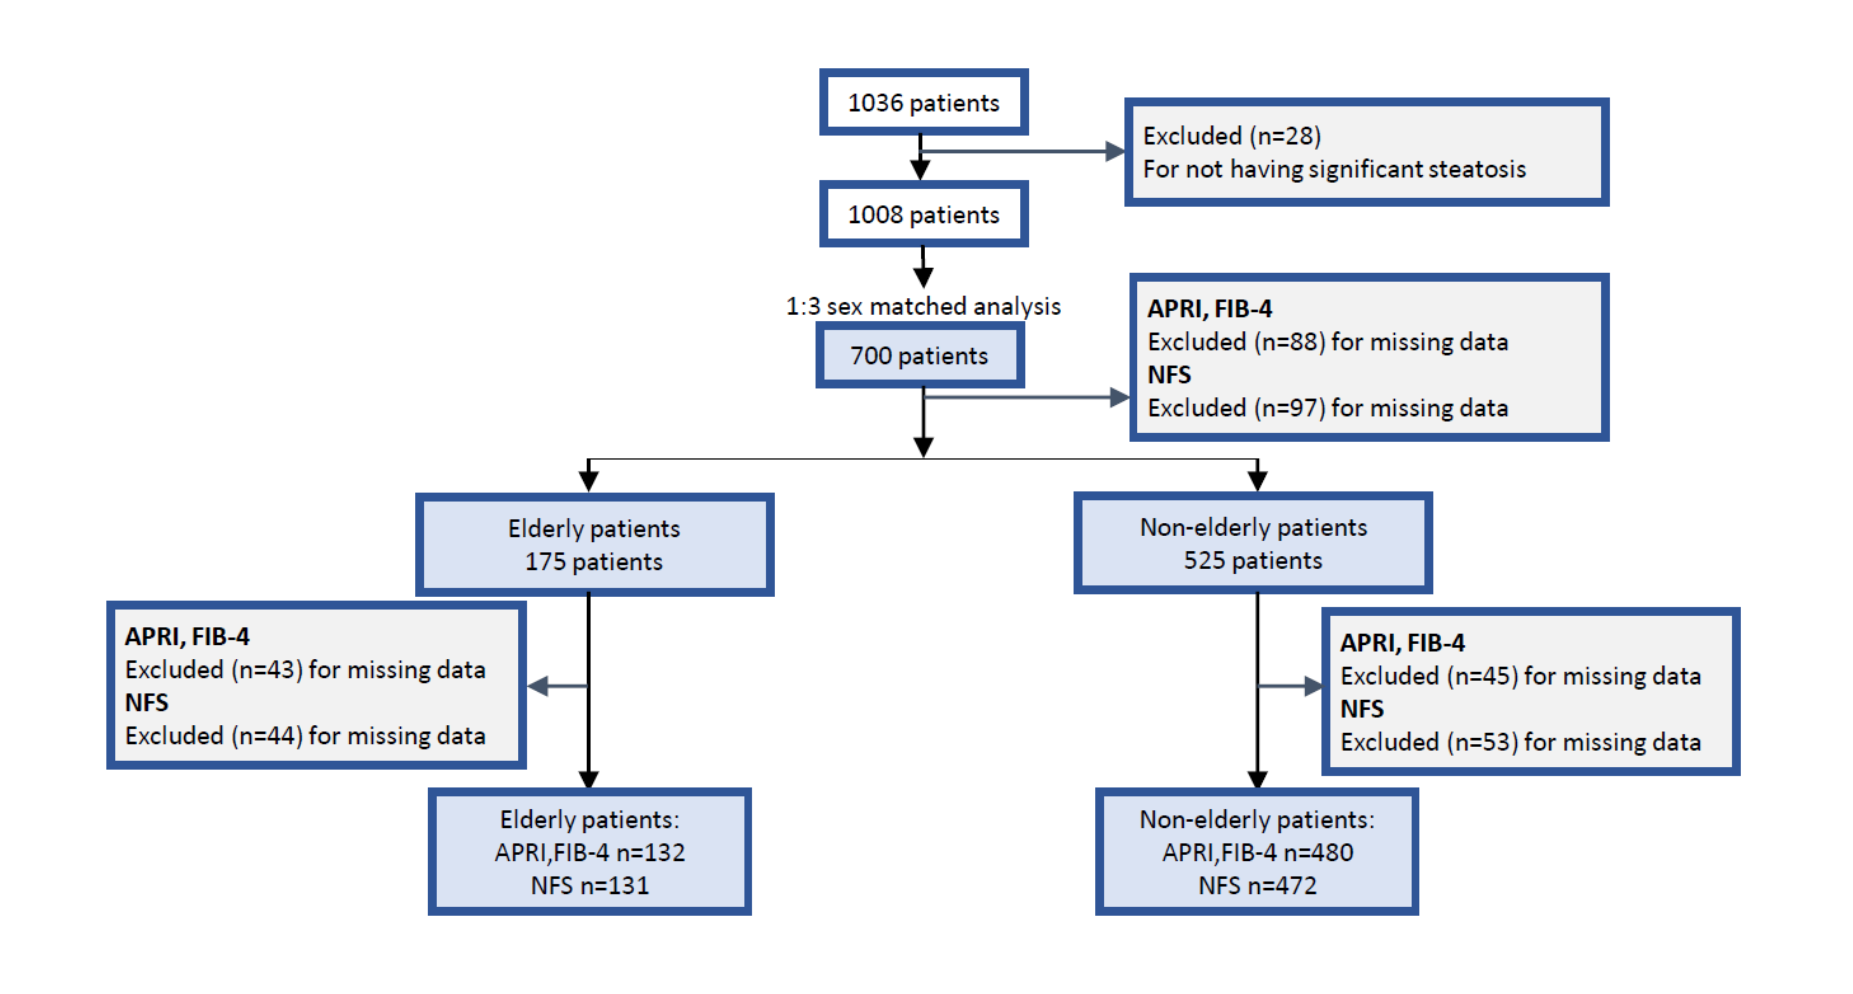
Of 1008 patients with biopsy-proven NAFLD, 175 patients were elderly, who were matched with 525 non-elderly patients. The median (IQR) age of elderly NAFLD and non-elderly NAFLD patients were 64 (62-67) and 46 (36-54) years. In the elderly group, 102 (58.3%) patients were female.
The elderly NAFLD patients were more likely to have diabetes mellitus, hypertension and dyslipidemia than non-elderly patients. Elderly NAFLD patients had significantly lower BMI [27.19 (24.73-30.34) vs 29.62 (26.45-35) kg/m2, p<0.001] and hip circumference [97 (87.75-104) vs 100 (88-108) cm, p=0.037]. Elderly NAFLD patients had lower alanine aminotransferase [55 (38-94) vs 61 (37-90) U/L, p=0.002], platelet count [227.5 (177.5-280.75) vs 251 (202-297)x 109/L, p< 0.001], white blood count [6.57 (5.6-8) vs 7.3 (5.9-8.8)x 103/mm3, p=0.015] , total cholesterol [4.4 (3.5-5.33) vs 5 (4.3-5.7) mmol/L, p<0.001] and LDL cholesterol [2.3 (1.79-3.25) vs 3 (2.43-3.7) mmol/L, p<0.001] than non-elderly NAFLD patients. Elderly patients had significantly higher hemoglobin A1c than non-elderly patients [6.65 (5.9-7.33) vs 6.1 (5.6-7.2) %, p<0.001] (table1).
For the pathology findings, NASH weren’t difference between elderly and non-elderly NAFLD patients (67.4% vs.63.8%, p=0.386). Elderly NAFLD patients were more likely to have advanced fibrosis (F3-4; 35.4% vs. 13.3%, p < 0.001) and cirrhosis (15.4% vs. 4.8%, p < 0.001) than non-elderly NAFLD patients (figure 1). Elderly patients also had higher fibrosis scores: APRI (1.18 ± 2.02 vs. 0.74 ± 1.55, p =0.02), NFS (-0.75± 1.49 vs. -1.91 ± 1.88, p <0.001), and FIB-4 index (3.88 ± 6.72 vs. 1.58 ± 3.935, p <0.001) (table 1).
Characteristics of elderly NAFLD patients with and without advanced fibrosis
Focusing on the elderly NAFLD patients, over one-third of them had advanced fibrosis (35.4%) including stage 3 fibrosis (F3; 20%) and stage 4 fibrosis (F4; 15.4%). Elderly NAFLD patients with advanced fibrosis were more likely to be female (72.6% vs. 50.4%; p = 0.005), obesity (83.9% vs 65.5%; p=0.01), central obesity (94.7% vs.79.1%; p = 0.009), diabetes (79% vs 64.6%; p=0.047) and hypertension (88.3% vs. 67%; p = 0.002) (table 2).
By univariate analysis, female sex, obesity, central obesity, diabetes and hypertension were associated with advanced fibrosis among the elderly NAFLD patients. By multivariable analysis, factors associated with advanced fibrosis in elderly patients included female sex (OR 3.21; 95%CI 1.37-7.54) and hypertension (OR 3.68; 95%CI 1.11-12.23). In contrast, diabetes (OR 3.38; 95%CI 1.70-6.73) and platelet count less than 140 x109/L (OR 4.18; 95%CI 1.32-13.25) were factors associated with advanced fibrosis in non-elderly patients (table 3).
The performance of non-invasive fibrosis scores in elderly NAFLD patients
The AUROC of APRI, NFS and FIB-4 to predict advanced fibrosis the elderly NAFLD patients are as follows: 0.62 (0.52-0.72) p=0.03, 0.65 (0.55-0.75) p=0.01, and 0.64 (0.54-0.74) p=0.01, respectively (table4). Comparison of the AUROC among APRI, NFS, and FIB-4 showed no significant difference within elderly NAFLD patients (APRI vs NFS, p=0.551, APRI vs FIB-4, p=0.308 and NFS vs FIB-4, p=0.828).The flow diagram evaluating the performance of non-invasive fibrosis scores in elderly NAFLD patients is shown in supplemental figure1. Sensitivity, specificity, positive predictive value (PPV) and negative predictive value (NPV) of APRI, NFS and FIB-4 in both elderly and non-elderly NAFLD are shown in supplemental table4.