AnoExpress
We performed a differential expression meta-analysis on read count data from 28 RNA-sequencing datasets representing insecticide-resistant Anopheles populations from 11 countries in sub-Saharan Africa [32–38] (Fig. 1, Supplementary Table 1). Of the 28 resistant populations, 15 are An. coluzzii, 3 are An. gambiae, 5 are An. arabiensis and 5 are An. funestus. Read-count data from different species were derived from aligning to each respective reference genome assemblies. For differential expression analysis, each resistant population was compared to an insecticide-susceptible strain of the same species from the same study. To enable cross-species comparison of putative resistance genes, we located orthologs between each different genome assembly and the AgamP4 PEST reference genome, using the OrthoMCL algorithm in VectorBase. As the inclusion of each successive assembly reduces the numbers of genes that are present, we provide four differential expression analyses; the full dataset, termed ‘gamb_colu_arab_fun’ (8599 genes), and secondary analyses – ‘gamb_colu_arab’ (8651 genes), ‘gamb_colu’ (11288 genes), ‘fun’ (14176 genes). Analyses herein were performed on the full gamb_colu_arab_fun dataset unless specified.
These data are presented within a python package, AnoExpress, made for the community, with example notebooks provided to run in Google Colab. Users can load, explore, and visualise the gene expression meta-analysis data, including reproducing most analyses presented herein. AnoExpress can also directly load gene expression data from an earlier meta-analysis of microarray data [30]. AnoExpress is located here: github.com/sanjaynagi/AnoExpress. Documentation and a video user-guide are provided to improve ease of access.
Dataset structure
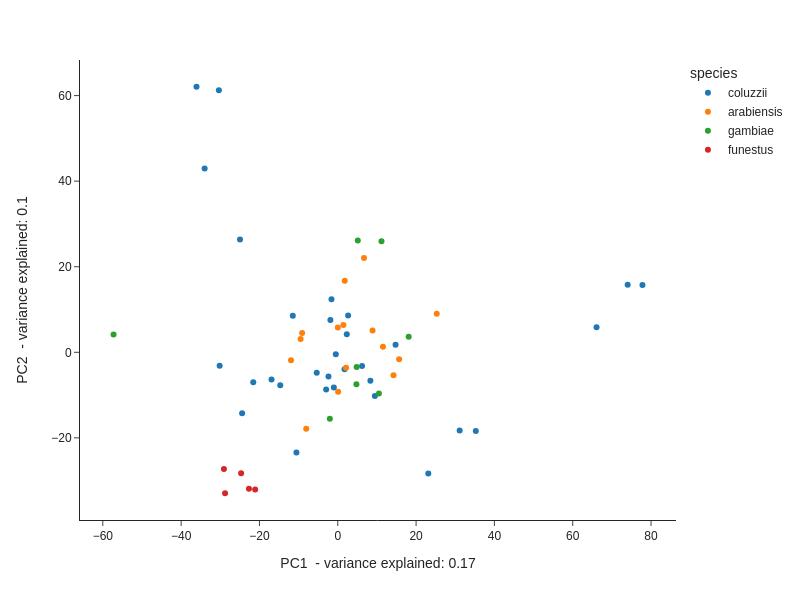
To investigate overall structure in the dataset, we performed principal components analysis on both the count and fold-change data. PCA on the log-transformed count data revealed five distinct clusters present. Four clusters contain samples only from An. funestus, An. coluzzii, or An. arabiensis, with a fifth cluster containing a mixture of An. gambiae, An. arabiensis and An. coluzzii (Fig. 1A). The four species did not resolve into four distinct clusters, suggesting that batch effects from different studies could be present. We therefore only performed within-study differential expression analysis. To compare RNA-Sequencing data with the earlier microarray studies, we performed a PCA on the fold-change data from all available experiments (Supplementary Fig. 1). There was no evidence of clustering between the two technologies, suggesting that the results between the two methodologies are comparable and can be used in combined analyses.
Correlations between pairs of orthologous genes count data from different species were high, with lower correlation between An. funestus and the other three species, which is to be expected given their considerable divergence time (Fig. 1B).
Gene expression is physically clustered in the genome
As changes in gene expression are likely to be related to cis-acting factors and the local genetic context, genes in close physical proximity are more likely to show similar patterns of expression. To test this within our dataset, we calculated and averaged the Pearson’s correlation on log2 fold-changes between each neighbouring gene in the dataset, resulting in a mean Pearson’s R of 0.10 for neighbouring genes. To determine whether this value was higher than expected based on chance, we randomly permuted the positions of all genes in the genome 1000 times and re-calculated the mean Pearson’s R for now neighbouring genes. Figure 2C shows the histogram of mean Pearson’s correlations, demonstrating a clear effect of genome proximity on gene expression.
To further explore physical clustering of resistance-related gene expression, we visualised fold-change values across the whole genome. In Fig. 3, we use AnoExpress to plot gene expression for all genes across all comparisons in the gamb_colu_arab_fun analysis and calculate the moving average log2 fold change across the genome in sliding windows. We identify gene clusters known to be associated with insecticide resistance, such as the CYP6P, CYP9K, CYP6M/Z and GSTD gene clusters. This analysis also highlighted numerous clusters of cuticle proteins which show elevated expression.
Genetic diversity and purifying selection scale with levels of gene expression
We postulated that genes showing higher levels of absolute expression are more likely to be functional in multiple tissues or pathways, and so should be highly conserved, experiencing the highest levels of purifying selection. We integrated whole-genome sequence data from the Anopheles 1000 genomes project [31], to explore the relationship between gene expression and genetic diversity, for each species in which genomic data was publicly available. To compare between species, we selected representative populations of An. gambiae (Nagongera, Uganda), An. coluzzii (Hauts-Bassins, Burkina Faso), and An. arabiensis (Muleba, Tanzania), collected between 2012 and 2015. These cohorts show no signatures of inbreeding of major demographic events. As a measure of absolute expression, we used normalised count data. We then counted the number of segregating sites of synonymous and non-synonymous mutations, as well as calculating nucleotide diversity, π, in each gene, for each species.
Figure 4 shows the ratio of pN/pS and nucleotide diversity, for various levels of expression binned into 5% percentiles for the gamb_colu_arab analysis. We show that average nucleotide diversity is reduced for the most highly expressed genes and is lower overall in An. arabiensis compared to An. coluzzii and An. gambiae, which fits with expectations on genetic diversity from the literature [39].
We show that for each species, the pN/pS ratio is lower for the most highly expressed genes compared to lowly expressed genes. This holds more strongly in An. gambiae and An. coluzzii than An. arabiensis, which likely relates to the efficiency of purifying selection depending on population size – the effects of purifying selection will be stronger in larger populations.
Highly overexpressed genes are associated with selective sweeps in wild-caught mosquitoes
Given that insecticide resistance is often associated with increased expression of metabolic genes and that beneficial resistance mutations can cause selective sweeps which spread through a population, we hypothesised that highly expressed genes are more likely to be found in proximity to genomic regions under selection in wild-caught mosquitoes.
To determine this, we investigated genome-wide signals of recent selection using the H12 statistic [40] on data from phase 3 of the Anopheles 1000 genomes project (Nagi et al., in prep). Every signal was then mined to determine which genes in the AgamP4 assembly, if any, lie at the location of the peak of a selection signal. Further information on genome-wide selection scans and signal calling is found in Supplementary Text 1. Candidate genes were then defined as those genes showing a median fold-change of greater than two in the An. gambiae, An. coluzzii and An. arabiensis dataset (gamb_colu_arab), as these three species are represented in the Ag1000G phase 3 data [38]. We additionally filtered out lowly expressed genes (median counts < 5). After filtering, 106 candidate genes remained, of which 34 were located at the site of a signal of selection (Supplementary Table 2). Figure 5 displays the location of these genes in the An. gambiae PEST reference genome, and recovers known insecticide resistance candidates such as CYP6P3, CYP6M2, GSTE2 and CYP9K1, as well as numerous other genes putatively involved in resistance.
To determine whether this was a significant enrichment of genes compared to random chance, we carried out a permutation analysis. In 10000 permutations, only 2 equalled or exceeded the value of 34 (p-value = 0.0002), suggesting that regions of the genome under selection are indeed enriched for the most highly overexpressed genes. Separately, we utilised the entire dataset of genes and found a positive association between a genes’ median fold-change and whether it was found at the site of an H12 selective sweep signal (pGLM = 0.000).
Signatures of resistance-associated gene expression
To explore highly over-expressed genes across all four species, we ranked genes by mean and median log2 fold change across all experiments (Supplementary Tables 3 and 4). Included in the over-expressed set (cut-off of fold change > 2, median counts > 5), are 65 and 78 genes respectively. Within these lists, the known pyrethroid metaboliser CYP6P3 [39] (the ortholog of CYP6P9a/b in An. funestus) had a median and mean fold change of > 6.8, demonstrating the utility of the meta-analytic approach. Included in both lists were other cytochrome P450s including CYP6P4, CYP9K1, CYP6M2, CYP6Z2, CYP6Z3 and CYP6P5, all of which have previously been linked to pyrethroid resistance across both species [20, 21]. Interestingly, CYP4H17 which has never been explored for a role in pyrethroid resistance, appears 7th (mean) and 11th (median) with a median fold change of 3.47. Similarly appearing high across both mean and median rankings are cuticular related proteins CPLCG4, CPR150 and CPLCA3, a venom allergen (AGAP006417), an alkaline phosphatase (AGAP001684), gustatory receptor 49 (AGAP001169) and a protein with no known function (AGAP009327). In total, 50 genes are present in both the median and mean over-expressed sets including one carboxylesterases, 11 cytochrome P450s, three glutathione-S-transferases and one UGT from the major detoxification enzyme families (Fig. 6A). Additionally, 9 cuticular proteins, one D7 salivary gland protein and two hexamerins are present from gene families previously linked to resistance [30, 41]. Two genes related to odorant or taste detection are also present.
We then performed gene set enrichment analysis on the top 5% of overexpressed genes based on median fold-changes (419 genes) (Supplementary Table 5). We performed enrichment on both GO terms and protein (PFAM) domains; significant enrichment terms are displayed in Fig. 6D, categorised by broad resistance mechanism. In expectation with known gene families involved in insecticide resistance, we observe highly significant enrichment for many GO terms relating to detoxification, such as oxidoreductase activity (fdr-corrected p-value = 8e-16), iron ion binding (p = 4.75e-15), heme-binding (p = 6.8e-14), monoxygenase activity (p = 9e-14), glutathione activity (p = 0.001) and glutathione metabolic process (p = 0.001), and the ‘P450’ (p = 1.6e-16), ‘GST_N_3’ (p = 0.002) and ‘GST_C’ (p = 0.004) protein domains. In addition, cuticular-related genes were also enriched, with the GO terms structural constituent of cuticle (p = 1.1e-23), chitin binding (p = 2.3e-09), chitin metabolic process (p = 1.3e-8), fatty acid elongase activity (p = 0.04), and the protein domains ‘Chitin_bind_4’ (p = 3.2e-20), ‘CMB_14’ (p = 1.3e-18), and CPCFC (p = 0.03). Finally, a large group of terms were related to sensory perception, including the GO terms ‘sensory perception of smell’ (p = 1.4e-6), odorant binding (p = 2.4e-6), olfactory receptor activity (p = 0.0002), sensory perception of taste (p = 0.018), taste receptor activity (p = 0.04), and the protein domains ‘7tm_6’ (p = 0.00003) and ‘7tm_7’ (p = 0.03), which indicate odorant and gustatory receptors.
We then explored highly down-regulated genes based on median fold-changes (Fig. 6C). Amongst the most down-regulated genes was CYP307A1, a known regulator of ecdysone synthesis [42]. In addition to hormone related transcripts CLIPA13 and Galectin 6 are heavily down-regulated. Zero GO terms were enriched based on the 5% lowest median fold-changes. If we instead use the 5% lowest mean fold-changes, we observe significant enrichment for sodium channel activity (p = 0.00013), sodium ion transport (p = 0.00059) and sodium ion transmembrane transport (p = 0.0044) the target sites for pyrethroids.
Consistently differentially expressed genes
We then explored genes which were significantly up and down-regulated most consistently.
After filtering genes with very lowly expressed genes, only two genes were upregulated in 22 out of 28 RNA-Sequencing experiments, CYP6P3 and CYP9K1. GSTD3 and CYP6P4 were upregulated in 21 out 28. Figure 6B shows all 18 genes significantly over-expressed in at least 19 out of 28 experiments, and includes CYP4H17, CYP4H18, CYP6M2, GSTE2, a UGT and a trypsin TRYP4 (Supplementary Table 6). This set of genes were enriched for seven P450-related GO terms, including oxidoreductase activity (p = 1.68e-09) and heme binding (p = 5.66e-09), and the PFAM domain ‘p450’ (p = 9.19e-10).
In contrast, only 8 genes showed consistent down-regulation in at least 19 out of 28 experiments (Supplementary Table 6), including two opsin genes, GPROP4 and GPROP6, and a molecular chaperone HtpG gene (AGAP006961). The genes are enriched in seven GO terms relating to light detection, such as photoreceptor activity (p = 0.029), visual perception (p = 0.029) and phototransduction (p = 0.039).
Detoxification genes
In total 18 cytochrome P450s show either a median and mean fold change of > 2 and 9 are significantly upregulated in at least 19 out of 28 of all datasets. The cytochrome P450 family most represented is the CYP6 family, orthologous to the CYP3 clade in humans, responsible for the vast majority of xenobiotic metabolism. The CYP6Ps, CYP6M2 and CYP9K1 which have been repeatedly associated with insecticide resistance are all heavily implicated and are located in regions of the genome under selection (Fig. 5). Additionally, four members of the CYP4 family appear to be overexpressed across multiple resistant populations, particularly CYP4H17, but also CYP4H16, CYP4H18, and CYP4C28.
Similarly, 4 out of 27 GSTs (Fig. 6) have high mean or median fold-changes with one, GSTD3 showing consistently significant overexpression. Of these, GSTE2 has been shown to be involved in pyrethroid resistance [38], whilst GSTE1, 2 and 5 have been implicated in DDT resistance [43]. Of the other phase two and three detoxification families, two UGTs (AGAP006222 and AGAP011564) and two carboxylesterases (COEAE6O and COEAE8O) are expressed with high mean or median expression or consistently over-expressed (Fig. 6).
Cuticular Proteins
113 cuticular proteins were included in the full gamb_colu_arab_fun analysis; after filtering for lowly-expressed genes, only 61 of these remained. 20 of these genes showed a mean or median fold-change of above 2 in resistant populations, and although none showed significant over-expression in 19/28 experiments, 9 showed upregulation in at least 16, including CPLCX3, CPR130, CPAP3-C, CPR16, CPR140, CPR59, CPR79, CPLCP12 and CPR81.
Expression of neuronal-related genes
Gene-set enrichment analysis of GO terms on the 5% most down-regulated genes for median expression revealed significant enrichments in synapse (15 genes), sodium channel activity (10 genes) and chemical synaptic transmission (13 genes). The primary target site for pyrethroid insecticides, the Vgsc, is not present in the full gamb_colu_arab_fun analysis, but investigation of the secondary analyses shows sporadic down-regulation in An. coluzzii and An. funestus but not An. gambiae, suggesting that changes in expression of this gene are unlikely to be playing a role in resistance. Interestingly, Ace-1 expression demonstrated up-regulation in almost all An. coluzzii and An. gambiae populations whilst it is down-regulated in all 5 of the An. funestus populations. The gene coding for the beta-2 subunit of the nicotinic acetylcholine receptor is significantly overexpressed in 11 out of 28 experiments.
Other a priori resistance candidates
A number of genes and gene families have recently been implicated in insecticide resistance, including CSPs, hexamerins, alpha-crystallin, the transcription factor Maf-S and d7 salivary proteins [29, 30, 41, 44]. Of the 8 chemosensory proteins, just three remained in the full gamb_colu_arab_fun analysis, CSP3, CSP4 and SAP1, none of which showed high mean or median fold-changes across four species. Similarly, three hexamerins were included in these data, all three of which showed high mean fold changes ranging from 2.64 to 3.4. Further exploration revealed that overexpression was observed in all An. arabiensis and the majority of An. gambiae experiments, with the orthologs of AGAP001345 and AGAP001657 being overexpressed in two (Uganda and FuMoz) out of five An. funestus datasets. Just two a-crystallins were present in the data, neither of which showed an expression-association with resistance. The transcription factor Maf-S was previously identified as up-regulated across multiple An. gambiae s.l populations in the meta-analysis of microarray data [30]. It also shows similarly consistent overexpression in the RNA-Sequencing data, with 12 out of 28 populations exhibiting significant up-regulation.
Transcriptional regulation of insecticide resistance
Previous work using transcriptomic time-course data revealed putative transcription factors regulating the expression of transcripts post-pyrethroid exposure [45]. Here, we used the GENIE3 algorithm in the Grenadine package to re-capitulate a gene regulatory network utilising the 28 RNA-sequencing and including 31 microarray experiments. After filtering score for the top 5th percentile (Supplementary Table 7), 50,967 interactions were predicted. Firstly, we investigated Maf-S due to its prior link with insecticide resistance [44]. 269 putative interactions were identified, including the pyrethroid-resistance related transcripts CYP6M2, CYP6Z3, CYP9J4, two ABC transporters and three GSTs including GSTMS1. To validate the utility of this approach, microarray data published from a Maf-S knockdown [44] was compared with the model predictions; 83 out of the predicted 269 genes were present on the list. We then carried out a permutation analysis, and out of 1000 permutations only 18 had 83 or more overlaps (p = 0.018) giving confidence to the model predictions.
To determine which transcription factors are likely to play a role in resistance, enrichment analysis was performed on the predicted interaction partners for each transcription factor: Rootletin was associated with genes significantly enriched for oxidioreductase activity (p = 0.00943) and was linked with CYP6P3, CYP6P4 and CYP6P5, CYP6AA1, CYP6M2 and CYP6Z4; genes predicted to interact with Su(H) were similarly enriched in oxoreductase activity (p = 9.19e-3); Antp, Cbt and Sug were significantly enriched in cellular response to stress (p = 5.19e-4; 3.83e-4; 2.30e-8), Asciz and Org-1 to sensory response to chemical stimulus (p = 5.56e-4; 1.69e-4), E(spl)m3-HLH and Grh with structural constituent of the cuticle (p = 8.36e-5; 1.71e-2); exex with acetylcholine metabolic process (p = 3.57e-3); Grau, Scrt and Toy with G protein-coupled receptor activity (p = 1.47e-5; 1.01e-2; 2.46e-6); HLH3B with neurogenesis (p = 4.01e-2); Onecut with synpase organisation (p = 5.26e-3); Row with response to stress (p = 8.97e-6) and TFAM with electron transport chain (1.25e-7). A number of transcription factors were enriched in higher order functions, such as RNA metabolic processes, gene expression and aromatic compound metabolic processes.