Genome-wide identification and chromosomal distribution of SAUR genes in S. miltiorrhiza
A total of 55 SmSAUR gene members were identified and named SmSAUR1-SmSAUR55 according to their chromosomal location (Table 1, Table S1-S2). Focused subsequent analysis examined the physical and chemical properties of the identified SmSAUR genes. The cDNA length of SmSAURs varied from 243 bp (SmSAUR1 and SmSAUR45) to 528 bp (SmSAUR7). The predicted MW of the SmSAUR proteins ranged from 9,126.74 Da (SmSAUR1) to 19,784.58 Da (SmSAUR7), while their theoretical pI ranged from 4.99 (SmSAUR5) to 11.07 (SmSAUR38). Subcellular localization analysis showed that 19 SmSAUR proteins were located in the nuclear, 24 SmSAUR proteins were predicted to be in the chloroplast, 11 SmSAUR proteins were located in the mitochondrion, and SmSAUR54 was located in the extracellular space. The results of protein hydrophilicity prediction indicated that only two SmSAUR proteins (SmSAUR11 and SmSAUR53) were hydrophobic, while the remaining members were hydrophilic proteins.
Table 1
Characteristics of SmSAUR genes and SmSAUR proteins in Salvia miltiorrhiza.
| Gene name | Gene ID | Chromosome | Locus | CDS Length (bp) | Number of aa | Theoretical pI | Mw (Da) | Subcellular localization | Gravy |
| SmSAUR1 | evm.model.HICASM0.1861 | Chr 1 | 28402568–28402810 | 243 | 80 | 9.45 | 9126.74 | chloroplast | -0.227 |
| SmSAUR2 | evm.model.HICASM0.2320 | Chr 1 | 32715887–32716110 | 324 | 107 | 8.88 | 12004.97 | nucleus | -0.155 |
| SmSAUR3 | evm.model.HICASM0.3206 | Chr 1 | 41999990–42000415 | 426 | 141 | 10.68 | 15898.87 | chloroplast | -0.204 |
| SmSAUR4 | evm.model.HICASM0.3700 | Chr 1 | 47668156–47668614 | 459 | 152 | 5.26 | 17168.34 | chloroplast | -0.633 |
| SmSAUR5 | evm.model.HICASM0.3702 | Chr 1 | 47696575–47696949 | 375 | 124 | 4.99 | 13711.53 | nucleus | -0.236 |
| SmSAUR6 | evm.model.HICASM0.3777 | Chr 1 | 48614123–48614611 | 489 | 162 | 5.92 | 17997.4 | mitochondrion | -0.131 |
| SmSAUR7 | evm.model.HICASM0.3856 | Chr 1 | 49382273–49382800 | 528 | 175 | 8.86 | 19784.58 | chloroplast | -0.505 |
| SmSAUR8 | evm.model.HICASM0.6011 | Chr 1 | 69646200–69646709 | 510 | 169 | 9.77 | 19406.3 | chloroplast | -0.447 |
| SmSAUR9 | evm.model.HICASM0.6012 | Chr 1 | 69649056–69649349 | 294 | 97 | 9.36 | 11112.73 | chloroplast | -0.319 |
| SmSAUR10 | evm.model.HICASM0.6013 | Chr 1 | 69652982–69653311 | 330 | 109 | 9.61 | 12446.1 | mitochondrion | -0.398 |
| SmSAUR11 | evm.model.HICASM0.6015 | Chr 1 | 69666294–69666623 | 330 | 109 | 8.49 | 12136.98 | chloroplast | 0.04 |
| SmSAUR12 | evm.model.HICASM0.6016 | Chr 1 | 69669389–69669700 | 312 | 103 | 7 | 11776.54 | chloroplast | -0.277 |
| SmSAUR13 | evm.model.HICASM0.6018 | Chr 1 | 69681500–69681795 | 312 | 103 | 6.28 | 11422.81 | nucleus | -0.319 |
| SmSAUR14 | evm.model.HICASM0.6019 | Chr 1 | 69684559–69684825 | 267 | 88 | 6.27 | 10090.57 | chloroplast | -0.208 |
| SmSAUR15 | evm.model.HICASM0.6020 | Chr 1 | 69691882–69692151 | 270 | 89 | 6.83 | 10163.6 | chloroplast | -0.254 |
| SmSAUR16 | evm.model.HICASM0.6021 | Chr 1 | 69694065–69694331 | 267 | 88 | 6.27 | 10105.52 | mitochondrion | -0.294 |
| SmSAUR17 | evm.model.HICASM0.6022 | Chr 1 | 69700340–69700609 | 270 | 89 | 6.27 | 10072.49 | mitochondrion | -0.181 |
| SmSAUR18 | evm.model.HICASM0.6024 | Chr 1 | 69763631–69763957 | 384 | 127 | 8.98 | 14712.01 | chloroplast | -0.247 |
| SmSAUR19 | evm.model.HICASM0.6025 | Chr 1 | 69765812–69766063 | 252 | 83 | 5.52 | 9583.92 | chloroplast | -0.257 |
| SmSAUR20 | evm.model.HICASM0.6026 | Chr 1 | 69766989–69767258 | 270 | 89 | 6.4 | 10156.59 | chloroplast | -0.112 |
| SmSAUR21 | evm.model.HICASM0.6027 | Chr 1 | 69768323–69768589 | 267 | 88 | 5.87 | 10114.55 | mitochondrion | -0.208 |
| SmSAUR22 | evm.model.HICASM0.6032 | Chr 1 | 69902535–69902801 | 267 | 88 | 6.82 | 10050.54 | mitochondrion | -0.183 |
| SmSAUR23 | evm.model.HICASM0.6034 | Chr 1 | 69928469–69928735 | 267 | 88 | 6.83 | 10046.5 | mitochondrion | -0.198 |
| SmSAUR24 | evm.model.HICASM0.6035 | Chr 1 | 69931760–69932029 | 270 | 89 | 6.83 | 10163.6 | chloroplast | -0.254 |
| SmSAUR25 | evm.model.HICASM0.6037 | Chr 1 | 69976232–69976546 | 315 | 104 | 7.82 | 11924.82 | chloroplast | -0.347 |
| SmSAUR26 | evm.model.HICASM0.6039 | Chr 1 | 70017208–70017606 | 399 | 132 | 9.19 | 14917.19 | chloroplast | -0.177 |
| SmSAUR27 | evm.model.HICASM1.5009 | Chr 2 | 63596400–63596828 | 429 | 142 | 10.06 | 16227.84 | mitochondrion | -0.334 |
| SmSAUR28 | evm.model.HICASM1.5015 | Chr 2 | 63732051–63732368 | 318 | 105 | 6.9 | 12058.92 | chloroplast | -0.39 |
| SmSAUR29 | evm.model.HICASM1.5505 | Chr 2 | 68955041–68955370 | 330 | 109 | 8.45 | 12995.85 | nucleus | -0.601 |
| SmSAUR30 | evm.model.HICASM2.1351 | Chr 3 | 23042824–23043052 | 405 | 134 | 9.66 | 14678.84 | chloroplast | -0.294 |
| SmSAUR31 | evm.model.HICASM3.97 | Chr 4 | 868604–869098 | 495 | 164 | 10.89 | 19024.16 | nucleus | -0.5 |
| SmSAUR32 | evm.model.HICASM3.2820 | Chr 4 | 35597525–35598022 | 498 | 165 | 9.65 | 18438.09 | mitochondrion | -0.398 |
| SmSAUR33 | evm.model.HICASM3.2935 | Chr 4 | 37051300–37051656 | 357 | 118 | 5.3 | 13210.05 | nucleus | -0.206 |
| SmSAUR34 | evm.model.HICASM3.2939 | Chr 4 | 37090531–37090996 | 498 | 165 | 5.5 | 18520.99 | nucleus | -0.492 |
| SmSAUR35 | evm.model.HICASM3.4371 | Chr 4 | 52055715–52056212 | 498 | 165 | 9.3 | 18433.28 | nucleus | -0.099 |
| SmSAUR36 | evm.model.HICASM3.4460 | Chr 4 | 52984356–52984656 | 366 | 121 | 9.84 | 14240.51 | mitochondrion | -0.611 |
| SmSAUR37 | evm.model.HICASM3.4501 | Chr 4 | 53346802–53347116 | 315 | 104 | 9.64 | 12002.68 | chloroplast | -0.495 |
| SmSAUR38 | evm.model.HICASM3.4569 | Chr 4 | 53835866–53836330 | 465 | 154 | 11.07 | 17607.71 | chloroplast | -0.401 |
| SmSAUR39 | evm.model.HICASM3.4793 | Chr 4 | 55416083–55416505 | 423 | 140 | 8.74 | 15644.22 | mitochondrion | -0.04 |
| SmSAUR40 | evm.model.HICASM3.4794 | Chr 4 | 55418215–55418637 | 423 | 140 | 7.69 | 15702.95 | nucleus | -0.336 |
| SmSAUR41 | evm.model.HICASM4.1150 | Chr 5 | 11494668–11495033 | 366 | 121 | 6.83 | 13768.96 | chloroplast | -0.16 |
| SmSAUR42 | evm.model.HICASM4.1195 | Chr 5 | 12088748–12089086 | 339 | 112 | 9.07 | 12823.73 | chloroplast | -0.338 |
| SmSAUR43 | evm.model.HICASM5.267 | Chr 6 | 2265510–2265944 | 435 | 144 | 8.98 | 16339.96 | nucleus | -0.439 |
| SmSAUR44 | evm.model.HICASM5.3617 | Chr 6 | 45409751–45410071 | 321 | 106 | 8.63 | 12456.22 | nucleus | -0.681 |
| SmSAUR45 | evm.model.HICASM5.3618 | Chr 6 | 45421236–45421402 | 243 | 80 | 9.34 | 9135.69 | nucleus | -0.586 |
| SmSAUR46 | evm.model.HICASM6.2154 | Chr 7 | 20792434–20792823 | 390 | 129 | 6.81 | 14850.74 | nucleus | -0.597 |
| SmSAUR47 | evm.model.HICASM7.265 | Chr 8 | 3589444–3589803 | 360 | 119 | 6.29 | 13511.53 | chloroplast | -0.407 |
| SmSAUR48 | evm.model.HICASM7.695 | Chr 8 | 7220590–7220940 | 351 | 116 | 6.82 | 12780.83 | nucleus | -0.078 |
| SmSAUR49 | evm.model.HICASM7.1146 | Chr 8 | 11859967–11860281 | 315 | 104 | 8.51 | 11889.73 | nucleus | -0.307 |
| SmSAUR50 | evm.model.HICASM7.1799 | Chr 8 | 18500227–18500472 | 246 | 81 | 9.06 | 9473.02 | nucleus | -0.347 |
| SmSAUR51 | evm.model.HICASM7.3159 | Chr 8 | 32614058–32614429 | 372 | 123 | 9.17 | 14287.05 | chloroplast | -0.088 |
| SmSAUR52 | evm.model.HICASM7.3188 | Chr 8 | 32937744–32938100 | 357 | 118 | 7.02 | 13610.51 | nucleus | -0.612 |
| SmSAUR53 | evm.model.HICASM7.3191 | Chr 8 | 32957898–32958266 | 369 | 122 | 5.3 | 13604 | nucleus | 0.234 |
| SmSAUR54 | evm.model.HICASM7.3595 | Chr 8 | 38143478–38143852 | 375 | 124 | 8.26 | 13579.82 | extracellular space | -0.007 |
| SmSAUR55 | evm.model.HICASM7.4013 | Chr 8 | 44415884–44416047 | 393 | 130 | 9.02 | 14332.61 | nucleus | -0.218 |
| Chr, chromesome; CDS, coding sequence; bp, base pair; aa, amino acids; pI, isoelectric point; Mw, molecular weight; Da, Dalton. |
Localization of SmSAURs on the chromosomes was mapped in order to further understand the characteristics of these SmSAURs. The positions of SmSAUR genes were visualized using TBtools software (Fig. 1). The majority of members (26 SmSAURs) were located on chromosome 1, whereas chromosome 3 and chromosome 7 had only one member. The remaining members were arranged according to the distribution of SmSAUR genes on the chromosomes: chromosome 2 (3 SmSAURs), chromosome 4 (9 SmSAURs), chromosome 5 (2 SmSAURs), chromosome 6 (2 SmSAURs), chromosome 8 (9 SmSAURs). In addition, most SmSAURs were located in tandem clusters on chromosomes. The largest SmSAUR cluster was located on chromosome 1 and contains 19 tandem members, known as SmSAUR8-26. Two SmSAUR genes clusters were located on chromosome 4 and have two members (SmSAUR33 and SmSAUR34, SmSAUR39 and SmSAUR40) respectively. The SmSAUR gene cluster was composed of two genes on chromosome 1 (SmSAUR4 and SmSAUR5), chromosome 2(SmSAUR4 and SmSAUR5), chromosome 6 (SmSAUR44 and SmSAUR45) and chromosome 8 (SmSAU52 and SmSAUR53).
Phylogenetic, protein motif and conserved domain analysis of SmSAURs
To investigate the evolutionary relationships among the 55 SmSAURs, a phylogenetic tree was constructed based on the multiple alignment of the auxin-inducible domains of S. miltiorrhiza, A. thaliana, and O. sativa, using the neighbor-joining (NJ) method. The 55 SmSAUR proteins were divided into five groups (group Ⅰ-Ⅴ), which contained 39, 7, 4, 2, and 3 proteins, respectively. Majority of the SmSAUR proteins and their homologs in A. thaliana were assigned to the same groups, indicating a close evolutionary relationship between SmSAUR and AtSAUR proteins (Fig. 2).
To study the phylogenetic classification and structural diversity of putative SmSAUR proteins, a phylogenetic tree based on the amino acid sequences of SmSAUR proteins was constructed using the NJ method (Fig. 3a). In addition, the motifs in SmSAURs were analyzed using the MEME website. In total, 10 conserved motifs were identified and predicted among the 55 SmSAUR proteins, named Motif 1–10. The consensus sequences and E-value of all sequences were displayed in Table S3. Almost all SmSAUR proteins contained conserved Motif 1, Motif 2, and Motif 3. These three motifs represented the auxin-inducible domain and may play an essential role in the auxin signaling pathway. In addition, Motif 4 and Motif 6 usually appeared at the N-terminal, while Motif 3 and Motif 7 appeared at the C-terminal (Fig. 3b). The results indicated that the SmSAUR family domains were highly conserved in evolution, and closely related members of the phylogenetic tree contained the same motifs. Subsequently, the conserved domains of 55 SmSAUR proteins were analyzed. All SmSAUR proteins have a typical auxin-inducible or auxin-inducible superfamily domain (Fig. 3c). Auxin-inducible proteins and auxin-inducible superfamily proteins share a common ancestor in evolution, indicating that they belong to the same family. This confirms that these SmSAUR proteins are part of the same family.
Analysis related cis-acting elements and gene structure of the SmSAURs
In order to intuitively understand the characteristics of SmSAUR genes, the phylogenetic tree of SmSAUR proteins were constructed (Fig. 4a). To understand the potential functions of the SmSAUR genes in response to various reactions, we selected 2 kilobase promoter regions from the transcription start sites for cis-acting elements analysis (Fig. 4b). The cis-acting elements can be categorized into three primary categories: phytohormone response, abiotic and biological stress, as well as plant growth and development. In this study, many cis-acting elements related to phytohormone response were identified. A total of 39 auxin response elements, 57 MeJA response elements, 75 ABA response elements, 49 GA response elements and 31 SA response elements were identified in 55 SmSAURs. With the exception of SmSAUR25 and SmSAUR46, all promoters included phytohormone response elements. In particular, the promoter sequences of SmSAUR10 and SmSAUR40 contained 3–4 auxin response elements, suggesting that these two genes played important roles in the response to auxin in S. miltiorrhiza. In addition, 6 cis-acting elements related to abiotic and biological stress, as well as 3 cis-acting elements related to plant growth and development, were also identified. With the exception of SmSAUR25 and SmSAUR46, all promoters included phytohormone response elements. It was estimated that 33 SmSAURs were involved in plant growth and development. In conclusion, SmSAUR genes are likely to participate in various hormonal regulations, stress responses, as well as plant growth and development.
By analyzing the exon/intron structure of SmSAUR genes, we found that all SmSAUR genes had complete open reading frame (ORF). Among them, 9 SmSAURs (SmSAUR13, SmSAUR18, SmSAUR30, SmSAUR55, SmSAUR4, SmSAUR34, SmSAUR2, SmSAUR45, and SmSAUR36) contained one intron, while the remaining genes comprised a single exon without any introns (Fig. 4c). These results were consistent with the typical characteristics of the SAUR gene family.
Synteny analysis of SAURs
In order to comprehend the underlying genetic mechanisms in evolution, an analysis of gene duplication events was performed on the SmSAUR gene family in S. miltiorrhiza. Five tandem duplication events revealed the clustering of 15 SmSAUR genes: SmSAUR4/34, SmSAUR5/33, SmSAUR6/32, SmSAUR9/25/49, SmSAUR31/38 and SmSAUR36/47/48/52 (Fig. 5a). In addition to tandem duplication events, we identified 11 pairs of segmental duplication events using BLASTP and MCScanX methods. These findings indicated that gene duplication likely played a significant role in the generation of most SmSAUR genes, with tandem duplication events serving as the primary driving force for gene evolution. To gain a deeper understanding of the phylogenetic mechanisms among SmSAUR genes, two comparative syntenic maps were created for S. miltiorrhiza, associating it with two representative species: dicotyledonous (A. thaliana) and monocotyledonous (O. sativa) plants. (Fig. 5b). The results showed that there were 40 homologous gene pairs between S. miltiorrhiza and A. thaliana, which were distributed on all chromosomes except chromosome 3. There were 12 homologous gene pairs between S. miltiorrhiza and O. sativa, distributed on chromosomes 1, 4, 5, and 6. More gene duplication events revealed the high homology between S. miltiorrhiza and A. thaliana.
Expression profiles of SmSAUR genes in different organs of S. miltiorrhiza
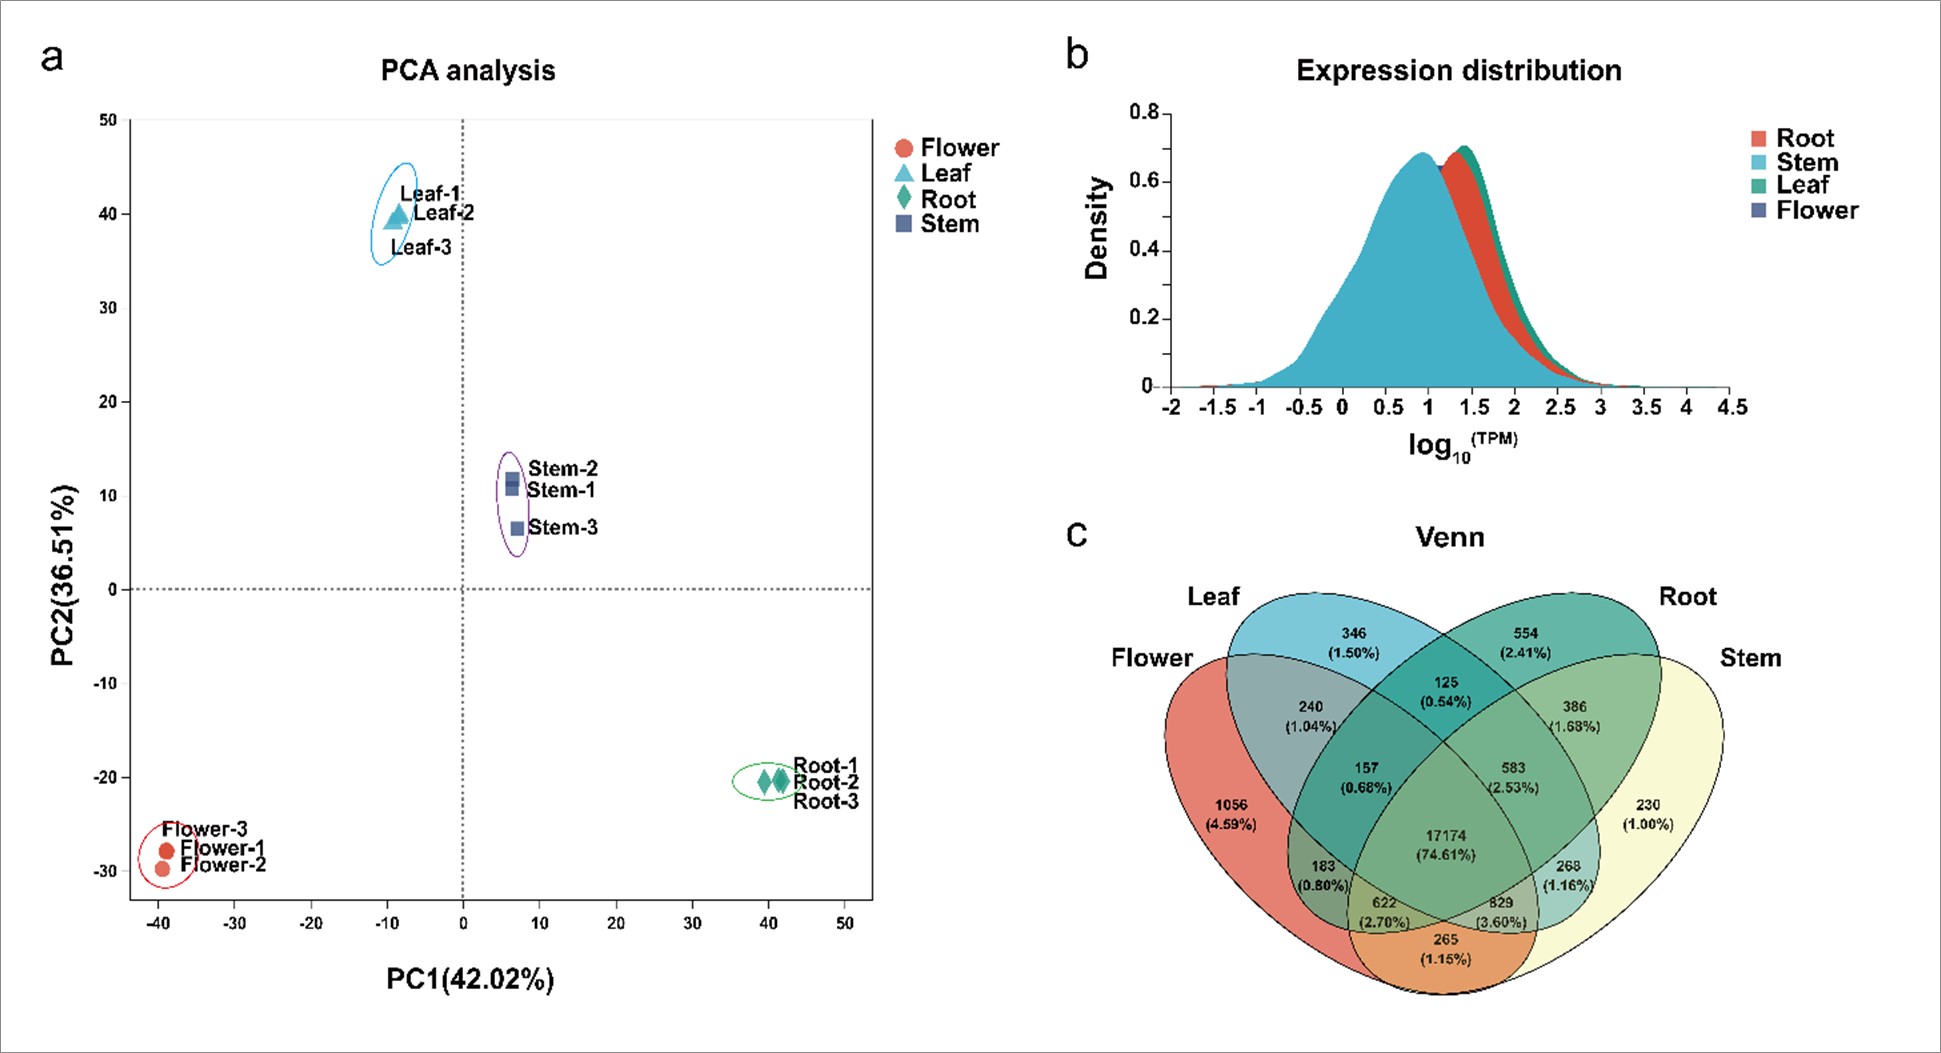
To assess the tissue-specific expression patterns of S. miltiorrhiza SAUR genes, we analyzed the transcriptome data from root, stem, leaf, and flower. After removing low-quality reads and adapters, the sequencing of root, stem, leaf, and flower samples produced 48.03 million, 47.29 million, 49.84 million, and 44.03 million clean reads, respectively (Table S5). To verify the reliability and validity of the experiment, principal component analysis (PCA) was performed. The results of the PCA indicated significant separation among the various treatment groups (Fig. S1a). To ensure comparability of gene expression estimates across different experiments, we employed the most widely used gene expression normalization method. This method calculates the transcripts per kilobase per million mapped reads (TPM) value for each gene, taking into account the effects of sequencing depth and gene length on read counts, thereby normalizing the expression levels of all genes. The analysis results of gene expression levels displayed that the log10(TPM+1) values of all annotated genes were distributed between − 1.50 and 3.50 in root, stem, flower and leaf sample group, and most genes were closely clustered between 0.50 and 1.50 (Fig. S1b). A Venn diagram was generated based on the comparative results of all annotated genes in root, stem, leaf, and flower. Venn diagram displayed the 18,039 overlapped expressed genes between root and leaf group, 18,765 overlapped expressed genes in root group and stem group, 18,136 overlapped genes in root group and flower group, 18,854 overlapped genes in leaf group and stem group, 18,400 overlapped genes in leaf group and flower group, 18,890 overlapped genes in flower group and stem group, and 17,174 overlapped expressed genes in root, stem, leaf, and flower groups (Fig. S1c).
The transcripts of 1 SmSAUR gene (SmSAUR35) were not detected in any of these 12 samples, indicating that SmSAUR35 was either pseudogene or had special expression pattern that was not examined in our libraries. 54 SmSAUR genes were expressed in all 12 samples tested (FPKM > 0), and 35 genes showed constitutive expression (FPKM > 2 in all samples). The expression profiles of SmSAURs indicated that SmSAUR13, SmSAUR31 and SmSAUR46 were highly expressed in all organs selected in this study, suggesting that these 3 genes were key functional genes (Fig. 6a). Analysis of expression profiles revealed that 29 SmSAURs exhibited the highest expression in flowers, while 5 members, namely SmSAUR26, SmSAUR31, SmSAUR32, SmSAUR36, and SmSAUR43, exhibited the highest expression levels in roots. SmSAURs with a close evolutionary relationship had similar expression characteristics. For example, SmSAUR15, SmSAUR17, SmSAUR10, SmSAUR23, SmSAUR24, SmSAUR16, SmSAUR21, SmSAUR10, and SmSAUR18 all had the lowest expression levels in the roots and the highest expression levels in the flowers. The expression levels of SmSAUR33, SmSAUR41, SmSAUR42, SmSAUR43, and SmSAUR54, which were closely related to evolution, were the lowest in the leaves. Additionally, primer details were provided in Table S4, and qRT-PCR was conducted to validate the expression levels of selected genes, with results consistent with the transcriptome sequencing data (Fig. 6b-i). The expression levels of SmSAURs in the four organs were notably different, indicating that they may have multiple functions during the growth and development of S. miltiorrhiza.
Exogenous IAA promoted the growth and root development in S. miltiorrhiza in hydroponic culture
To elucidate the relationship between SmSAUR genes and IAA, seedlings of this herb were treated with 0.10 µmol·L− 1 IAA, and the phenotypic indexes of the IAA-treated and control groups were determined. The results indicated that IAA positively regulated the growth and root development in S. miltiorrhiza (Fig. 7b). The IAA treatment group exhibited increased counts of primary lateral roots, secondary lateral roots, diameter of primary lateral roots, root biomass, and fresh weight of the above-ground portion. However, there was no significant (P < 0.05) difference in plant height and leaf number between the IAA-treated and control groups (Fig. 7b-i). Specifically, the number of primary lateral roots, number of secondary lateral roots, diameter of primary lateral roots, root biomass, and fresh weight of the above-ground portion were 1.52-fold, 2.42-fold, 1.33-fold, 1.55-fold and 1.28-fold of that in the control group, respectively.
Screening SmSAUR genes involved in root development of salvia miltiorrhiza was based on Pearson correlation coefficient
In order to identify auxin regulated SmSAURs that may be involved in root development, root samples of the IAA-treated and control groups were analyzed by RNA-seq based on the experimental results of IAA promoting root development of S. miltiorrhiza. As the results shown in Table S6, there were 49.33 million raw reads and 48.84 million clean reads in the control group, and 49.78 million raw reads and 49.28 million clean reads in the IAA group. In addition, as shown in the Venn diagram, there is 19,723 overlapped expressed genes between the two groups (Fig. 7a). The expression distribution of genes based on TPM values, the statistical results of gene expression distribution showed that the log10(TPM+1) values of most annotated genes were closely clustered between 0.50 and 2.00 in both the IAA-treated and control groups (Fig. 7b). | log2(Fold change) | ≥ 1 and P < 0.05 were used as the default thresholds to screen the differentially expressed genes (DEGs) in the IAA group, there were 1933 differential statistics in the IAA-treated and control groups, including 994 upregulated genes and 939 downregulated genes (Fig. 7c, Table S7). All the DEGs were approximately symmetrical in the Volcano plot and the hierarchical clustering were presented in a heatmap according to the markedly different values of -log10(P adjusted) and log2(Fold Chang) (Fig. 7d).
All SmSAUR genes in the transcriptome data were screened, and the gene expression levels were visualized using a heatmap generated by TBtools software according to the log2(TPM+1) values. The analysis results showed that there were 27 up-regulated SmSAUR genes in the IAA group, among which the expression levels of SmSAUR9 and SmSAUR18 increased most significantly. In addition, 20 down-regulated SmSAURs were screened in the IAA group and the most prominent ones were SmSAUR6, SmSAUR30, SmSAUR33, SmSAUR40, and SmSAUR55. But the expression levels of SmSAUR22, SmSAUR14, SmSAUR19, SmSAUR50, SmSAUR1, SmSAUR2, SmSAUR45, and SmSAUR47 was no significant change, indicating that they were not regulated by IAA (Fig. 8a). Besides, the expression of some of the aforementioned genes were also determined by qRT-PCR using the primers listed in Table S4, the results were consistent with the transcriptome sequencing data (Fig. 8b).
To further clarify the role of SmSAUR genes in root development of S. miltiorrhiza, Pearson correlation coefficient analysis was used according to transcriptome-based data. As shown in Fig. 9 and Table S8, the fresh weight of root was positively correlated with the expression level of SmSAUR38 (P < 0.05) and showed an extremely negative correlation with SmSAUR28 (P < 0.01). There was no significant correlation between the primary lateral root number and the expression of the SmSAUR genes. The secondary lateral root number showed an extremely positive correlation with SmSAUR18 (P < 0.01) and a negative correlation with SmSAUR4 (P < 0.05). The diameter of the primary lateral root showed a positive association with SmSAUR4 (P < 0.05). The last one, root length was extremely positively correlated with SmSAUR28 (P < 0.01) and positively correlated with SmSAUR37 (P < 0.05), while it was negatively correlated with SmSAUR38 (P < 0.05). According to these results, it is speculated that several SmSAUR members may play distinct roles in regulating auxin-mediated root development in S. miltiorrhiza.