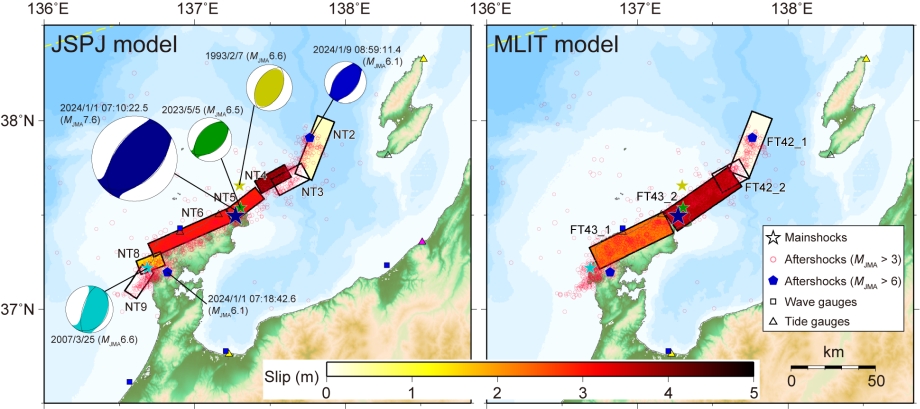
The 2024 Noto-Hanto (Noto Peninsula) earthquake occurred on January 1. According to Japan Meteorological Agency (JMA), the origin time was 16:10:22.5 (7:10:22.5 UTC), the epicenter was 37°29.7'N, 137°16.2'E, the depth was 16 km and the magnitude (MJMA) was 7.6 (Fig. 1a). The focal mechanism (strike = 47°, dip = 37°, rake = 100° and strike = 215°, dip = 54°, rake = 82° according to JMA) indicates reverse fault motion on NE-SW striking planes (Fig. 1b). The aftershocks extended about 150 km (Fig. 1b). Two large aftershocks with MJMA > 6 occurred at the western and eastern end of aftershock areas on January 1 and January 9, respectively. The 2024 Noto Peninsula earthquake is the largest shallow earthquake in and around Japan since the aftershock of the Tohoku earthquake on March 11, 2011.
In the Noto Peninsula region, a swarm of earthquakes started around December 2020, with the largest size of MJMA 5.4 (June 19, 2022). The swarm activity was confined in a small region (~ 20 km x ~ 10 km) at the tip of the peninsula, and has been considered to be related to upwelling fluid (Nishimura et al., 2023). On May 5, 2023, a larger earthquake (MJMA 6.5) occurred (Kato, 2024), and the area of swarm activity became larger (30 km x 30km, according to Earthquake Research Committee). However, the seismic swarm was still limited beneath the tip of the peninsula and did not extend to offshore active faults.
Around Noto Peninsula, large earthquakes occurred on February 7, 1993 (MJMA 6.6) to the north of the 2024 event, and on March 25, 2007 (MJMA 6.9) to the west (Fig. 1b). The 1993 earthquake produced small tsunamis that were recorded at Wajima and Naoetsu with maximum double amplitude of ~ 0.5 m (Abe and Okada, 1995). The crustal deformation and tsunami from the 2007 earthquake were recorded on GPS network and tide gauges, respectively, from which the fault models have been proposed (Namegaya and Satake, 2008). Early arrival of tsunami at Toyama tide gauge was considered to be generated by a secondary tsunami source (Abe et al., 2008).
Along the eastern margin of Sea of Japan, series of active faults have been identified. In 2014, a government committee jointly supported by the Ministry of Land, Infrastructure, Transport and Tourism (MLIT), the Ministry of Education, Culture, Sports, Science and Technology (MEXT), and the Cabinet Office of Japan compiled previous studies and proposed 60 rupture scenarios for submarine active faults (hereafter referred to as MLIT fault models) (Fig. 1a, b). MLIT (2014) conducted tsunami simulations using heterogeneous slip models, which included large slip patches surrounded by smaller background patches. Mulia et al. (2020) conducted a probabilistic tsunami hazard analysis for the coast of Sea of Japan assuming the 60 MLIT fault models as the potential tsunami sources. The fault parameters as well as the tsunami hazard curves for each municipality were provided in Mulia et al. (2020).
More recently, the Japan Sea earthquake and tsunami project, hereafter called JSPJ, was conducted (from 2013 to 2020) with support from the MEXT, and the submarine and coastal fault models along Sea of Japan were developed through seismic and geological surveys (Sato et al., 2020). Satake et al. (2022) selected 172 offshore and coastal faults with length of 20 km or greater, as well as 177 combinations of segments including 28 shorter faults, estimated the slip amounts using multiple scaling relations, and computed coastal tsunami heights (their Tables S1 and S2).
Several large (M ~ 7 or larger) earthquakes have occurred along the eastern margin of Sea of Japan in the 20th century, and they generated disastrous tsunamis. The 1940 off Shakotan earthquake (MJMA 7.5) generated tsunami and caused damage including 10 casualties in northern Hokkaido. The tsunami was also recorded in Sakhalin and North Korea. Based on these tsunami waveform data, fault models have been proposed by Satake (1986) and Okamura et al. (2005).
The 1993 off the southwest coast of Hokkaido earthquake (MJMA 7.8), officially named as the 1993 Hokkaido Nansei-oki earthquake, caused the serious damage with more than 200 casualties, mostly on Okushiri Island where the tsunami heights exceeded 20 m. Tanioka et al. (1995) analyzed seismic and tsunami waveforms and geodetic data to estimate the slip distribution on the earthquake fault.
The 1983 off Akita earthquake (MJMA 7.7) (officially named Central Sea of Japan, or the Nihonkai-Chubu earthquake) also caused tsunami as high as 14 m and damage with 100 casualties. This tsunami also caused three casualties in Korea. Satake (1985) used the tsunami waveforms to estimate the fault model.
Murotani et al. (2022) re-examined the tsunami waveforms and runup data from the above three earthquakes and estimated the causative faults among the active faults proposed by the JSPJ.
The 1964 Niigata earthquake (MJMA 7.5) caused damage due to ground shaking, liquefaction, and tsunamis. Abe (1978) used the recorded tsunami waveforms to estimate the fault model. The crustal deformation data recorded along the coast, seafloor and offshore island (Awashima) were used to estimate the fault model (Satake and Abe, 1983).
In this paper, we use the tsunami waveforms recorded around Sea of Japan and GNSS data recorded in Noto Peninsula from the 2024 Noto Peninsula earthquake to estimate the coseismic slip on the active faults identified by the MLIT and JSPJ.
Tsunami and GNSS Data
The tsunami generated by the 2024 Noto Peninsula earthquake propagated through Sea of Japan and was recorded on wave gauges (WG) and tide gauges (TG) located on the east coast of Japan (Fig. 1a, b), and on TGs of Primorye, Sakhalin, and Korea (Fig. 1a). The WGs are located several kilometers offshore from ports around Japan with water depths of 20 to 50 m. We digitized the image data displayed as offshore mean water surface by every minute on the Nationwide Ocean Wave information network for Ports and HArbourS (NOWPHAS) website. Unfortunately, the TGs at Wajima and Noto on the northern coast of Noto Peninsula, which are located within the source area, and the TG at Ogi on Sado Island, which is near the source, did not record data immediately after the earthquake. The TG data at other stations were available from the UNESCO/ Intergovernmental Oceanographic Commission (IOC), Geospatial Information Authority of Japan (GSI) and Korea Hydrographic and Oceanographic Agency (KHOA) websites, as the digital data with sampling rates of 1, 0.5 and 1 minute, respectively.
To remove ocean tide signals from the WG and TG data, a polynomial function was fitted to each data using the GMT command "trend1d". The residuals obtained by this fitting were used as the observed tsunami waveforms for inversions by resampling the waveform data with an interval of 1minute. The observed tsunami waveforms (Fig. 2) show maximum amplitudes of about 0.2 to 0.4 m at most WG stations and 0.1 to 0.4 m at TG stations, respectively. The maximum amplitude of 1.3 m was observed on Naoetsu WG. The waveform on Wajima WG shows the baseline shift of water level to the positive side by about 0.3 m immediately after the earthquake (time zero), suggesting that the WG itself subsided. On Toyama TG, the leading depression wave started immediately after the earthquake and reached a trough of -0.5 m, followed by a peak of 0.8 at 25 min after the earthquake.
As geodetic (crustal deformation) data, we used 39 displacement data (3 components at 13 locations) digitized from the GNSS data on the report submitted to the Earthquake Research Committee by GSI (Fig. 3a). Horizontal displacements were more than 0.7 m in a west to west-southwest direction in the northern part of Noto Peninsula, with a maximum of 2 m recorded at Wajima. In the central Noto Peninsula and Toyama Prefecture, which are farther south from the source area, the horizontal variation is oriented to the northwest, 0.65 m at Notojima, and ~ 0.15 m at Himi and Nyuzen. Vertical uplifts of more than 1 m are recorded from Wajima to Suzu on the northern coast of Noto Peninsula, while subsidence of a few to several tens of centimeter are recorded at stations southern and central parts of Noto Peninsula, with a maximum value of about − 0.3 m at Notojima.