Model architecture of X-Profiler
In this study, we address the issue of high impurity in the dataset by introducing a novel deep learning framework. Instead of expecting each individual slice of the dataset to conform directly to a desired label mapping, we explicitly assign them distinct rankings and weights. Formally, we utilized cell painting data to train and verify our model, segmenting large cellular images into individual slices based on the positional information of cells and constructing intercellular associations by arbitrarily selecting portions of single slices. We introduced the concept of "patch"—bundles of different single cell slice images subjected to the same perturbation. By employing a ResNet to extract image features and utilizing transformer to capture the relational patterns within the same patch, we can identify and exclude poor-quality images, thereby enhancing the model's accuracy. The training and validation processes of the model were shown in Fig. 1a. In the course of model training and validation, 6 to 12 of single-cell images slices were bundled into a patch and fed into the model in batches. During the training phase, the deep learning model iteratively learns from the training data. In each epoch, which is a full pass through the dataset, the model performs a forward pass to make predictions and then calculates the loss by comparing these predictions to the actual labels. The backward pass follows, where the model uses backpropagation to compute the gradient of the loss with respect to each weight. The optimizer then updates the model's weights in an effort to minimize the loss. After each epoch, the model's performance is evaluated on a separate validation set, which helps monitor its ability to generalize to unseen data. During the prediction phase (Fig. 1b), we performed random sampling on the images and packaged single-cell images into patches, comprising 10 to 750 units. Subsequent to this, the model engages in forward propagation and employs the output of the linear layer for the score prediction. Synchronously with the acquisition of the model's predictions, we are also presented with a ranking for each individual cell image within the respective patch, culminating the comprehensive data processing endeavor.
X-Profiler’s performance on hERG inhibition, Mitochondrial toxicity and compounds classification
We designed three tasks to evaluate the capability of X-Profiler. For the hERG inhibition task, we selected 100 compounds (47 toxic and 53 non-toxic) for HCS experiments and generated corresponding high-content images using a high-content imager. We chose 38 compounds (19 toxic and 19 non-toxic) as test dataset for the determination of drug inhibition on hERG ion channels. The high content images were employed to assess the hERG inhibition classification capabilities of the three models: X-Profiler, DeepProfiler, and CellProfiler. Our results showed that X-Profiler outperformed feature extractor DeepProfiler and CellProfiler, achieving an accuracy of 90.6% in cell images classification and the precision, recall and f1 scores for X-Profiler were 80.0%, 95.5% and 86.2%, respectively (Figure. 2a). Moreover, we showed the landscape for compound features using UMAP and two separated cluster for hERG channel inhibitors and non-hERG channel inhibitors were presented. (Figure. 2b). The silhouette score (ss) and adjusted rand score (ars) of clusters between toxicity and non-toxicity compounds was 0.446 and 0.272, respectively, which indicated X-Profiler have the ability to capture the cell phenotype changes affect by hERG channel inhibitors.
For the mitochondrial toxicity task, we mapped all 100 compounds with Tox21 dataset annotation34. Out of these, 77 compounds bore additional mitochondrial toxicity labels (Supplementary Table 2). We selected a test set of 15 compounds, of which 1 were labeled 'Active', 3 were labeled 'Inactive', and 11 were labeled 'Inconclusive'. Mitochondrial toxicity caused by certain compounds is a widespread form of organ toxicity, which can result in multiorgan damage in the heart, liver, bone, and brain35–37. The alterations in cell morphology, texture, and intensity caused by compounds are strongly correlated with mitochondrial toxicity38. We evaluated the classification performance of the three models. The X-Profiler model outperforms the other two models in terms of accuracy, recall, precision and f1 score, and the values for X-Profiler are as follows: 54.5%, 52.4%, 47.3% and 43.3%, as showed in Figure. 2c. The landscape for mitochondrial toxicity was showed in Fig. 2d and the silhouette score and adjusted rand score of clusters between activate, inactivate and inconclusive compounds was 0.023 and 0.083, respectively. For the suboptimal performance of Mitochondrial toxicity, there may be two reasons for this. 1) the among of labeled drugs are decreased and the classification increased, less data implies lower model robustness; 2) the effects of mitochondrial dysfunction are often confusingly cell type-specific, as is the case for the majority of known mitochondrial diseases39, the human HepG2 cells was applied for labeling, while iPSC-CMs might exhibit different toxicity reactions to the same compounds.
For the compounds classification task, it involved classifying images based on the cell response to different compounds. For the same compound, 20% of the images were used for testing, while 80% of the images were used for training. Our results showed that the X-Profiler model outperformed DeepProfiler and CellProfiler, achieving an accuracy, precision, recall and f1 score of 0.867, 0.892, 0.871 and 0.881, respectively. Apparently, X-Profiler demonstrates superior ability in discerning relationships among images (Fig. 2e, Fig. 2f).
Comparison of distance and angle for high-dimensional features
In our investigation, we quantified the distance and cosine value between the image high-dimensional features of various compounds at differing concentrations (X-Profiler: 512-d; DeepProfiler: 672-d; CellProfiler: 613-d). We intended to enhance our understanding of the model's capacity to discriminate between cellular features post-pharmacological intervention. We determined the cosine similarity of compounds with DMSO, as illustrated in Fig. 3a. The cosine values spanned from − 1 to 1, indicative of an angular spectrum extending from − 180 degrees to 180 degrees. It was observed that the cosine values of toxic versus non-toxic compounds exhibited distinct angles within a high-dimensional space. Although the Mahalanobis distance of the compounds in relation to DMSO did not reveal a marked variance between toxic and non-toxic compounds, we noted that the Mahalanobis distance for varying concentrations within a single compound performed that the distance value augmented concomitant with concentration and these values were utilized to deduce the IC50 values for each compound (Fig. 3b). A comparative analysis of X-Profiler with CellProfiler and DeepProfiler is presented in Fig. 3c. The distribution of the absolute discrepancies between true and predicted IC50 values underscores X-Profiler's superior precision, with a mean and standard deviation for all compounds being 2.66 and 2.94, respectively. In contrast, DeepProfiler and CellProfiler yielded mean values of 4.45 ± 4.84 and 3.48 ± 3.56, respectively. The comparative analysis of IC50 prediction curves for the compound carvedilol by X-Profiler, DeepProfiler, and CellProfiler serves as a compelling exemplar, highlighting X-Profiler's preeminent predictive accuracy in determining IC50 values (Fig. 3d). Utilizing the calculated feature distances, we inferred the IC50 values of the compounds, thereby demonstrating that X-Profiler has great potential to replace traditional IC50 detection methods.
Multiple cell slices enable accurate grasp of the compound property
During the feature extraction phase employed by X-Profiler, we obtained a class embedding for a patch of images, referred to as ‘multiple cells features’ (cls embedding), along with the embedding for each individual image in the patch, termed ‘single cells features’. Our research conducted separate analyses on multiple cells and single cells image features in compound classification tasks. Additionally, we compared the landscape of X-Profiler feature with DeepProfiler and CellProfiler. Herein, the multiple cells features aggregate the mean of 100 single cell slice attributes, whereas the single cells features are a stochastic selection from the entirety of single cell slices (Fig. 4a to Fig. 4f). We selected the first ten compounds (alphabetically sorted) from a set of 100 compounds for the t-SNE plot illustration and presented compound distance in two-dimensional space.
Within our results, we observed that CellProfiler lacks the capability to differentiate changes in cellular phenotype between compounds, regardless of whether they form single cells features clusters or multiple cells features clusters (Fig. 4e, Fig. 4f). Additionally, the single cells feature clusters generated by DeepProfiler also failed to distinguish between compounds. (Fig. 4d). The distance between compounds features from X-Profiler and DeepProfiler is more explicit in the landscape of multiple cell features than in that of single ones. For instance, For instance, the presence of benzethonium chloride and betrixaban compounds is evident within the single cells feature landscape as a cluster (Fig. 4a), while in landscape of multiple cells, they evolve to form discrete clusters (Fig. 4b). This suggests that integrating a greater number of image slices can yield more comprehensive features to accurately predict compound properties. Furthermore, in comparison to X-Profiler, the multiple cells features of DeepProfiler merely attain the level of single-cell clustering as exhibited by X-Profiler (Fig. 4c). We believe that the deployment of convolutional networks within X-Profiler and DeepProfiler might engender more efficacious features for the analysis of cell painting data than traditional statistical algorithms such as CellProfiler, notwithstanding the limited interpretability inherent to these features. Nevertheless, X-Profiler exhibits superior predictive capacity in contrast to DeepProfiler. The incorporation of an attention mechanism within X-Profiler augments its cellular feature aggregation, outperforming DeepProfiler which only calculates the mean of individual cell features. This underscores the importance of leveraging transformer architecture to enhance feature extraction capabilities in intricate and unstructured data.
Our study conducted a comparative examination of single cell-slice image from four compounds (specifically bedaquiline, belzutifan, carvedilol, and daclatasvir) as selected from Fig. 4a. The landscape representation of t-SNE revealed that the cellular embeddings of the drugs belzutifan, carvedilol, and daclatasvir formed a tight cluster, markedly distinct from bedaquiline. Concurrently, the cellular images of the compounds belzutifan, carvedilol, and daclatasvir appeared indistinguishable upon visual inspection (Fig. 4g), and displayed comparable intensity in the computation of Reactive Oxygen Species (ROS) and Mitochondrial Membrane Potential (MMP) under varying concentrations, a characteristic not shared with the compound bedaquiline (Fig. 4h).
In an endeavor to comprehend the results more profoundly, we researched the mechanism of action (MOA) of the three compounds. Despite diverging therapeutic indications - belzutifan for Von Hippel-Lindau (VHL) syndrome-associated clear-cell renal cell carcinoma (ccRCC), carvedilol for hypertension, and daclatasvir for Chronic hepatitis C genotype 3 (GT-3 HCV) - their MOAs suggest that they may exert similar effects on cardiomyocytes. Belzutifan inhibits hypoxia-inducible factor 2α (HIF-2α), and research suggests that HIF-2α inhibitors can reverse pulmonary hypertension and that there are shared pathophysiologic mechanisms between cancer and heart failure40,41. Carvedilol, a nonselective beta-adrenergic antagonist, has anti-free radical and antioxidant effects, and can resist oxidation and reduce ROS production42. It further impedes the cardiac Mitochondrial Permeability Transition (MPT), which can depolarize mitochondrial membranes and uncouple oxidative phosphorylation (OXPHOS)42. Daclatasvir, a pangenotypic NS5A replication complex inhibitor with a dual antiviral effect, inhibits RNA replication and viral assembly. Cellular ROS levels rise during HCV infection, and evidence suggests that anti-RNA viral drugs are associated with intracellular ROS levels43,44. Given that cell phenotype reflects the proper classification of drug mechanisms, the application of deep learning holds substantial promise for future endeavors in drug discovery and therapeutic indication investigations.
X-Profiler can act as an effective cell-slice filter
To showcase the capability of X-Profiler in distilling the most salient single-cell images, we generated an attention heatmap using X-Profiler, which highlighted the cells pertinent to the task throughout the entirety of the image concerning the cardiotoxicity task (Supplementary Fig. 1a and Supplementary Fig. 1b). As indicated by the self-attention mechanism, the similarity between the embeddings of single cell-slice image and the embeddings of the CLS token is positively associated with the classification task45. In the heatmap, cells that are more relevant to the downstream task are represented by brighter and warmer pink dots, and these dots clearly illustrate the differences between different cells in terms of task correlation. In assessing the Transformer's capacity to segregate specific cell slices, we analyzed the attributes of task-relevant single-cell slice images alongside those deemed irrelevant. We presented the landscape of relevant and irrelevant single cells image features in Fig. 5a, in which the dots symbolize task-related images, while inverted triangles represent those unrelated to the task. The single cells image features unrelated to the downstream tasks were indistinguishable among multiple compounds, while the single cells image features related to tasks were separately clustered and widely spaced apart in accordance with their respective compounds. This demonstrates that the multiple cell slices encoder can operate as a cell filter. Two ancillary observations emerged from this clustering exercise: 1) In cellular experiments involving various compounds with distinct properties, there are often both dead cells and unaffected normal cells that form a common group and do not contribute to classification. After passing through the single-cell slice encoder, the features of these cells are similar; 2) Upon exposure to different compounds, the cell phenotypes undergo more significant changes, making them markedly distinct from each other.
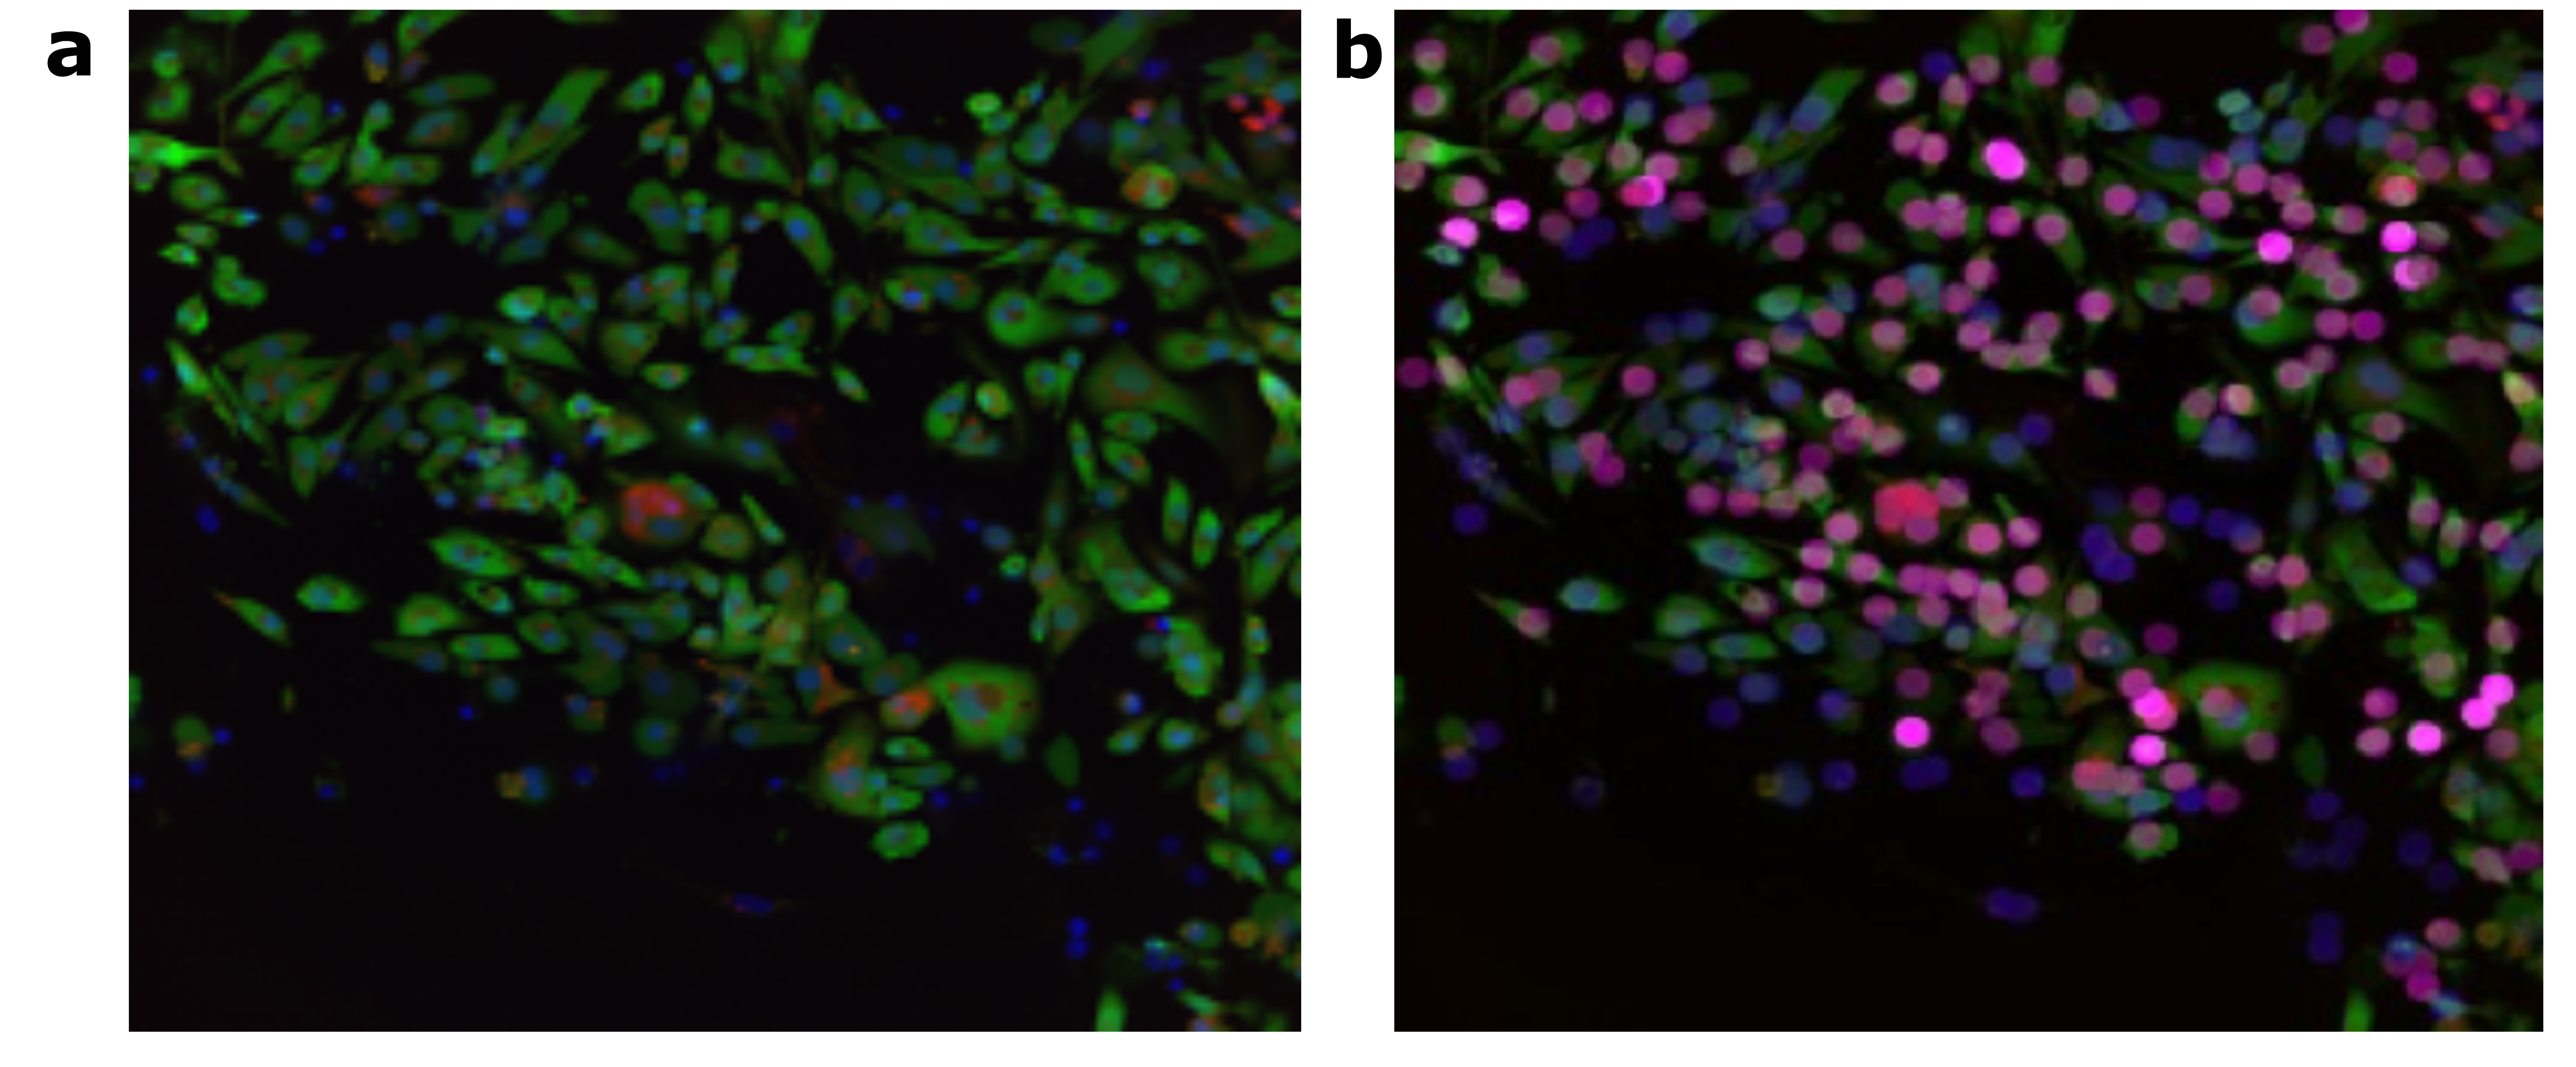
To further demonstrate the screening capabilities of X-Profiler for cell phenotype, we compared cell-slice images that were considered relevant and irrelevant based on the X-Profiler attention map (Fig. 5b). Each cell-slice image was comprised of three channels: nucleus (DNA), mitochondrial membrane potential (MMP) and mitochondrial reactive oxygen species (ROS). Task relevant images exhibited more accurate staining, higher fluorescence intensity, greater contrast between channels compared to the task irrelevant images. Moreover, relevant images exhibited more distinct cell structures in the ROS and MMP channels, leading to more accurate cell identification. In terms of image quality, task relevant images were lucid and free of impurities, in stark contrast to the irrelevant images, which exhibited a halo on the image surface caused by optical structural artifacts, resulting in unclear images and high noise levels.
Cell phenotype images are distinct from general images in two key ways. Primarily, they contain a high degree of redundancy, with dark backgrounds and bright cells dominating most of the image. As a result, it can be challenging to distinguish differences between cells using generic training. Secondly, cell phenotype images are often besieged with noise, resulting from experimental manipulations and batch-to-batch variability, necessitating varied concentration gradients and experimental duplicates to mitigate stochastic influences. Prevalent models and processing techniques have struggled to address these challenges, often yielding poor results. Consequently, the attention mechanism employed in X-Profiler enables the extraction of highly informative, accurate, and structurally intact single-cell slice images, while filtering out low-informative, erroneous, and poor-quality images. This selective extraction has precipitated an increase in the model's prowess following image preprocessing.
Thanks to the advancement of current high-throughput and high-content techniques, enormous biological data are generated every moment to help us gain better understanding of lifes. However, significant noise accompanies the true signal in these data that are generated. For example, cell painting technique allows us to stain various organelles simultaneously, but the capability to use these images to establish biologically relevant models is largely affected by the algorithm we use to distinguish the information from the noise. Current methods, in general, treat every slice of the data, such as each single cell image, equally, and have their limitations in fully utilizing the high content data. Here we propose a deep learning model that has the transformer architecture at its core to effectively assign different weights on different pieces of data. By doing this, we are able to build models that pay more attention to high quality data and less attention to low quality data, which equivalently suppress the affection of noise. The results in this stuty showed that by putting different attentions on different pieces of data, our models achieve better performances in the earlier parts of this study. It is also noted the same approach can be applied to more broader areas to improve the performance of current approaches.
Model parameter selection
Numerous parameters can influence the performance of a model, such as epochs, training batches, learning rate, optimizers, and transformer attention layers, to name a few. In this segment of our research, we evaluated a selection of critical parameters, excluding subjective human expertise. Initially, we explored the variable of patch numbers, a key element of our study, by conducting trials during the training and validation phases with patch numbers ranging from 8 to 12, and during the prediction phase with a broader range from 10 to 750. Our findings indicated that the optimal patch number for training and validation was 8, while during the prediction phase, 100 proved to be most effective. This was evidenced by the superior performance metrics, including accuracy, area under the curve (AUC), and recall, which peaked when the training and validation patch number were set to 8 and demonstrated a plateau in improvement as the prediction patch number reached 100 (Fig. 6a). Regarding the consumption of computing resources, the quantity of patches used during the training and validation phases exhibited no tangible impact on the duration of processing or GPU utilization. Nevertheless, a discernible improvement in resource usage was correlated with an increase in the number of patches designated for the prediction phase (Fig. 6b, Fig. 6c). Additionally, our study encompassed trials concerning the batch size and the attention layers. The outcomes revealed that the batch size bore no significant consequence on the model's performance and the optimal configuration for the attention layers was determined to be three (Supplementary Table 3).