Presence and frequency of clonotypes different from the CRC. PBMC samples were collected from 57 untreated CLL patients. For 25/57 patients, cells were available at 2 separate time points. CD19+CD5+ cells, purified from the PBMCs of each patient or 9 normal control donors27, were used to determine the full length IGHV-D-J sequence as described28. A summary of the IGHV-D-J repertoire data is provided in Table S1.
Two groups of IGHV-D-J sequences were identified in each CLL patient. The first group, invariably the most abundant in every patient, was the CRC, identified at diagnosis by a single IGHV-D-J rearrangement using Sanger methodology, along with subclonal variants differing in various somatic mutations detected by NGS29. The other group consisted of a collection of additional distinct clonotypes (ADCs) bearing IGHV-D-J rearrangements that were different from the leukemic clone and its descendants. Here, we focus on the latter group.
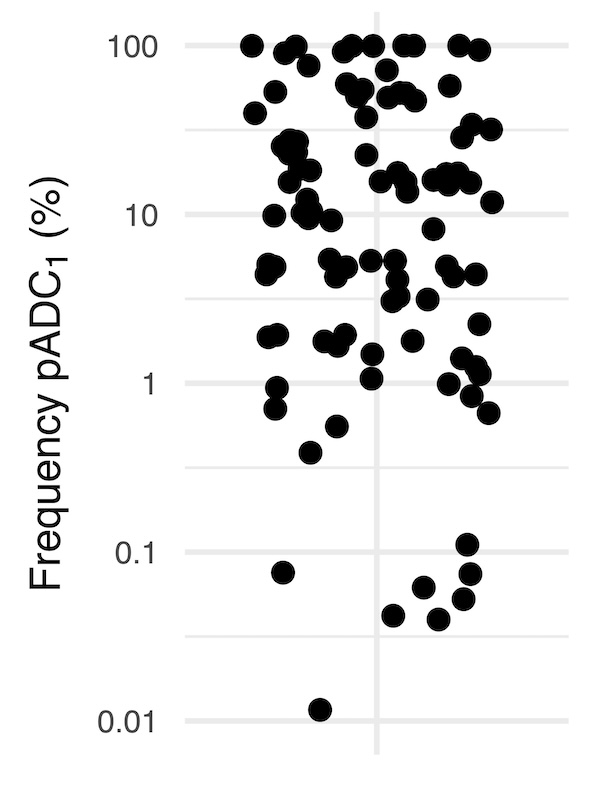
Notably, ADCs were detected in every CLL patient, (Fig. 1A) with an average frequency of 4.8% (0.002–73%) relative to the total number of IGHV-D-J transcripts identified. The sequencing depth and use of Unique Molecular Identifier (UMIs; see Methods) allowed utilization of a sensitivity threshold of 0.01% for reproducible discrimination of expanded ADCs. Based on this threshold, 68% (39/57) of the CLL patients exhibited at least one expanded predominant ADC (pADC1) (Fig. 1B) with an average frequency of 5.5% (0.012–46%) relative to the total number of IGHV-D-J transcripts. The following quantitative analyses were restricted to the 39 CLL patients above this threshold.
ADCs from samples containing 3 pADCs (referred to as pADCs1 − 3), representing > 25% of the total ADCs (excluding the CRC), were defined as multiclonal. According to these criteria, ~ 82% (32/39) of patients had ADCs that fell into the multi-clonal category. (Fig. 1C).
Comparison of ADC size with those of CLL and MBL. The diagnosis of CLL, of high-count MBL, and of low-count MBL requires > 5,000, 500–5,000, and ~ 1–500 monoclonal B cells/µl30–32, respectively. Based on white blood cells count, lymphocyte count, and flow cytometry data (CD5+CD19+ phenotype), we could calculate the absolute numbers of cells from pADC1, pADC2, and pADC3 in the 32 patients. The size of pADC1 qualified as a second CLL clone in 2 patients (6%), as high-count MBL in 8 patients (25%), and as low-count MBL in 22 patients (69%) (Fig. 1D). Extending the analysis to pADC2 and pADC3 and considering the total number of different time points used for the analysis (see also below) indicated that 78% (25/32) of the patients had at least 3 MBL-like expansions at some point in the interval studied. Clonal accumulations of pADCs with numbers consistent with or above the MBL cut-offs were never observed in the CD5+ B cell populations from 9 normal, healthy individuals (Fig. 1D).
Variations of the pADC pattern at different time points. Samples taken at 2 different time points were available for 11 patients.
In ~ 82% (9/11) of patients, the pADC1 remained the dominant clonotype over time (black lines, Fig. 2A), increasing in absolute count in most cases (7/9, 88%). In 22% (2/9) of patients, the pADC1 decreased with time with one pADC1 falling below the diagnostic level for CLL (dashed black line, Fig. 2A). Notably, in the remaining 2 patients (18%, dashed red lines), the pADC1 was replaced by a different clonotype at the second time point.
We then examined the ADCs of the 11 patients for whom there were serial samples to determine if the pADC1 frequency changed over time. In 3 patients (27%), the pADC1 was and remained the only ADC (overlapping blue dashed line at or near 100%, Fig. 2B), so in these cases there was a single ADC. Notably, for these patients, the pADC1 had the highest cell/µl count (green circle, Fig. 2). Also, in 2 of these patients the absolute count of the pADC1 decreased over time (dashed black line, Fig. 2A). In 6/11 (54%) patients, the pADC1 remained the major clonotype, although it increased in relative size (black solid line, Fig. 2B). However, in the remaining two patients (18% - red dashed line, Fig. 2B), the pADC1 was replaced by a different clonotype at the second time point.
The degree of pADC 1 expansion is independent of CRC size. To determine if there was a numerical relationship between the CRC and the pADC1, we correlated the cell count of the CRC with the cell count of the pADC1 (Fig. 3). Notably, Pearson’s correlations failed to demonstrate relationships between pADC1 and CRC, indicating that the level of pADC1 expansion was not directly related to the size of the CRC (Fig. 3).
Comparison between CRC and ADC IGHV-D-J rearrangements. To understand whether the IGHV-D-J rearrangements in ADCs shared features with those found in CLL, we qualitatively compared the two groups. ADCs were analyzed for IGHV gene use and mutation status, VH CDR3 length, and the presence of CLL stereotyped IGHV-D-J rearrangements. To understand if the clonal expansions defined a population with different IGHV-D-J repertoire characteristics, when possible, we divided the ADCs into two groups based on numeric frequency: pADC1 − 3 of each sample and minor ADCs (mADCs) after excluding pADC1 − 3 from each sample.
IGHV gene use. In CLL, IGHV1-69 and IGHV4-34 are two of the most frequently used IGHV genes, which also differ in comparison to healthy adult subjects. Notably, IGHV1-69 is found predominantly in U-CLL, and IGHV4-34 more often in M-CLL10,33. First, we analyzed the frequencies and characteristics of these two genes detected in normal CD5+ cells and in ADCs, and then compared these to those found in a collection of 1,497 CLL cases from our laboratory’s database. In contrast to the other IGHVs, M-IGHV4-34 and U-IGHV1-69 were present at much lower frequencies in control CD5+ B cells (Fig. 4A, open dots and white bars) than in CLL, making them outliers in the gene frequency correlation. Likewise, the frequency of use of M-IGHV4-34 and U-IGHV1-69 among mADCs (Fig. 4B, light blue square dots and bars) diverged considerably from that of CLL. This differed for pADC1 − 3, which were more like CLL. (Fig. 4A-B, dark blue triangle dots and bars).
IGHV mutation status. CLL sequences exhibit a median IGHV mutation frequency of about 1.7%, while this frequency was only 0.7% in pADC1 − 3 and virtually null in the mADC and CD5+ normal B cells (Fig. 4C). Considering the 2% mutation threshold, IGHV-unmutated and IGHV-mutated sequences were equally distributed among CLL (52% and 48%) as well as in pADC1 − 3 (55% and 45%) (Fig. 4D). In contrast, mADCs (72% and 28%) and CD5+ controls (84% and 16%) were unbalanced towards IGHV-unmutated rearrangements (Fig. 4D).
Thus, there were more IGHV-mutated sequences and sequences with higher numbers of mutations in both the CLL and the pADC1 − 3 compared to mADC and CD5+ B cells from normal controls.
IG constant region use. Notably, most rearrangements from ADC and CD5+ normal B cells utilized the IgM isotype, like CLL cells. However, a substantial proportion of IGHV4-34 sequences were isotype class switched to IgG in both CLL and pADC1 − 3 (Fig. 4D).
VH CDR3 length. The U-CLL rearrangements in our series exhibited a bimodal VH CDR3 length distribution (median 22 aa with peaks at 15 aa and 23 aa) (Fig. 4E), while the M-CLL rearrangements had shorter VH CDR3s, more like those of normal CD5+ B cells (median 17 aa). In contrast, in ADCs, the VH CDR3 length distribution of both IGHV-unmutated (median 18 aa) and IGHV-mutated (median 16 aa) IGHV-D-J rearrangements was comparable to that of CD5+ normal B cells.
CLL stereotype-like sequences. Twenty-one of the total 5,846 ADC IGHV-D-J rearrangements (0.36%) were assigned to one of the major CLL stereotyped subsets (Fig. 5). Notably, this frequency was 4-times higher than that in the repertoires from normal CD5+ B cells (0.09%) (Fig. 5A and Bagnara et.al.27), although the stereotype frequency in the ADCs was considerably less than that observed in the CRC (17%; 10/57) from the same CLL cases (Fig. 5B). Moreover, pADCs were not further enriched in CLL stereotypes (not shown), possibly because of the relatively small cohort analyzed.
Finally, only 2 CLL patients had B cells with a stereotyped rearrangement in both CRC and the ADCs (CLL1473 and JB-NC1). Thus, the relative frequency of stereotyped rearrangements increases considerably when moving from a normal CD5+ B-cell population to the ADC population to the CRC.
When counting both CRC and ADCs, we were able to identify more than one CLL stereotyped IGHV-D-J rearrangement in 4 patients (Fig. 5B). For 3 (75%) of these patients, at least 2 IGHV-D-J rearrangements were assigned to the same stereotyped subset exclusively in the ADCs (CLL1046 - #1 and #2 and JB-NC9 - #3) or in the ADCs and CRC (CLL1473 - #201).
Collectively, these data are consistent with a selection for B cells bearing BCR features that in most instances resemble those of mature CLL cells, suggesting that BCR structure and possibly BCR/(auto)antigen binding and signalling are involved in the transition from a normal B cell to a mADC to a pADC to a leukemic CLL cell.