Evolutionary relationships, structure and conserved motif of apple LHCB members
The phylogenetic analysis of 33 MhLHC protein sequences illustrated that the gene family can be categorized into three groups: Group I, Group II, and Group III (Fig. 1a). The results of the conserved motif analysis indicated all of Group Ⅰ contained motif 1 to motif 10, and both Group Ⅱ and Group Ⅲ contained motif 1, motif 2, motif 4, motif 6, and motif 7 (Fig. 1b). There are at least two introns for MhLHCB1, MhLHCB6, MhLHCB2, MhLHCB9, MhLHCA1, MhLHCA2, MhLHCA3, MhLHCA6, and MhLHCA9, while MhLHCB8, MhLHCB7, MhLHCB16, MhLHCB15, MhLHCB21, MhLHCB13, MhLHCB20, and MhLHCB10 contain only one exon (Fig. 1c).
Chromosome distribution and collinearity analysis of the apple MhLHC genes
The chromosome location indicated that the apple MhLHC gene was asymmetrically distributed on 18 chromosomes (Fig. 2a). 5 MhLHC genes were located on the Chr17, with the maximum number, which was followed with 3 MhLHC genes, including in Chr05, Chr07 and Chr09, and lastly 2 MhLHC genes on Chr06, Chr08, Chr10 and Chr15. There were 10 covariant gene pairs between MhLHC genes (Fig. 2b), which deserves special attention is the covariance of the MhLHCB11, MhLHCB4 and MhLHCB17 genes. Simultaneously, MhLHCA10, MhLHCB20, MhLHCB23, MhLHCB22 have co-linear relationship with MhLHCB7, MhLHCB8 and MhLHCA5, MhLHCB14, respectively. In addition, MhLHCB3 and MhLHCB10, MhLHCA9 and MhLHCA6, MhLHCB21 and MhLHCB13 have covariate relationships. Moreover, there was a covariance between MhLHCA7 and MhLHCA2, MhLHCB19 and MhLHCB12, MhLHCA8 and MhLHCA4, and MhLHCB18 with MhLHCB5, for each of them. The findings presented in this study reveal that the production of MhLHC genes could potentially arise from gene duplication occurrences, which segmental duplication events acted as an impelling role in the evolution of MhLHC proteins.
Phylogenetic analysis of LHC family members
Aiming to explore the putative function of the predicted M. halliana LHC, we allocated them to Arabidopsis LHC proteins with known functions. A total of 33 MhLHC proteins in M. halliana and 19 AtLHC proteins in Arabidopsis were analyzed. The phylogenetic tree was predicted using the Neighbor-Joining (NJ) method, followed by performing a Bootstrap analysis with 1000 replications (Fig. 3). The phylogenetic distribution indicated that the LHC proteins can be classified into 3 clades (named Group I, Group II, and Group III) according to the sequence similarity. Among them, Group Ⅲ is more distributed, which contains 31 members, Group Ⅱ includes 14 members, and Group I consists of the least number of members, with 7 members.
Analysis of cis‑acting elements in promoter region of MhLHC gene
To comprehend the cis-acting elements contained in the promoter region of the apple MhLHC gene, 2-kbp sequences upstream of the MhLHC genes were taken and analyzed. The results demonstrated that multiple promoter regions of the cis-acting element-rich MhLHC genes were responsive to auxin, gibberellin, ABA, salicylic acid, MeJA, drought, low temperature, and light (Fig.S1), which suggested that the functions of the MhLHC may include a range of biological processes such as the regulation of plant growth and development, phytohormone signaling, and plant resistance to stresses.
Expression of apple MhLHC genes family members under different abiotic stresses
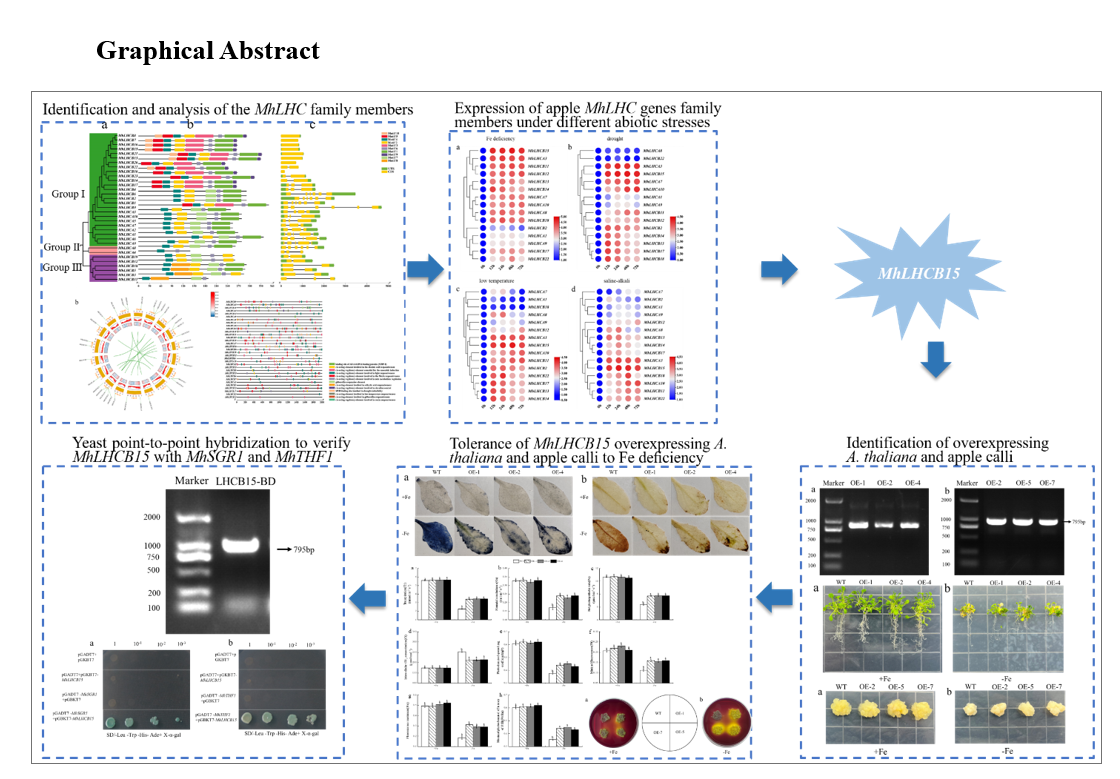
We selected 15 MhLHC genes that are homologous to respond to abiotic stresses in Arabidopsis thaliana and analyzed their relative expression under abiotic stresses such as Fe deficiency, drought, low temperature and saline-alkali, aiming to understand the expression patterns of apple MhLHC family genes under different abiotic stresses (Fig. 4). Among all MhLHC genes, MhLHCB15, MhLHCA3, MhLHCA10 and MhLHCB11 expression were remarkably up-regulated, with a maximum at 72 h under Fe deficiency, drought, low temperature and saline-alkali stress treatments compared to 0 h, of which MhLHCB15 expression was markedly elevated. The expression of MhLHCA1 and MhLHCA7 genes were reduced under low temperature stress and saline-alkali stress, in which MhLHCA7 expression was dramatically raised after 12 h of Fe deficiency and drought stress treatments. It indicates that there are differences in the response mechanisms to abiotic stresses among the genes of the MhLHC family, although most of the genes have similar response mechanisms to different abiotic stresses. To sum up, the expression changes of other genes under abiotic stress were not as remarkable as those of MhLHCB15 under Fe deficiency, which suggested that MhLHCB15 might be involved in the response to Fe deficiency stress.
Analysis of the MhLHCB15 gene
The cDNA of M. halliana seedlings was used as template, and a 795 bp band was obtained (Fig.S2), encodes a total of 264 amino acids and possesses an isoelectric point of 5.29, thereby classifying it as an acidic protein. In addition, the positive and negative residues of MhLHCB15 are 21 and 26, respectively, and the average hydrophobicity is -0.020, which is a hydrophilic protein (Table.S1). This indicates that the protein encoded by MhLHCB15 is an acidic hydrophilic protein. Sequence alignment was carried out to compare the amino acid sequences encoded by MhLHCB15 with those of other organisms, which showed a certain degree of difference at the N-terminal and high similarity at the C-terminal (Fig. 3). Phylogenetic analysis was performed on the amino acid sequences encoded by MhLHCB15 and genes from similar species. MhLHCB15 showed high homology to a protein from Pyrus×bretschneideri (97%) (Fig.S4).
The cis-elements in the sequence 2000 bp upstream of the MhLHCB15 was analysed and multiple cis-elements associated with abiotic stress were found (Table 1), which suggests that MhLHCB15 may exert a crucial part in response to diverse stresses.
Table 1
cis-elements in the genomic sequence 2000 bp upstream of the MhLHCB15
|
cis-acting element
|
Sequence
|
Start sites/bp
|
End sites/bp
|
Function
|
|
G-box
|
TACGTG
|
+ 601
|
+ 607
|
cis-acting regulatory element involved in light responsiveness
|
|
LTR
|
CCGAAA
|
+ 342
|
+ 348
|
cis-acting element involved in low-temperature responsiveness
|
|
ABRE
|
ACGTG
|
+ 602
|
+ 607
|
cis-acting element involved in the abscisic acid responsiveness
|
|
AuxRR-core
|
GGTCCAT
|
+ 1451
|
+ 1458
|
cis-acting regulatory element involved in auxin responsiveness
|
|
P-box
|
CCTTTTG
|
+ 1278
|
+ 1285
|
gibberellin-responsive element
|
|
ARE
|
AAACCA
|
-1067
|
-1073
|
cis-acting regulatory element essential for the anaerobic induction
|
|
MBS
|
CAACTG
|
+ 1334
|
+ 1340
|
MYB binding site involved in drought-inducibility
|
|
TGACG-motif
|
TGACG
|
-655
|
-660
|
cis-acting regulatory element involved in the MeJA-responsiveness
|
Identification of overexpressing A. thaliana and apple calli
The DNA of transgenic A. thaliana and overexpressed apple calli were extracted and characterized by PCR. As shown in the Fig. 5a-b, and the size of the detected electrophoretic bands is consistent with the size of the MhLHCB15 fragment. The expression levels of MhLHCB15 in transgenic A. thaliana and overexpressed apple calli were detected by qRT-PCR. In comparison to the plants with WT plants, the expression levels of MhLHCB15 were higher in transgenic A. thaliana and overexpressed apple calli, indicating that MhLHCB15 was overexpressing (OE) in both (Fig. 5c-d).
Tolerance of MhLHCB15 overexpressing A. thaliana to Fe deficiency
To determine whether MhLHCB15 plays a role in response to Fe deficiency, three transgenic A. thaliana lines (OE-1, OE-2, OE-4) and the wildtype (WT) control were grown for 30 days under Fe-sufficient conditions, then shifted to Fe-sufficient or Fe-deficient conditions for another 20 days. This is shown in Fig. 6, Arabidopsis grew vigorously in normal conditions, and the growth rate was basically the same, while growth was inhibited to varying degrees when exposed to Fe-deficiency stress. Compared with transgenic Arabidopsis, WT control showed more obvious chlorosis and wilting.
As shown in Fig.S5, the three transgenic lines exhibited a remarkable increase in chl a, chl b car and chl a + b under Fe-deficient conditions when compared with WT, whereas they did not differ from WT under Fe-sufficient conditions. As can be seen from Fig. 7a-d, Tr, Gs and Pn of leaves showed a continuous decrease after Fe deficiency, though it was higher in transgenic plants compared to WT. However, the Ci content tended to be elevated, and the increase was more pronounced in the MhLHCB15-OE plants. The qP, F0, Fm, and Fv/Fm of both transgenic and WT plants exhibited a declining trend under Fe deficiency, which was lower in transgenic plants (Fig. 7e-h). The SOD, POD and CAT activities of transgenic and WT A. thaliana have been measured (Fig.S5e-g). Under Fe-deficient conditions, all measured parameters (SOD, POD and CAT) were much higher in transgenic A. thaliana than in WT controls. In addition, both Pro and MDA were remarkably elevated under Fe deficiency, and the Pro content was greater in the MhLHCB15-OE A. thaliana than in the WT strain, while the MDA content was also below that of the WT (Fig.S5h-i). The accumulation of H2O2 and O2− in transgenic Arabidopsis leaves in Fe-deficient conditions was significantly lower than that of the WT, with no obvious difference under normal conditions (Fig. 8a-b, Fig.S6a-b). The results demonstrated that the Fe2+ content and FCR activity were substantially higher than those of the WT control (Fig. 8c-d). Eventually, the content of soluble sugars, starch and soluble proteins was reduced in Fe deficiency, whereas it was greater in transgenic plants than in WT (Fig.S6c-e).
To further investigate the role of MhLHCB15 in the Fe signaling pathway, the expression levels of Fe uptake-related genes in Arabidopsis plants overexpressing MhLHCB15 were examined by qRT-PCR (Fig.S7). The results illustrated that the expression levels of Fe uptake-related genes (AtAHA2, AtAHA8, AtFRO2, AtIRT1 and AtFIT) were decreased in overexpressed Arabidopsis plants under Fe deficiency stress, but the expression of MhLHCB15-OE was higher than that of WT. All the above results indicated that MhLHCB15 enhanced the tolerance of A. thaliana under Fe deficient stress.
Tolerance of MhLHCB15 overexpressing apple calli to Fe deficiency
It is clear from Fig. 9a-b that there was no apparent difference in the growth status of overexpressed and WT apple calli under Fe-sufficient conditions. Nevertheless, the growth status of overexpressed and WT apple calli varied greatly under Fe deficient conditions, and the transgenic calli performed better than the WT apple calli.
In addition, the POD, SOD, and CAT activities of transgenic lines (OE-2, OE-5, and OE-7) diverse from those of WT tobacco under Fe deficiency stress, whose enzyme activities were considerably higher than those of the WT (Fig.S8a-c). In parallel, the transgenic lines Pro content was more than that of WT, while the MDA content was remarkably inferior to that of WT (Fig.S8d-e). It is evident from Fig.S8f-g that the accumulation of H2O2 and O2− in transgenic Arabidopsis leaves was markedly less than that of the WT at Fe deficiency, which was not appreciably dissimilar under normal conditions. Meanwhile, the transgenic lines with higher values of FCR activity and total Fe content when compared to the WT control lines (Fig. 9c-d). It is obvious from Fig.S8h-j that soluble sugar, starch, and soluble protein contents of transgenic Arabidopsis leaves dropped significantly when exposed to Fe deficiency, whereas the transgenic plants were notably superior to those of the WT. Additionally, bromocresol violet staining in yellow indicated that the MhLHCB15 transgenic calli pumped more H+ into the medium under Fe deficient conditions compared with the WT control (Fig. 10).
With a view to exploring further the role of MhLHCB15 in the Fe signaling pathway, the expression levels of Fe uptake-related genes were assayed in apple calli overexpressing MhLHCB15 by qRT-PCR (Fig. S9). In a word, these results demonstrate that homologous expression of MhLHCB15 in apple calli can respond to Fe deficiency and reinforce its tolerance to stress.
Construction of decoy vectors pGBKT7- MhLHCB15 and self-activation assays
The results showed successful amplification of the target bands of approximately 795 bp (Fig.S10), which indicated he successful construction of the recombinant bait vector pGBKT7-MhLHCB15. The bait vector and positive control were then transferred into yeast Y2H Gold receptor cells to verify the self-activation activities. It showed that the bacterial fluids containing the bait vector and the positive control could grow normally in SD/-Trp-Leu medium, but only the positive control had blue colonies in SD/-Trp-Leu/X-a-Gal medium, and the bait vector could not grow (Fig. 11), which demonstrated that the bait vector did not have self-activation activity, and it could be used for the screening of interacting proteins.
Yeast point-to-point hybridization to verify MhLHCB15 with MhSGR1 and MhTHF1
When the candidate interacting proteins MhSGR1 and MhTHF1 were co-transfected into yeast with pGBKT7-MhLHCB15 bait vector, respectively, which displayed that all the colonies were able to grow on SD/-Trp/-Leu/-His/-Ade/X-α-Gal plates and turned blue (Fig. 11), thus further confirming that the two proteins interacted with the MhLHCB15 proteins in yeast.