Study subjects
Seventy-three COVID-19 convalescents, with a median of 54 days after illness onset caused by ancestral SARS-CoV-2 infection, were recruited from Shaoyang city, Hunan Province, China (Table 1). During days 236–718 after illness onset, 25 of these convalescents received a standard inactivated vaccine regimen (Table 5) and were designated as the convalescents with vaccination group. Eighty-nine vaccinees who received a standard inactivated vaccine regimen (Sino Vac) were recruited from Chenzhou city, Hunan Province (Table 2), China; 25 of these individuals received a third booster dose (Table 6) during days 271–303 after their first vaccination. Sex- and age-matched healthy controls were recruited before the pandemic. All participants were routinely tested for SARS-CoV-2 or its variants by qualified authorities, and no exposure or infection cases were reported in these cohorts. This study was approved by the Institutional Ethical Review Board of The Central Hospital of Shaoyang, Hunan Province, China (V.1.0, 20200301) and The First People's Hospital of Chenzhou, Hunan Province, China (V.3.0, 2021001). Informed consent was obtained from each participant, who signed written consent forms. Blood samples (20 ml) were obtained from each subject. Peripheral blood mononuclear cells (PBMCs) and plasma were isolated and stored in liquid nitrogen and in a -80 ℃ freezer, respectively.
Cell lines
Human embryonic kidney freestyle 293 cells (293F) (Gibco, New York, USA) and Sf9 insect cells (Gibco, New York, USA) were used in this study for recombinant protein expression. HEK293T cells stably expressing human ACE2 (HEK293T-ACE2) were generated by lentiviral-ACE2 transduction in our laboratory for the pseudotyped virus neutralization assay65. 293F cells were grown in serum-free FreeStyle 293 Expression Medium (Gibco, New York, USA) at 37 ℃ and 8% CO2 with shaking at 125 rpm. Sf9 cells were cultured in Sf-900 II SFM (Gibco, New York, USA) at 27 ℃. HEK293T-ACE2 cells were maintained in DMEM (Gibco, New York, USA) with 10% fetal bovine serum (FBS), 1% penicillin-streptomycin, 1% minimum essential medium (MEM) nonessential amino acids, and 1% sodium pyruvate at 37 ℃ and 5% CO2.
Recombinant protein expression and purification
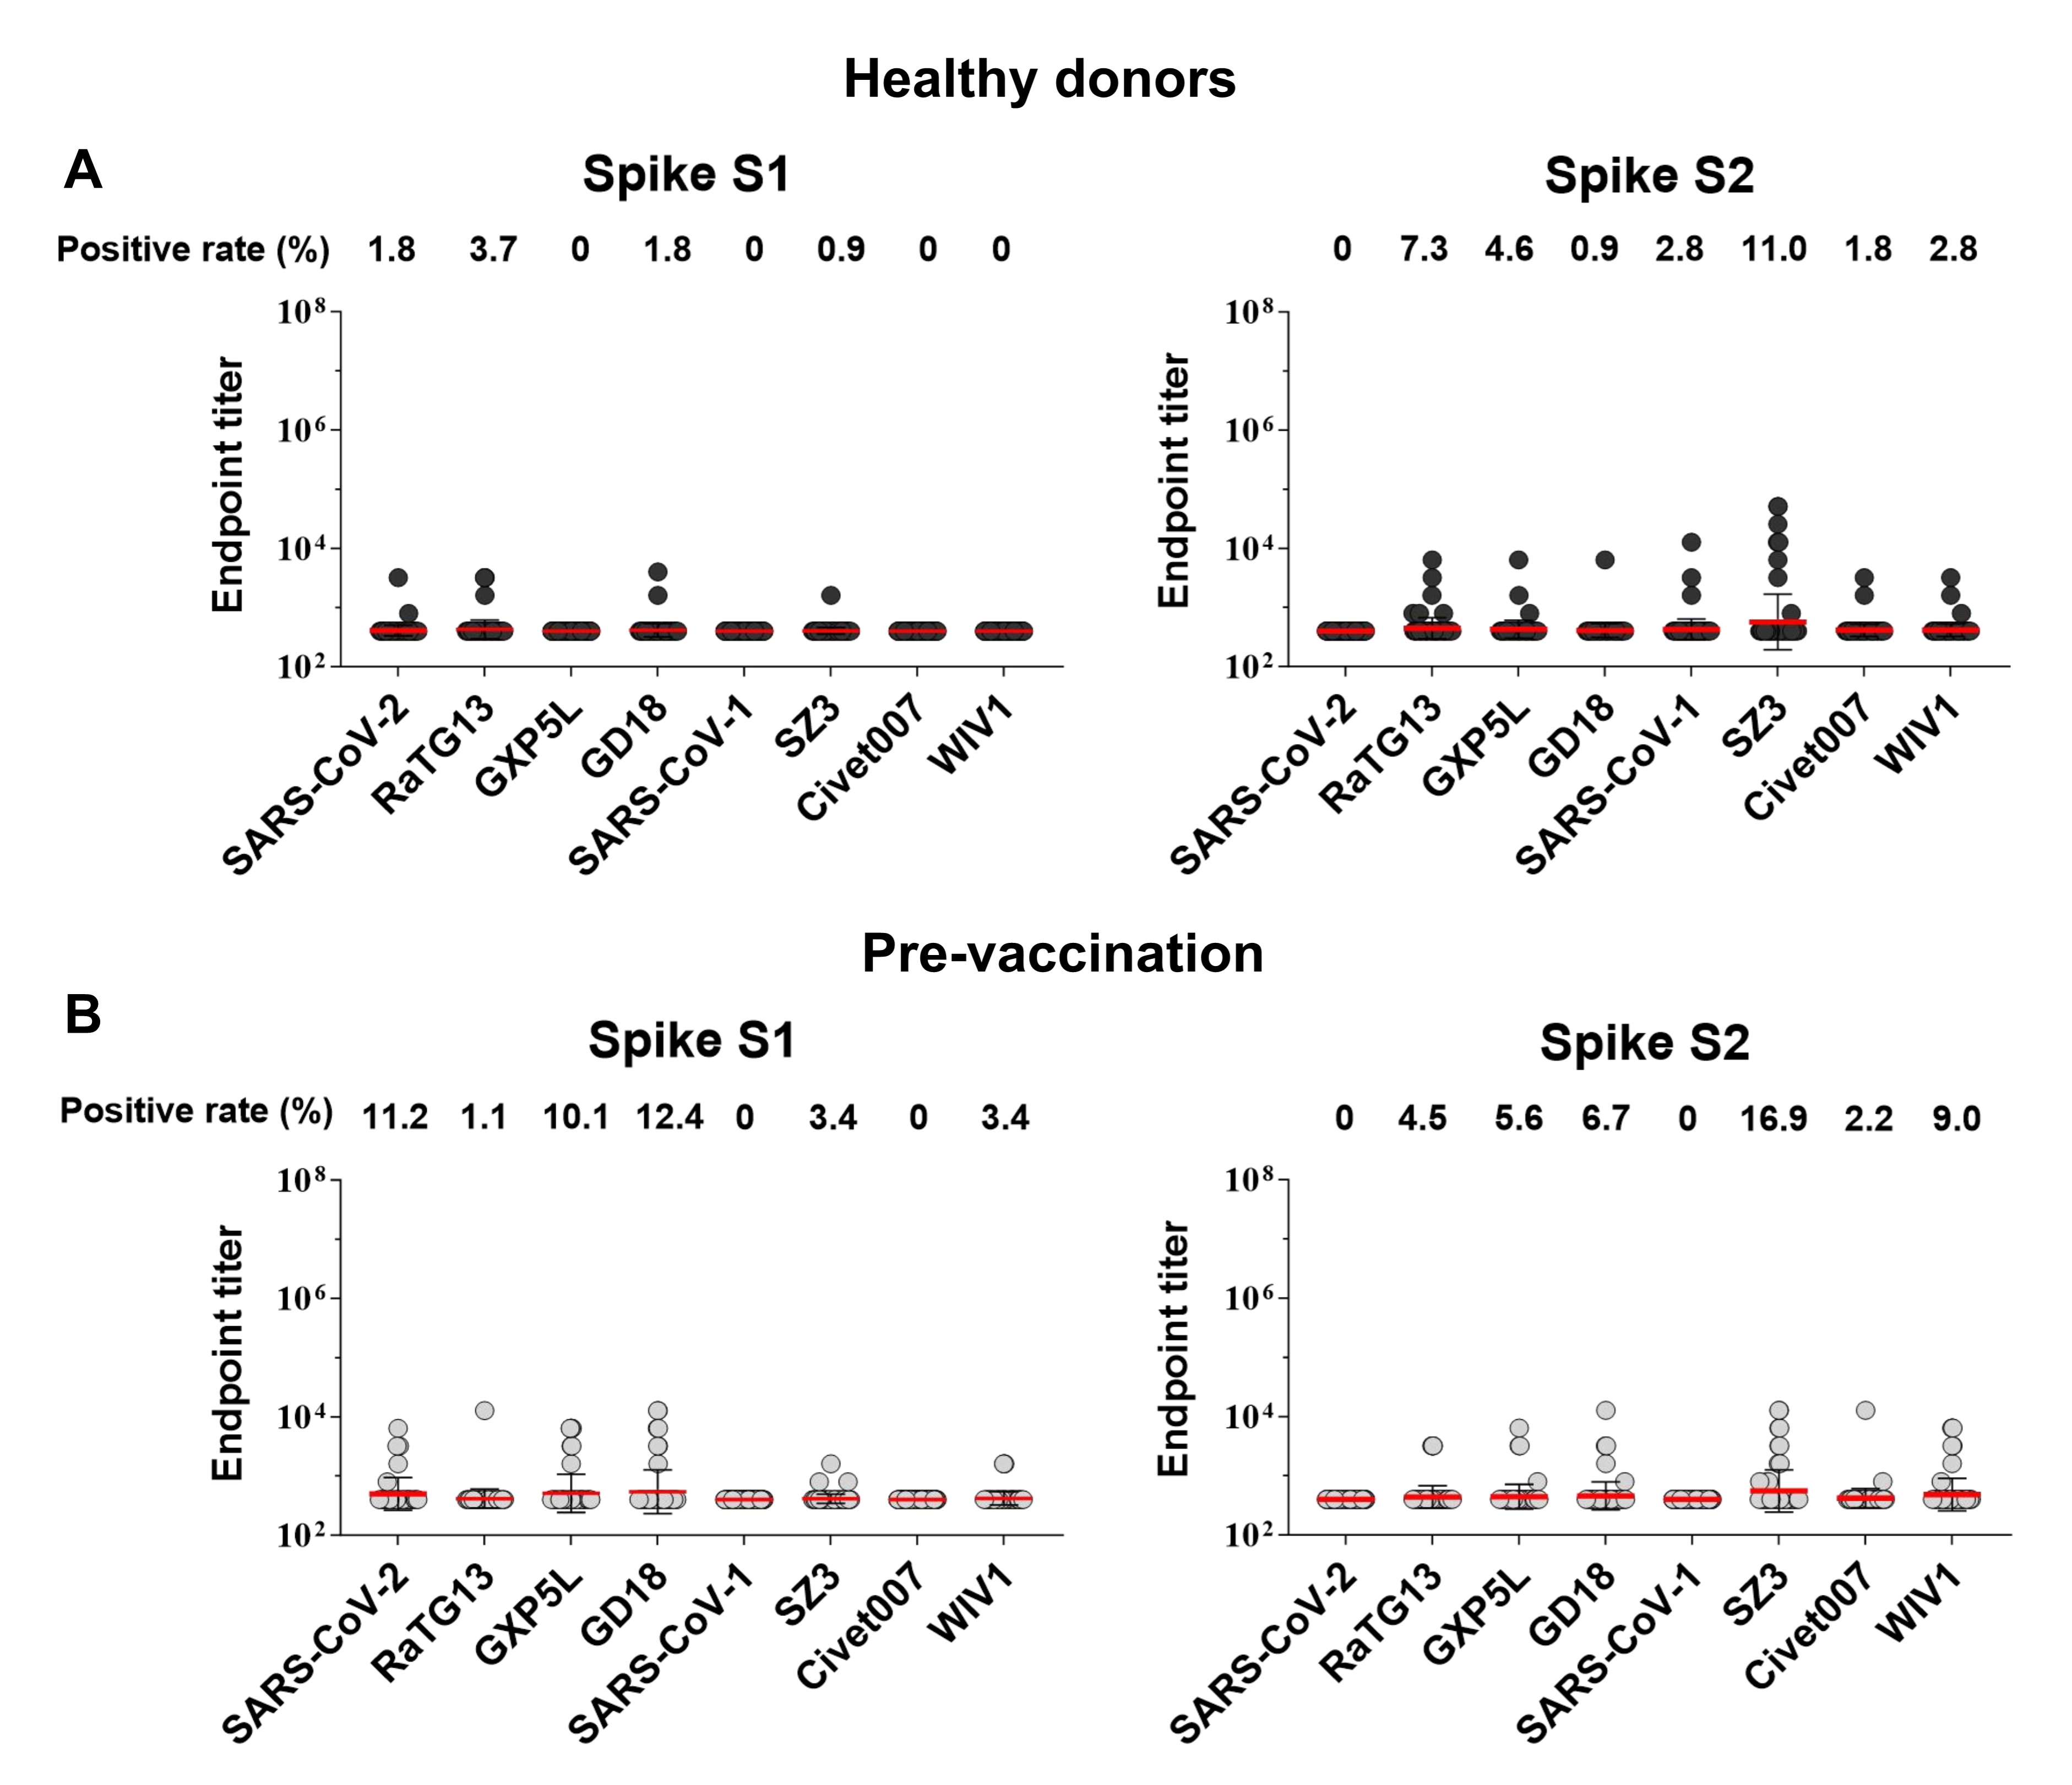
To test the plasma and monoclonal antibody binding reactivities to distinct sarbecovirus spike proteins, the spike S1 and S2 regions from SARS-CoV-2 (GenBank accession number: YP_009724390.1), SARS-CoV-1 (Y463060.1), RaTG13 (MN996532.2), GX-P5L (MT040335.1), GD18 (MT799524.1), SZ3 (AY304486.1), Civet007 (GAY572034.1), and WIV1 (KC881007.1) were commercially synthesized (Genscript, Nanjing, China). The S1 open reading frames were cloned into the pcDNA3.1 vector and expressed in 293F cells. The expressed S1 protein subunits were purified using a Strep-Tactin Superflow high-capacity cartridge (IBA Lifesciences, Göttingen, Germany) in an ÄKTA pure system (Cytiva, Marlborough, USA). The S2 open reading frames were cloned into the pQB vector and expressed using Sf9 cells. In brief, S2-expressing plasmids and BacIIIG bacmid vectors were co-transfected into Sf9 cells by FuGENE HD according to the manufacturer’s instructions (Promega, Wisconsin, USA). After 5 days, the cell culture supernatant containing the first generation of recombinant baculovirus (P0 virus) was harvested and stored. Working viruses expressing the target protein subunit were produced by two rounds of infection, followed by the production of recombinant spike S2 protein subunits via infection of Sf9 cells with these working viruses. The cell culture supernatants containing spike S2 protein subunits were harvested and purified using a Strep-Tactin Superflow high-capacity cartridge (IBA Lifesciences, Göttingen, Germany) in an ÄKTA pure system (Cytiva, Marlborough, USA).
ELISA
Sarbecovirus spike (S1 and S2)-specific antibody titers in COVID-19 convalescents and vaccinees were determined by ELISA. In brief, 96-well plates (Corning, NY, USA) were coated with sarbecovirus spike protein subunits (S1 or S2, 200 ng/well) in phosphate-buffered saline (PBS) and incubated at 4 ℃ overnight. The plates were washed five times with PBS-T (0.05% Tween-20 in PBS) and then blocked with blocking buffer (2% FBS and 2% bovine serum albumin (BSA) in PBS-T) for 30 min. Two-fold serial dilutions of plasma, starting from a 1:20 dilution, were added to the 96-well plates in triplicate (100 µL/well) and incubated for 1 h at room temperature. Spike S1 and S2-specific antibodies were detected using horseradish peroxidase (HRP)-conjugated anti-human IgG (Jackson ImmunoResearch, PA, USA). Plasma samples collected from healthy subjects before the COVID-19 pandemic were used as negative controls, and SARS-CoV-2 spike RBD-specific monoclonal antibody was generated in the laboratory and used as a positive control66. The optical density at 450 nm (OD450) was measured for each reaction, and an OD450 value three-fold greater than the cut-off value (i.e., the average OD450 value of healthy controls) was considered a positive readout. The highest dilution with a positive readout was defined as the endpoint titer of the antibody response, and the data were logarithmically transformed. Plasma spike-specific antibody avidity was determined based on ELISA with an additional sodium thiocyanate (NaSCN) treatment at 100 µL/well for 15 min at room temperature. The avidity index was calculated using the formula: Avidity Index = [ODNaSCN 1 M/ODNaSCN 0 M] × 100, as previously reported67. For mAb binding, a similar assay was performed with 10-fold dilutions of mAbs, and data are presented as EC50 values.
Pseudotyped virus production and neutralization assay
Sarbecovirus pseudotyped particles were produced by co-transfecting HEK293T cells with spike-expressing plasmids and pPNL4-3 vector containing a luciferase reporter using PEI reagent (Polysciences, Pennsylvania, USA). Briefly, HEK293T cells were seeded in a 10-cm dish (Corning Costar, Massachusetts, USA) and grown to 80% confluency before transfection. The S-encoding plasmids and pPNL4-3 vector were co-transfected into HEK293T cells at a ratio of 1:3. At 48 h after transfection, the supernatant was harvested by centrifugation at 4,000 × g for 15 min and then filtered through a 0.22-µm filter. All pseudotyped particles were aliquoted and stored at -80 ℃ until use.
Neutralization assays were performed by incubating pseudotyped virus particles with mAbs or heat-inactivated plasma, and neutralization was measured by the reduction in luciferase intensity65. One day prior to infection, HEK293T-ACE2 cells were seeded at a density of 1×10⁴ cells/well in a 96-well plate. The following day, serial dilutions of plasma starting with a 1:30 dilution or mAbs starting with a 100 µg/mL dilution were made in a 96-well cell culture plate for 12 dilutions, and diluted pseudotyped virus particles were added to the plate and incubated at 37 ℃ for 60 min. After incubation, the plasma or mAbs–virus mixture was added to the cells and centrifuged at 800 × g for 30 min. Following infection for 48 h, cells were lysed using 1× luciferase cell culture lysis buffer (Promega, Wisconsin, USA), and luciferase intensity was measured using the Luciferase Assay System (Promega, Wisconsin, USA) on a Varioskan Flash Multimode Reader (Thermo Fisher Scientific, Massachusetts, USA). Plasma from healthy controls and non-related mAb were used as negative controls. Broad nAb S309 was used as a positive control.
Spike-specific single memory B-cell sorting
Single spike-specific memory B cells were sorted from COVID-19 convalescents and vaccinees to generate mAbs. SARS-CoV-2 spike (Sino Biological, Beijing, China) was labeled with Alexa Fluor 488 and Alexa Fluor 647 (Invitrogen, California, USA) and used as probes to identify spike-specific memory B cells. PBMCs from convalescents or vaccinees were allowed to grow for 3 h after thawing and were then stained with Live/Dead reagent (Invitrogen, California, USA) at 4 ℃ for 30 min. Cells were washed twice with staining buffer (PBS, 1% FBS) and stained with the SARS-CoV-2 spike probes. After a 30-min incubation, cells were washed twice with staining buffer and stained with antibodies BUV373 mouse anti-human CD3 (SK7) (BD Biosciences, New Jersey, USA), PerCP cy5.5 mouse anti-human CD19 (HIB19) (BioLegend, California, USA), PE cy7 mouse anti-human CD27 (M-T271) (BioLegend, California, USA), PE/Dazzle™ 594 mouse anti-human IgD (IA6-2) (BioLegend, California, USA), and PE mouse anti-human IgG (G18-145) (BD Biosciences, New Jersey, USA), at 4 ℃ for an additional 30 min. After washing, the cells were resuspended for sorting in 10% FBS/Roswell Park Memorial Institute (RPMI) 1640 medium. The cells were sorted on a Beckman Coulter MoFlo XDP instrument. Spike-specific memory B cells were gated as CD3−CD19+CD27+IgD−IgG+spike-AF488+ and AF647+ B cells. Single spike-specific memory B cells were sorted into the wells of a 96-well PCR plate (Thermo Fisher Scientific, Massachusetts, USA), with each well containing 7 µL lysis buffer (1.75 µL 10× PBS, 5 mM dithiothreitol (DTT), 1% IGEPAL, 20 ng/µL random primers, and 2 U/µL RNAsin). The plate was immediately spun down and put on dry ice until further use.
Antibody gene amplification and mAb production
Total RNA from the sorted single cells was reverse-transcribed using SuperScript IV reverse transcriptase (Thermo Fisher Scientific, Massachusetts, USA), and antibody variable region genes were amplified by nested PCR68. The 96-well plate containing sorted single cells was incubated at 68 ℃ for 1 min and then transferred back onto ice. Then, RT reaction mix (0.2 µL of RNAsin, 40 U/µL, 2.2 µL H2O, 1.05 µL DTT, 0.5 µL dNTPs, 2.8 µL of 5× SuperScript IV buffer, and 0.25 µL SuperScript IV) was added to each well. Reverse transcription was performed at 42 ℃ for 5 min, 25 ℃ for 10 min, 50 ℃ for 60 min, and 94 ℃ for 5 min. Next, antibody variable regions (VH, Vκ, and Vλ) were amplified by nested PCR using IgG-specific primers and HotStarTaq DNA Polymerase (Qiagen, Nordrhein-Westfalen, Germany), as previously described68. The PCR products were purified and sequenced to determine the sequences of the H and κ/λ chains. The sequences of the variable regions of the mAbs were then synthesized and separately inserted into Ig heavy- or light-chain expression vectors (AbVec2.0-IGHG1, AbVec1.1-IGKC, and AbVec1.1-IGLC2-XhoI). The antibody gene usage was determined using IgBLAST.
The plasmids carrying paired heavy and light chain genes were co-transfected into 293F cells at a 1:2 ratio using polyethylenimine (PEI, Polysciences, Pennsylvania, USA). After 5 days, the culture supernatant was harvested and filtered through a 0.22-µm filter. The expressed antibodies in supernatant were purified using HiTrap Protein A HP columns (Cytiva, Marlborough, USA) in an ÄKTA pure system (Cytiva, Marlborough, USA).
ACE2 binding assay
ACE2 binding was examined by ELISA with slight modifications. A 96-well ELISA plate coated with SARS-CoV-2 RBD protein (2 µg/ml, 100 µL/well) was blocked and incubated with mAbs (10 µg/ml, 100 µL/well) and biotin–ACE2 (Sino Biological, China) at 37 ℃ for 1 h. After washing, streptavidin/HRP (1:2000 dilution; Solarbio, China) was added and incubated at 37 ℃ for 1h. The plate was then developed with 100 µL of 3,3',5,5'-tetramethylbenzidine dihydrochloride (TMB), terminated by the addition of 50 µL of 1 M H2SO4, and assessed for the OD450. A positive control (biotin–ACE2 protein without mAbs) and a blank control (blocking buffer only) were included. The percentage of inhibition of ACE2 binding was calculated using the following equation:
$$\% ACE2 binding inℎibition=100\ast (1-\frac{sample mean-mean of blank}{mean of positive control-mean of blank})$$
Biolayer interferometry (BLI) assay
The binding affinities between mAbs and SARS-CoV-1/2 RBD proteins were measured by BLI assay using an Octet RH16 instrument (Sartorius, Germany). All mAbs and RBDs were diluted in assay buffer (0.1% w/v BSA and 0.02% Tween-20 in PBS). mAbs were initially bound to the proA biosensor for 90 s. After a washing step using assay buffer, the sensor-bound mAbs were exposed to wells containing serial dilutions of RBDs in assay buffer for 120 s. The sensors were then placed in assay buffer for dissociation for up to 300 s, and assay buffer without antibody was used to correct for background. The results were analyzed using Data Analysis 12.0 software to determine the Kon, Koff, and KD values for the two different RBDs.
Statistical analysis
The Kolmogorov–Smirnov test was employed to assess normality prior to conducting the comparison. Data with non-normally distributed variables were expressed as medians ± IQRs (interquartile ranges). Spearman’s rank correlation coefficient was utilized to analyze the correlation between neutralization titer and neutralization breadth. For paired sample comparisons, paired t-tests were used to analyze the differences between two groups. Mann–Whitney U tests were used to analyze two independent variables. To compare the CDR3 length and SHM number, Kruskal–Wallis tests with post hoc Dunn’s multiple comparisons tests were conducted. GraphPad Prism v.9.0 and SPSS v.26 were used for all data analyses, A P value less than 0.05 was considered to be significant, denoted as *, P < 0.05; **, P < 0.01; ***, P < 0.005; ****, P < 0.001. ns, not significant. Unless otherwise stated, all numerical data presented in this study were obtained from at least three independent experiments.