Isolation and culture of adult mouse primary cardiomyocytes
Mouse cardiomyocytes were isolated from WT mice using Liberase enzymatic digestion as previously described [14].
Cell co-culturing
The cell co-culturing system was performed using Corning Transwell chambers (0.4 µm pores, 6.5 mm diameter) where primary cardiomyocytes from adult wild-type C57 mouse were hypoxia-injured (in low-glucose DMEM without FBS, incubated in a 37°C air-tight incubator with 0.1%O2, 5% CO2 balanced by N2 for 6 hours) in the upper well, subsequently reoxygenated (back to high-glucose DMEM with 10% FBS), and concurrently inserted into lower well laid with RAW264.7 followed by incremental periods of co-culturing.
RNA isolation and quantitative PCR (qPCR)
Total RNA was extracted with TRIZOL reagent (93289, Sigma) according to the manufacturer’s protocol and quantified using a Nanodrop 2000. Total RNAs (1000ng) were used to perform the reverse transcription with the PrimeScript RT reagent kit (Takara, DRR037A). To determine relative mRNA abundance, qPCR was performed with SYBR Green Master Mix (Yeason) on an ABI StepOnePlus system according to the manufacturer’s protocol. Data were analyzed with StepOnePlus software. The primers were synthesized from Tsingke Biotechnology and sequence information is provided in Supplementary Table 1. Mouse 18S was used for normalization. The experiment was repeated three times.
For RNA-seq, after RNA extraction and quantification, Oliago(dT)-attached magnetic beads were used to purify mRNA. Purified mRNA was fragmented into small pieces with fragment buffer at an appropriate temperature. Then First-strand cDNA was generated using random hexamer-primed reverse transcription, followed by second-strand cDNA synthesis. Afterward, A-Tailing Mix and RNA Index Adapters were added by incubating to end repair. The cDNA fragments obtained from the previous step were amplified by PCR, and products were purified by Ampure XP Beads, then dissolved in EB solution. The product was validated on the Agilent Technologies 2100 bioanalyzer for quality control. The double-stranded PCR products from the previous step were heated denatured and circularized by the splint oligo sequence to get the final library. The single-strand circle DNA (ssCir DNA) was formatted as the final library. The final library was amplified with phi29 to make a DNA nanoball (DNB) which had more than 300 copies of one molecular. DNBs were loaded into the patterned nanoarray and single end 50 bases reads were generated on the BGIseq500 platform (BGI-Shenzhen, China). The sequencing data was filtered with SOAPnuke (v1.5.2) by (1) Removing reads containing sequencing adapter; (2) Removing reads whose low-quality base ratio (base quality less than or equal to 5) is more than 20%; (3) Removing reads whose unknown base ('N' base) ratio is more than 5%, afterward clean reads were obtained and stored in FASTQ format. The clean reads were mapped to the reference genome using HISAT2 (v2.0.4). Bowtie2 (v2.2.5) was applied to align the clean reads to the reference coding gene set, then the expression level of the gene was calculated by RSEM (v1.2.12). The heatmap was drawn by heatmap (v1.0.8) according to the gene expression in different samples. Essentially, differential expression analysis was performed using the DESeq2 (v1.4.5) [with Qvalue ≤ 0. 05. To take an insight into the change of phenotype, GO (http://www.geneontology.org/ ) and KEGG(https://www.kegg.jp/) enrichment analysis of annotated different expressed genes was performed by Phyper (https://en.wikipedia.org/wiki/Hypergeometric_distribution ) based on Hypergeometric test. The significant levels of terms and pathways were corrected by Q value with a rigorous threshold (Qvalue ≤ 0. 05) by Bonferroni.
Protein sample preparation, IP-MS, and Western blotting assay
Total proteins were extracted in RIPA lysis buffer (Beyotime, China) supplemented with a Complete Mini protease inhibitor cocktail (Roche, 11836153001). The protein concentration was determined by the BCA protein assay kit (Bio-Rad, 5000006JA).
For immunoprecipitation (IP), the Pierce Classic IP Kit (Thermo Scientific™, 26146) was utilized according to the manufacturer’s protocol.
For identification of shep1-interacting proteins, liquid chromatography-tandem mass spectrometry (LC-MS/MS) analysis was performed. Immunoprecipitates were separated with SDS–PAGE and the gel was stained with Coomassie brilliant blue for protein band visualizing. The entire lane was cut into 1cm gel slices and subjected to in-gel digestion. The mass spectrometry analysis was conducted by PTM-BIO (China). The ranking of the identified proteins was based on the peptide coverage of each identification. The related proteins were selected and subjected to further validation by immunoprecipitation and immunoblot. This study focused on G3BP1.
After quantified, protein samples (10–20 µg) were loaded on SDS-polyacrylamide gels for electrophoresis and then transferred to PVDF membranes. After blocking with 5% BSA for 1 h, the membranes were incubated with primary antibodies overnight at 4°C. After the subsequent washes, the membranes were incubated with horseradish peroxidase (HRP)-conjugated secondary antibodies (Weiao Biological Company, China) at room temperature for 1 h. The blots were visualized and detected by Chemiluminescence Reaction (LuminataTM Forte, Millipore, USA) and ChemiDocTM Imaging System (Bio-Rad, CA, US). The density of the protein blots was analyzed by ImageJ (Version 1.53c, NIH, USA). Detailed information on the primary antibodies used in immunoblotting, including source, catalog number, and dilution, is listed in Supplementary Table 2. We also provide full scans of all the blots as Supplementary Dataset.
Migration wound healing
Migration assays were performed using Corning Transwell chambers (8 µm pores, 6.5 mm diameter, USA). Primary cardiomyocytes were isolated from adult wild-type C57 mice, laid in the lower wells, and exposed to H/R injury. After reoxygenation, RAW264.7 cells were seeded in the upper chambers containing FBS-free DMEM. After 24 h of co-culture, cells that traversed through the membrane were fixed with 4% PFA for 30 min and stained with 0.05% crystal violet solution (Solarbio, China) for 20 min.
A wound-healing assay was conducted in 6-well plates by scratching the cell monolayer with a 200 µl pipette tip. Cells were washed with PBS twice and cultured in conditional media of H/R cardiomyocytes. Images were collected at the beginning and 24 h after scratching. The wound-healing speed was calculated as the ratio of the healed areas at 24 h to the original injured areas.
RNA interference
RAW264.7 cells were transfected with siRNAs by Lipofectamine™ 3000 transfection reagent (Invitrogen™, L3000150) for 48h before stimulation according to the manufacturer’s instruction. The siRNAs used were as follows: si-cGAS (5'-CGGCAGCUAUUAUGAACAU-3'), si-G3BP1(5′-CCCTATGGAAATCATTCCT-3′).
Mice
Mice were fed with a standard rodent chow diet and housed in micro isolator cages in a special pathogen-free facility. The number of animals in each experimental group is indicated in the tables or figure legends. This study and all animal procedures conformed to the Guide for the Care and Use of Laboratory Animals, published by the National Institutes of Health (NIH publication NO. 85 − 23, revised 1996), and were approved by the animal care and use committee of Fudan University.
Wild-type (WT) C57BL6/J mice (male, 14–16 weeks old; SLRC Laboratory Animal, Shanghai, China) were used in this study.
Myeloid-specific SHEP1-deficient mice were generated by crossing SHEP1fl/fl mice with LysM-Cre mice and are designated as LysM Cre+ SHEP1fl/fl (CKO) in this paper (constructed by Cyagen Biosciences Inc. China). For experiments described in this paper, adult male mice (14 to 16 weeks of age) were used.
EGCG administration: Mice were intraperitoneally injected with EGCG (40mg/kg) right after reperfusion, and afterward once a day for 3 days.
Cardiac I/R injury model
Mice underwent surgical cardiac I/R injury as described previously [13]. Briefly, the mice were anesthetized with 2% isoflurane inhalation using an isoflurane delivery system. Subsequently, a small skin cut (1.2 cm) was made over the left chest, and the left anterior descending coronary artery (LAD) was ligated via a slipknot using 6–0 silk for 45 min before the slipknot was gently loosened to induce reperfusion injury. The suture was passed 2–3 mm below the tip of the left auricle. Sham-operated animals underwent the same procedure without tying the slipknot.
Triphenyltetrazolium chloride (TTC) staining
TTC staining was conducted for evaluation of cardiac infarction size. After the mice were anesthetized with 2% isoflurane, the slipknot was tied again, and 1% Evans blue (w/v, Sigma, USA) was injected into the aortic root to perfuse the left ventricle. Then, the heart was rapidly excised, cut into 1 mm slices, and incubated with 1% TTC solution (Sigma, USA) at 37°C for 10 min. Consecutive slices were scanned by a white light scanner (Canon, Japan). LV area, AAR, and infarct area were determined by computerized planimetry and comprehensively analyzed in serial sections of each mouse) using ImageJ software. The infarction degree was calculated as the ratio of the infarction area to the AAR.
Transthoracic echocardiography
Cardiac function was assessed with a Vevo2100 Ultrasound system (VisualSonics, Toronto, Canada). Mice were mildly anesthetized with 0.5% isoflurane and placed on a heated ECG platform. The left ventricle and the aortic outflow tract were observed under the two-dimensional B-Mode, and the sample line was placed at the maximum cross-section of the left ventricle to guide the recording of serial M-Mode echocardiographic images. The left ventricular end-systolic volume (LVESV), left ventricular end-diastolic volume (LVEDV), fractional shortening (FS), left ventricular end-systolic diameter (LVESD), and left ventricular end-diastolic diameter (LVEDD) were measured from at least three distinct frames for each mouse, and the average was used for data analysis.
IHC and immunofluorescence staining
Analysis was performed using paraffin-embedded sections of the heart tissue samples fixed with 4% paraformaldehyde. All tissue samples were characterized using hematoxylin and eosin (H&E) staining before further immunostaining. After the inhibition of endogenous peroxidase activity, the sections were incubated with primary anti-SHEP1 (sc-100792, Santa Cruz) at 4°C overnight. Following the incubation, a Vectastain Elite ABC kit (Vector Laboratories, Burlingame, CA, USA) was used according to the manufacturer’s instructions. After the visualization with 3,3’-diaminobenzidine, the sections were counterstained with hematoxylin. As for immunofluorescence analysis, after deparaffinization, heat-mediated antigen retrieval in citrate buffer pH 6.0, and blocking with 5% horse serum at room temperature for 30 min, samples were incubated with primary antibodies overnight at 4°C. The primary antibodies anti-SHEP1 (Santa Cruz, 1:100, sc-100792) and anti-F4/80 (AbD Serotec, 1:200, MCA497GA) were utilized for these experiments. Signals were visualized with Alexa fluorescence-conjugated secondary antibodies (Invitrogen, Carlsbad, CA, USA). TUNEL staining was performed with an In Situ Apoptosis Detection kit (Yeasen, Shanghai, China), according to the manufacturer’s instructions. Cell nuclei were stained with DAPI. Five fields or more in > 3 different sections/animals were examined by a technician who was blinded to the treatment groups. Images were obtained using an Olympus microscope and quantified using Image J. For each heart sample, at least five random fields were measured.
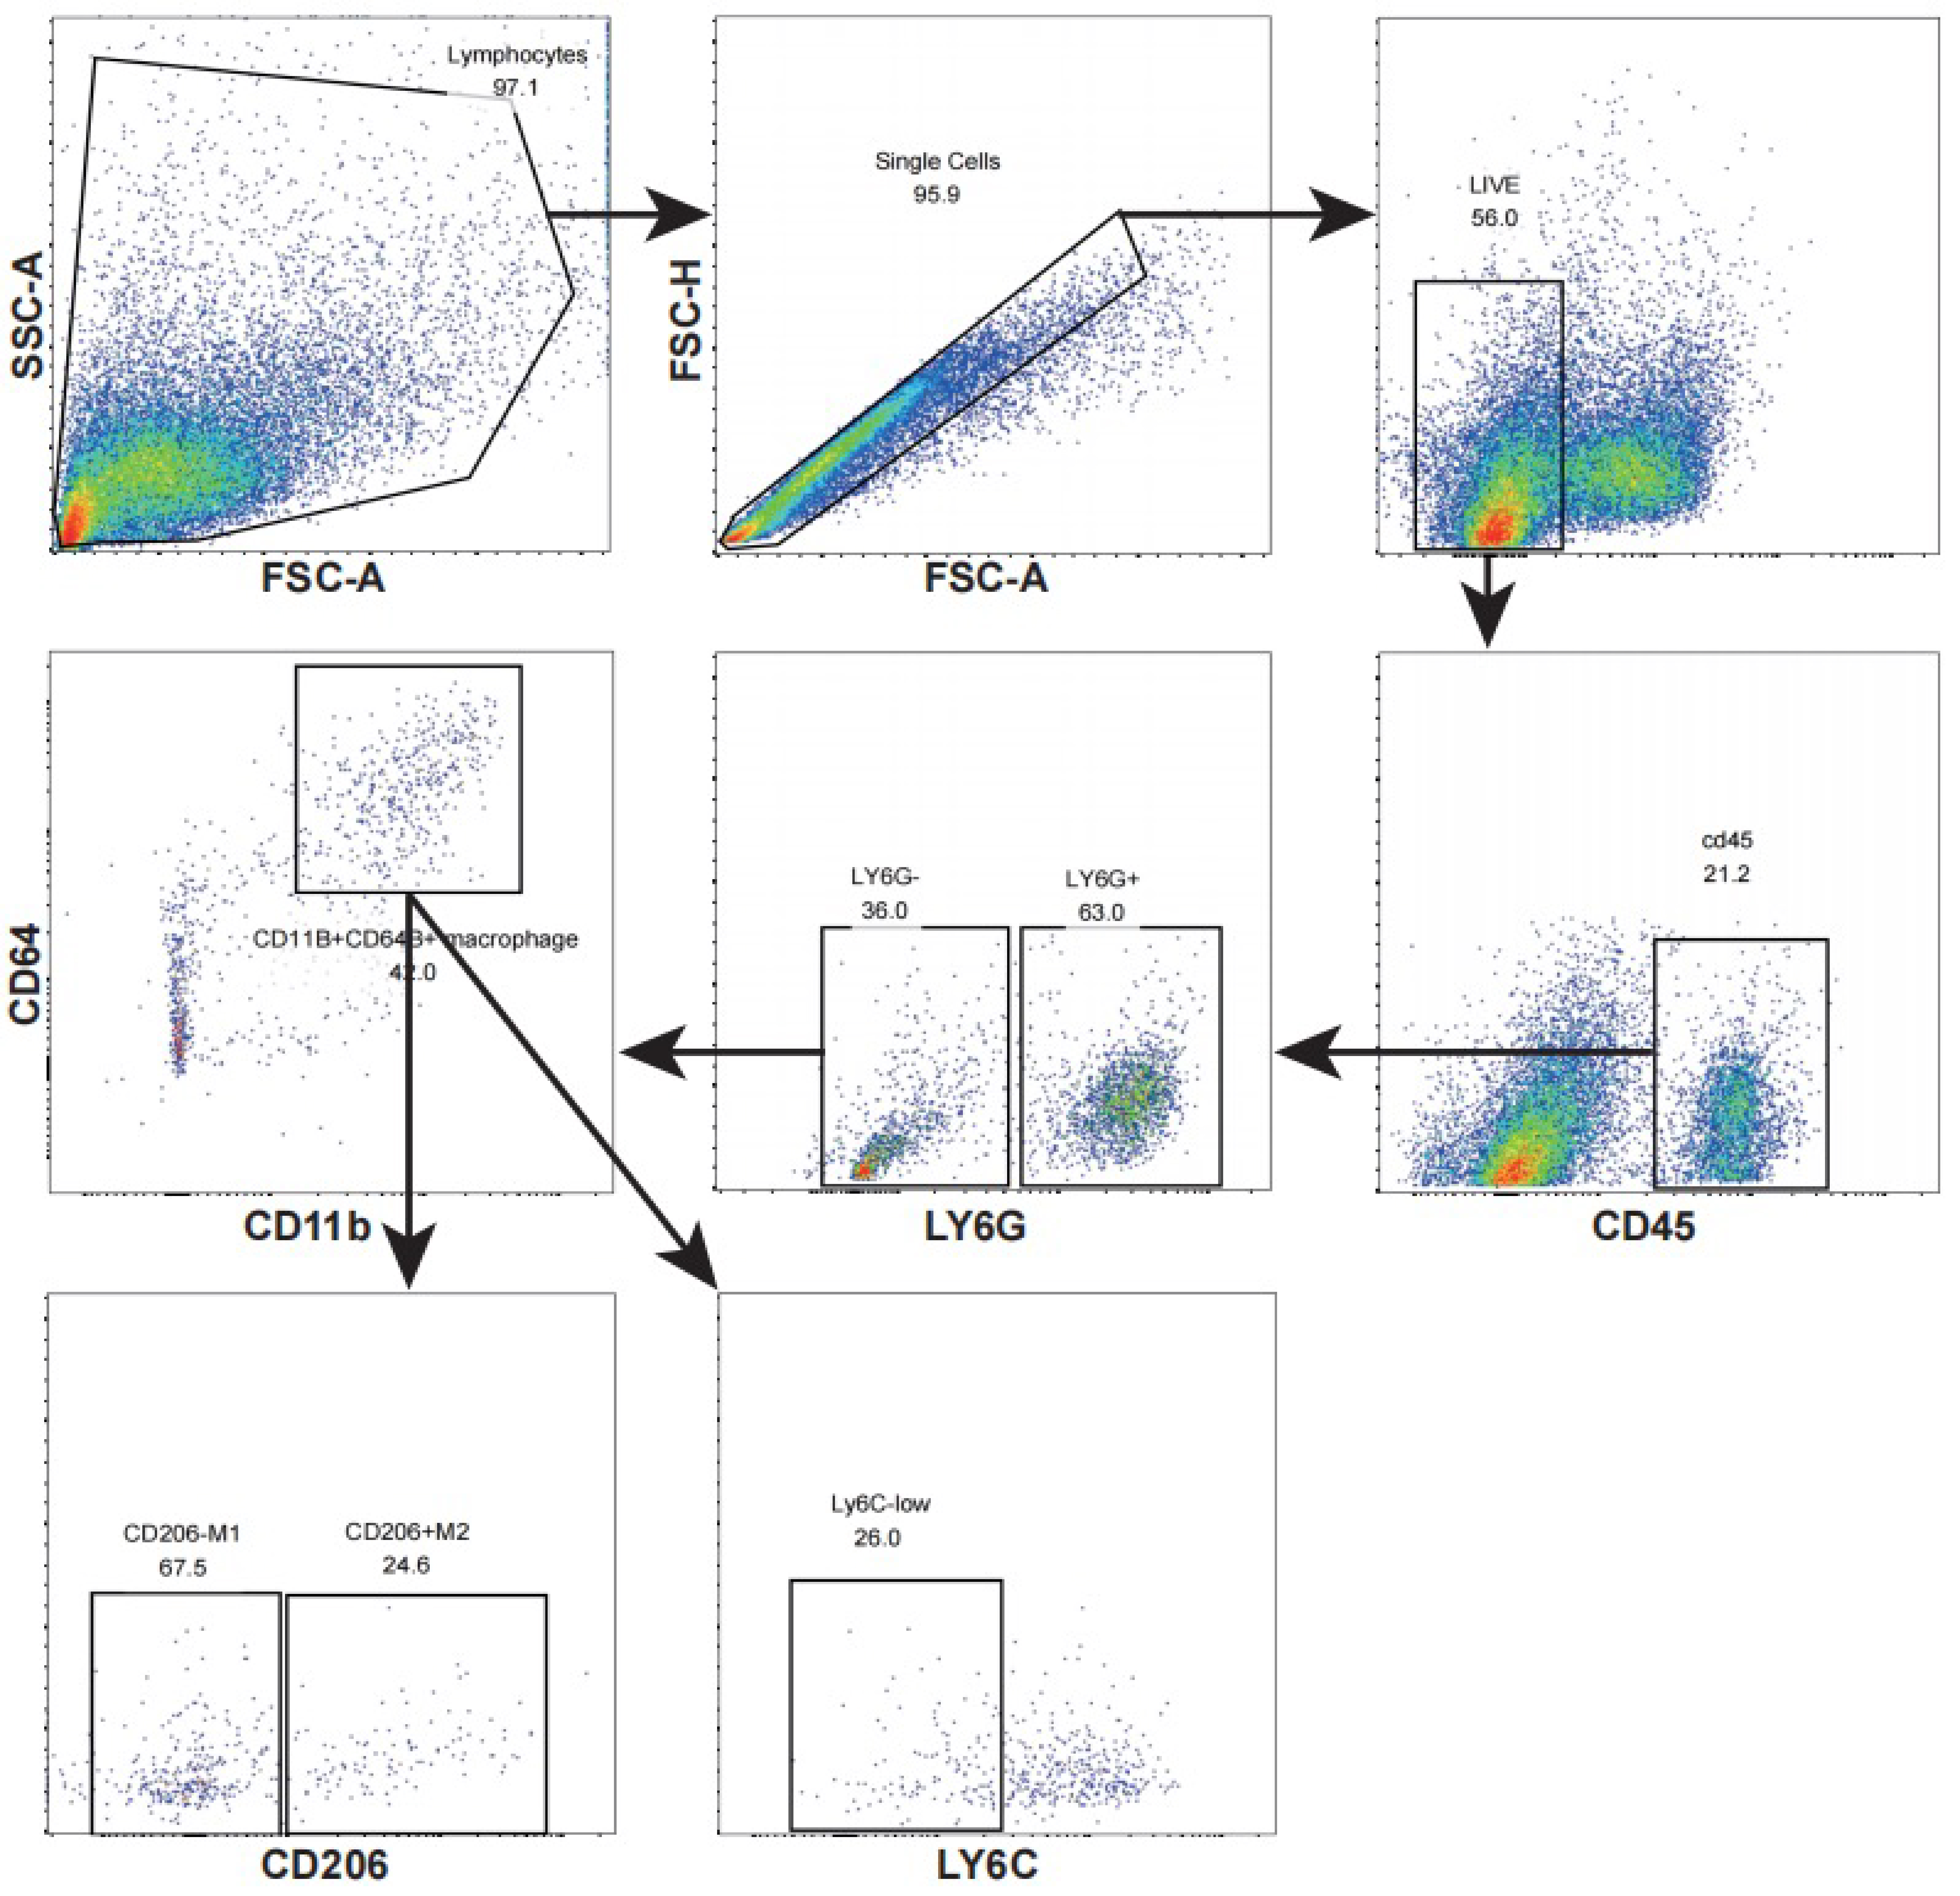
Cell extract, flow cytometry, and magnetic beads sorting
The hearts were dissected, carefully cut into small pieces with fine scissors, and enzymatically digested with type II collagenase (1.5 mg mL-1, Worthington Biochemical, Lakewood, NJ, USA), elastase (0.25 mg mL-1, Worthington Biochemical), and DNase I (0.5 mg mL-1, Worthington Biochemical) for 1 h at 37°C. Following digestion, the tissues were passed through 70-µm cell strainers, washed, and stained with antibodies for fluorescence-activated cell sorter (FACS) analysis. To block the non-specific binding of antibodies to Fcγ receptors, isolated cells were incubated first with anti-CD16/32 antibody (BD Biosciences, #553142) at 4°C for 5 min. The primary antibodies against the following were obtained from BD Biosciences (Franklin Lakes, NJ, USA): CD45.2 (#564616), CD11b (#552850), Ly-6G (#560599), Ly6C (#563011), CD64 (Biolegend, #139309), CD206 (Thermo, 17-2061-82). The obtained results are expressed as cell number/µg tissue. Flow cytometric analysis was performed using a FACSAria™ flow cytometer (BD Biosciences), and the obtained data were analyzed with FlowJo 7.6.1 software (Tree Star, Ashland, OR, USA).
Magnetic cell sorting was performed using QuadroMACS (Miltenyi Biotec, 130-091-051) according to the manufacturer’s instructions, anti-F4/80 MicroBeads (Miltenyi Biotec, 130-110-443) were utilized for separating macrophages.
Statistical analysis
Data were collected and expressed as average ± standard error of the mean (SEM). T-test were conducted when comparing 2 independent groups with the normalized distribution of values. For n = 3–4 per group, Mann-Whitney tests were used. ANOVA-test or Kruskal-Wallis (with low numbers) were carried out when comparing more than 2 groups. For two groups and multiple time points, a two-way ANOVA was used. Statistical analysis was conducted using GraphPad Prism 8.0 (GraphPad Prism Software Inc., San Diego, CA, USA).