2.1 Experimental animals
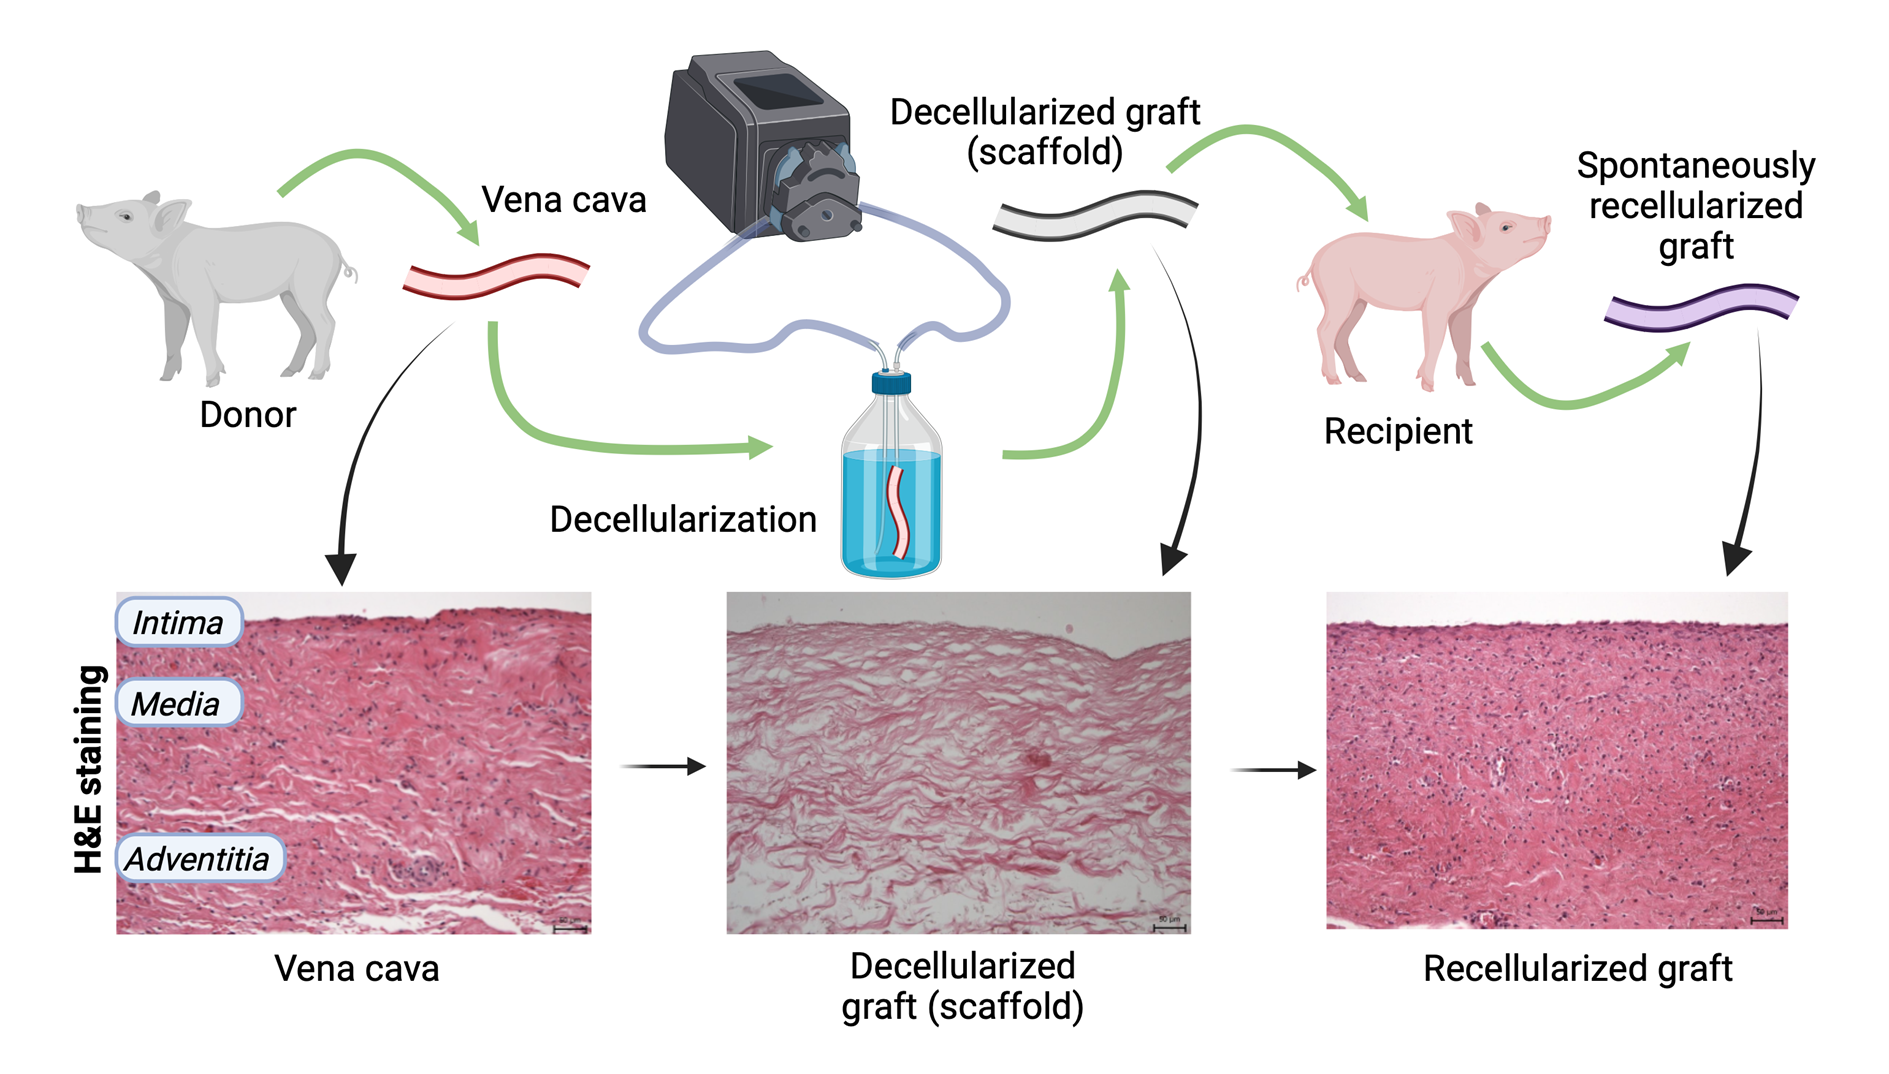
In total 40 pigs were used for the experiment (healthy both male and female Prestice black-pied pigs, 26.5 to 38.5 kg). Inferior vena cava (IVC) grafts were harvested from 20 donor pigs. Twelve of these grafts were decellularized and then orthotopically implanted in the IVC of the recipient animals from the experimental group (n=12), whereas 8 grafts were cryopreserved and then implanted in the recipient animals from the control group (n=8). The concept of the experiment is depicted in Figure 1. The recipient animals were then observed for 28 days after implantation. All animals were acclimatized before the experiment, they were fed twice a day and had unlimited access to water. All the surgical procedures were performed under general anesthesia using sterile material.
The protocol of in vivo experiment was approved and controlled by the Ministry of Education, Youth and Sports of the Czech Republic (project code: MSMT-18870/2020-3). All the procedures involving animals were performed in compliance with the law of the Czech Republic, which is compatible with the legislation of the European Union (EU Directive 2010/63/EU for animal experiments).
2.2 Graft harvesting
The donor animals (n = 20) received premedication by subcutaneous administration of ketamine (10 mg/kg, Narkamon – Spofa, a.s., Prague, Czech Republic), azaperone (5 mg/kg, Stresnil – Jannssen Pharmaceutica NV, Beerse, Belgium), and atropin (1 mg/animal, Atropin Biotika – Hoechst Biotika, Martin, Slovak Republic). After cannulation of a peripheral vein, general anesthesia was induced by intravenous administration of propofol (1% mixture, 5–10 mg/kg/h Propofol, Fresenius Kabi, Halden, Norway), and the animals were mechanically ventilated. Nalbuphin (10 mg/animal, before the operation and repeated every 2 hours during anesthesia, Nalbuphin Orpha, Chiesi CZ, Prague, Czech Republic) was used for analgesia and 0.6 mg of amoxicillin-clavulanate (Augmentin, GlaxoSmithKline Slovakia, Bratislava, Slovak Republic) was administered intravenously as prophylaxis. The IVC was dissected from the level of confluence of iliac veins to the lover margin of the liver. All lumbar veins and both renal veins were ligated and 300 international units (IU) of heparin per kg (Heparin, Zentiva, Prague, Czech Republic) were administered intravenously 5 minutes before IVC explantation. The explanted vein was then flushed with saline to remove all blood. In the case of grafts for decellularization, the IVC was placed in a 10% dimethylsulfoxide (DMSO) solution and gradually frozen to -80 °C. The allografts for animals from the control group were placed in 1:1 mixture of 6 % Voluven (Fresenius Kabi, Halden, Norway) and 10 % DMSO mixed in saline and then also gradually frozen to -80 °C.
2.3 Decellularization
Decellularization of the IVC grafts was done by perfusion with 1% Triton X-100 and 1% sodium dodecyl sulphate (SDS) at room temperature. The grafts (n=12) were thawed at 4 °C and then connected to the perfusion tube. The outflow of the vein was secured with a Luer lock adapter and the graft was placed in a 0.5 L glass bottle with inflow and outflow tubes going throw the bottle cap. The following runs of perfusion (50 ml/min) enabled decellularization of the graft: 1 run of saline for 10 min; 2 runs of Triton X-100, each for 60 min; 2 runs of SDS, each for 60 min; and 4 runs of saline, each for 15 min. The solutions were changed before each run. A photograph of the system running is in Figure 3A including the detail of the vein connection (Fig. 3B).
DNA residue content was used to determine the decellularization efficacy. Briefly, both native and decellularized samples of IVC weighing 40-50 mg were lyophilized to obtain the dry weight used as a reference to indicate DNA residues as ng/mg dry weight. By drying, we eliminated the differences given by the water content from each sample. Then, tissues were powdered using a mortar and pestle in liquid nitrogen and homogenized in a QIAshredder column (Qiagen, Dusseldorf, Germany). Then, DNA extraction was performed with RNeasy mini kit following the manufacturer’s guidelines (Qiagen, Dusseldorf, Germany) and Qubit reader was used to obtain the final DNA amount.
2.4 Graft implantation
Recipient animals were anesthetized using the same protocol as in the case of donors. For the prophylaxis, 0.6 mg of amoxicillin-clavulanate was administered intravenously before the operation and repeated 2 hours later. Firstly, port-a-cath was implanted to optimize blood sampling and postoperative care. PolyFlow polyurethane catheter was implanted in the right external jugular vein and connected to the ProPort Plastic Venous Access System (Deltec, Smiths Medical International, Ltd., UK) which was placed under the skin on the right side of the neck. Then the abdominal cavity was entered by middle laparotomy, the retroperitoneum was opened by incision of the peritoneum on the right side of the IVC, and the infrarenal part of the IVC was dissected in sufficient length. Several lumbar veins were ligated and transected and attention was paid not to injure the lymphatic vessels running close to the IVC. Five minutes after intravenous administration of heparin (100 IU/kg), the infrarenal IVC was clamped and a 1 to 1.5 cm long segment was resected and replaced with a 1.5 to 2 cm long graft. The decellularized graft was used for experimental animals (n = 12) and the cryopreserved allograft for control animals (n = 8). Both anastomoses were sewn with continuous 5-0 Prolene suture. After declamping the IVC, the retroperitoneum was left open to prevent fluid collection formation along the reconstruction. The abdominal cavity was closed with interrupted 0 nonabsorbable braided sutures, and 2-0 monofilament nonabsorbable suture was used for skin closure.
2.5 Postoperative follow-up
During the early postoperative period, the animals received infusion of crystalloid solutions (Hartman’s and 10% glucose) via the port-a-cath but the access to water was not limited. The dose of feed was gradually increased to the standard dose during the first days. All the animals received 40 mg of pantoprazole every day during the whole postoperative period. No anticoagulants or antithrombotic treatment were used after the operation. The animals were checked every morning to evaluate their overall status.
Blood samples were taken before and after the operation, and then on the 1st, 3rd, 7th, 14th, 21st, and 28th postoperative day (POD). Plasmatic levels of the following markers were assessed in each sample: aspartate aminotransferase (AST), alanine aminotransferase (ALT), alkaline phosphatase (ALP), gamma-glutamyl transferase (GGT), bilirubin, albumin, urea, and creatinine.
Computed tomography (CT) with 20 ml of intravenously administered iodinated contrast agent (Iomeron 350? Bracco, Milan, Italy) with rate of 1.8 ml/s was performed before the operation and then on the 1st, 3rd, 7th, 14th, 21st, and 28th postoperative day.
The abdominal cavity of all the animals was explored under general anesthesia on the 28th postoperative day and the segment of the IVC containing the implanted graft was resected.
2.6 Samples for histology
Five groups of samples were used for histological analysis: (1) native veins (resected segment of IVC of the recipient, n = 13), (2) decellularized veins before implantation (short segment taken from the graft, n = 12), (3) cryopreserved veins before implantation (short segment taken from the graft, n = 8), (4) decellularized veins after implantation (graft together with both anastomoses and parts of recipient IVC explanted 28 days after implantation, proximal part n=7, distal part n=7), and (5) cryopreserved veins after implantation (graft together with both anastomoses and parts of recipient IVC explanted 28 days after implantation, proximal part n=7, distal part n=7). The number of examined grafts after implantation was lower than the number of grafts before implantation because only the nonoccluded grafts could have been evaluated using the same methodology.
2.7 Histological processing
All venous samples were fixed in 10% neutral-buffered formalin solution. Both decellularized and cryopreserved grafts after implantation were transected in the middle between the proximal and distal anastomosis (Fig. 2A). The samples were then embedded in paraffin blocks following standard histological methods and cut into 5 μm-thick sections (Leica RM2255 microtome, Leica Biosystems GmbH, Nussloch, Germany). Transversal sections were obtained from these samples for quantitative histology. Then, the paraffin blocks with veins after implantation were dissolved in order to cut the sample with a longitudinally oriented section plane. The longitudinal sections were then histologically processed for qualitative histological analysis (Fig. 2B). All sections were deparaffinized, rehydrated and stained using the combination of four histological staining methods and four immunohistochemical reactions (Table 1).
Samples of decellularized veins before implantation were not stained with four immunohistochemical reactions (anti-alpha smooth actin, anti-von Willebrand factor, anti-MAC387 and anti-Ki67) due to the absence of cells.
Tab. 1 Histological staining methods and quantitative parameters.
|
Staining
|
Quantitative parameter (unit)
|
Purpose
|
Evaluated vein
|
Objective used
|
Micrographs taken
|
|
Verhoeff´s method for elastic fibers (Verhoeff, 1908)
|
AA (elastin, wall) (-)
|
The area fraction of elastin fibres and membranes
|
native, decellularized before and after implantation, cryopreserved before and after implantation
|
40x
|
4
|
|
Picrosirius red (Rich and Whittaker, 2005)
|
AA (collagen, wall) (-)
|
The area fraction of type I (yellow-red color) and type III collagen (green color)
|
native, decellularized before and after implantation, cryopreserved before and after implantation
|
40x
|
4
|
|
Immunohistochemistry with antibody anti-alpha smooth actin (Clone 1A4, 1:500 dilution, DakoCytomation, Glostrup, Denmark)
|
AA (actin, wall) (-)
|
The area fraction of smooth muscle actin
|
native, decellularized after implantation, cryopreserved before and after implantation
|
40x
|
4
|
|
Gill´s hematoxylin
|
QA (nuclear profiles, wall) (mm-2)
|
The quantity of nuclear profiles
|
native, decellularized after implantation, cryopreserved before and after implantation
|
40x
|
4
|
|
Immunohistochemistry with antibody anti-von Willebrand factor (1:1000 dilution, DakoCytomation, Glostrup, Denmark)
|
QA (vasa vasorum, wall) (mm-2)
|
The quantity of vascular profiles
|
native, decellularized after implantation, cryopreserved before and after implantation
|
40x
|
4
|
|
Immunohistochemistry with antibody anti-MAC387 (MA1-80446, 1:200 dilution, ThermoFisher Scientific)
|
QA (MAC387-positive cells, wall) (mm-2)
|
The quantity of MAC387-positive cells
|
native, decellularized after implantation, cryopreserved before and after implantation
|
40x
|
4
|
|
Immunohistochemistry with antibody anti-Ki67 Clone MIB-1, Ready to use, DakoCytomation, Glostrup, Denmark)
|
Proliferation index (%)
|
The ratio of Ki67-positive cells to all cells in in the reference area
|
native, decellularized after implantation, cryopreserved before and after implantation
|
40x
|
4
|
|
Hematoxylin-eosin (Bancroft, 2008)
|
Intima media thickness (IMT) (μm)
|
The thickness of tunica intima and media
|
native, decellularized before and after implantation, cryopreserved before and after implantation
|
10x
|
4
|
2.8 Microphotographs for stereological analysis
Microphotographs were taken using systematic uniform sampling of the venous wall (Supplementary fig. 1, Table 1) [39]. The detailed location of these microphotographs id shown in Supplemetary fig. 1. The total number of microphotographs taken and quantified was 2,656.
2.9 Stereological quantification
The design of the quantitative analysis was based on previously published studies on various vessels morphology [40-42]. The area fractions of elastin, collagen and smooth muscle actin were quantified using the stereological point grid and Cavalieri principle [43]. The fractions were estimated as the ratio of the evaluated microscopic structures to the reference area. The settings of the used point grid were in agreement with the standards of stereological methods [44].The two-dimensional densities of nuclear profiles, vascular profiles and MAC387-positive cells were evaluated using the unbiased counting frame [40, 45]. These densities were estimated as the number of the evaluated structures per reference area. The proliferation index was evaluated as the ratio of Ki67-positive nuclei to all cell nuclei in the reference area. At least 300 nuclei per case were calculated for the proliferation index [46]. Intima-media thickness of veins was measured using four linear probes. Stereological quantifications were performed using the Ellipse software (ViDito, Košice, Slovak republic). For details see Supplementary fig. 2.
2.10 Statistics
Means and sample standard deviations were used to represent the measured data. Primary analysis of the quantitative histological and biochemistry data was performed with analysis of variance (ANOVA) for repeated measurements, thus respecting the dependency of observations belonging to each animal. In order to maximize statistical power, post-hoc analysis was not performed with a complete scheme of all pairwise comparisons, but only biologically relevant comparisons were made using the t-test (either paired or two-sample) with subsequent Bonferroni correction applied to the whole family of test for each variable. In particular, histological variables were compared between all timepoint pairs within each group (3 tests for each group, 6 tests in total) and between the groups at each time point (3 tests) and the Bonferroni-corrected significance level was set to αC = 0.05 / 9 = 0.0056. The exception here was vasa vasorum, for which data was not available for the decellularized graft before implantation. The repeated measures ANOVA was thus performed using only the ‘native’ and ‘28 days after implantation’ timepoints and the post-hoc procedure comprised only 6 tests and αC = 0.05 / 6 = 0.0083. For biochemistry variables, only comparisons between groups (for each time point) were made, resulting in 8 tests and αC = 0.05 / 8 = 0.00625 for each variable. The Bonferroni correction was performed at the level of significance threshold α and if shown, the original p-values are presented. All reported p-values are two-tailed and the general level of statistical significance was set at α = 0.05. Statistical analysis was performed in Statistica (ver. 12 Cz, TIBCO Software Inc., Palo Alto, CA, USA).