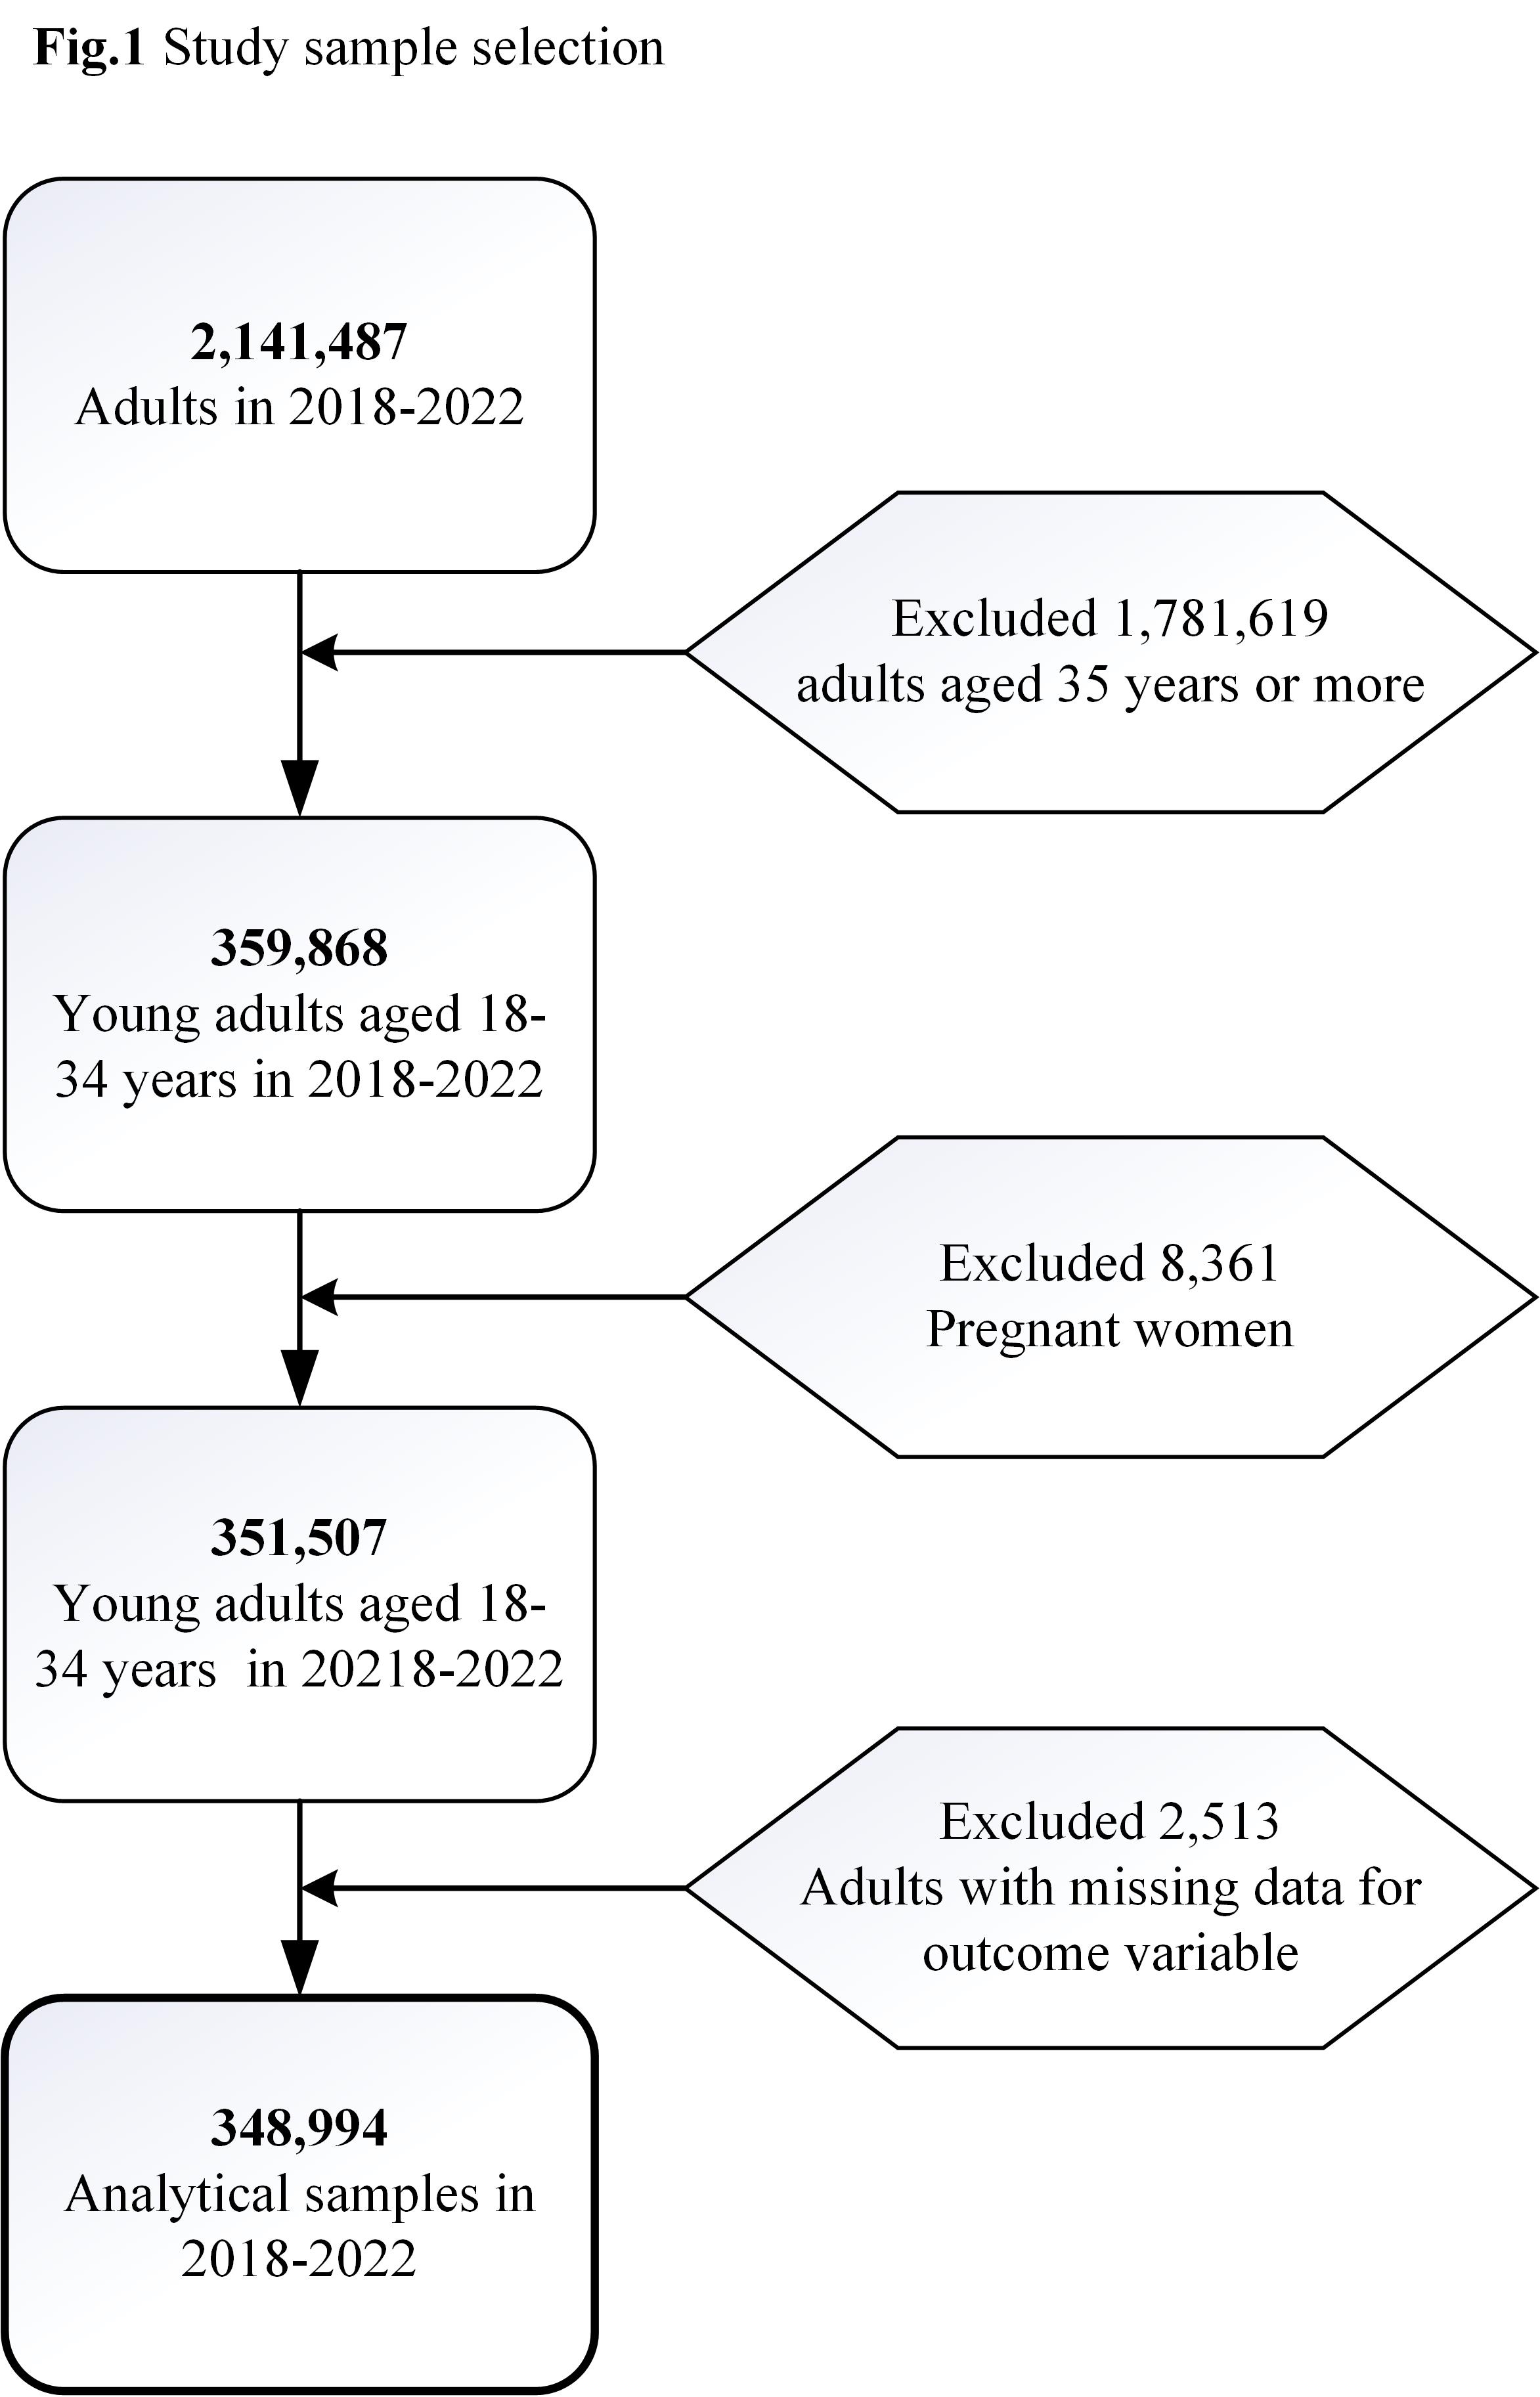
The final analytical sample included 348,998 young adults, ages 18 through 34 years old, who were not currently pregnant, and had no missing data for the outcome variable (diagnosed depressive disorder status). Overall, the distribution of participants’ characteristics before and during the COVID-19 pandemic remained similar, with little or no variations. Most young adults in both study periods were in the age group between 18 and 24 years (41.5% before COVID-19 vs 41.0% during COVID-19), male (52.2% vs 52.3%), non-Hispanic White (52.9% vs 51.0%), had high school education or below (43.0% vs 43.3%), employed (67.3% vs 66.8%), and never married (57.9% vs 58.9%). While there was a minor increase in the percentage of having health insurance (81% vs 84.4%) and doing exercise (80.4% vs 81.8%) during COVID-19, alcohol consumption (58.4–57.2%) and smoking tobacco (15.9–12%) decreased slightly (Table 1).
Table 1
Sociodemographic and lifestyle characteristics of U.S. young adults aged 18–34 years before and during COVID-19, BRFSS 2018–2022 (N = 348994)
| Sociodemographic and lifestyle characteristics | Before COVID-19 (2018–2019) | During COVID-19 (2020–2022) |
| | Unweighted N | Weighted % | Unweighted N | Weighted % |
| Age (in years) | | | | |
| 18–24 | 49778 | 41.5 | 76578 | 41.0 |
| 25–29 | 41637 | 27.1 | 62454 | 26.7 |
| 30–34 | 45912 | 31.4 | 72635 | 32.3 |
| Sex | | | | |
| Male | 72603 | 52.2 | 112998 | 52.3 |
| Female | 64581 | 47.8 | 98669 | 47.7 |
| Race/ethnicity | | | | |
| Non-Hispanic White | 84061 | 52.9 | 126831 | 51.0 |
| Non-Hispanic Black | 12293 | 12.6 | 17362 | 11.7 |
| Hispanic | 23080 | 23.7 | 36852 | 24.7 |
| Othersa | 15923 | 10.8 | 26610 | 12.6 |
| Education | | | | |
| High school or less | 50482 | 43.0 | 76139 | 43.3 |
| Attended college or technical school | 42306 | 33.6 | 60796 | 31.7 |
| Graduated from college or technical school | 44167 | 23.4 | 73956 | 25.0 |
| Employment | | | | |
| Employed | 95756 | 67.3 | 147117 | 66.8 |
| Unemployed | 32560 | 27.5 | 51228 | 28.8 |
| Homemaker | 6578 | 5.2 | 7918 | 4.4 |
| Family structure | | | | |
| Married | 39856 | 27.3 | 57740 | 26.1 |
| Divorced/ Widowed/ Separated | 8149 | 5.6 | 10971 | 5.2 |
| Never married | 75347 | 57.9 | 118910 | 58.9 |
| A member of an unmarried couple | 12992 | 9.3 | 22011 | 9.8 |
| Health insurance | | | | |
| Yes | 112925 | 81.0 | 174069 | 84.4 |
| No | 22877 | 19.0 | 26754 | 15.6 |
| Alcohol consumption | | | | |
| Yes | 78148 | 58.4 | 116854 | 57.2 |
| No | 50975 | 41.6 | 77117 | 42.8 |
| Smoking | | | | |
| Yes | 21997 | 15.9 | 24515 | 12.0 |
| No | 108863 | 84.1 | 173643 | 88.0 |
| Exercise | | | | |
| Yes | 108042 | 80.4 | 175615 | 81.8 |
| No | 25045 | 19.6 | 35769 | 18.2 |
| Note: aOther races included multi-race, American Indian, Alaskan Native, Asian, Pacific Islander, and Hawaiian Native |
Overall, the prevalence of depressive disorder among U.S. young adults significantly increased by 13.7% in relative terms from 20.5–23.3% during COVID-19 (compared to before COVID-19). In both study periods, the prevalence was higher for the age group between 18 and 24 years (20.8% before COVID-19 and 24.0% during COVID-19), females (26.4% and 30.5%), non-Hispanic White (25.7% and 28.9%), who attended college or technical school (23.2% and 26.8%), unemployed (25.1% and 27.2%), divorced/widowed/separated (30.7% and 32.2%), had health insurance (21% and 24.6%), consumed alcohol (22.0% and 25.2%), smoked tobacco (35.4% and 37.5%), and did not exercise (21.6% and 23.8%) (Table 2).
Table 2
Weighted prevalence of depressive disorder among young adults (aged 18–34 years) and relative changes in the prevalence before and during COVID-19 by socio-demographic and lifestyle factors, BRFSS 2018–2022 (N = 348994)
| Sociodemographic and lifestyle factors | Before COVID-19 (2018–2019) | During COVID-19 (2020–2022) | Relative differencea | P-valued |
| | Weighted % | P-valuec | Weighted % | P-valuec | % |
| Overall depressive disorder | 20.5 | | 23.3 | | 13.7 | < 0.001 |
| Age (in years) | | | | | | |
| 18–24 | 20.8 | 0.370 | 24.0 | < 0.001 | 15.4 | < 0.001 |
| 25–29 | 20.3 | 23.5 | 15.8 | < 0.001 |
| 30–34 | 20.2 | 22.4 | 10.9 | < 0.001 |
| Sex | | | | | | |
| Male | 15.0 | < 0.001 | 16.8 | < 0.001 | 12.0 | < 0.001 |
| Female | 26.4 | 30.5 | 15.5 | < 0.001 |
| Race/ethnicity | | | | | | |
| Non-Hispanic White | 25.7 | < 0.001 | 28.9 | < 0.001 | 12.5 | < 0.001 |
| Non-Hispanic Black | 15.7 | 18.2 | 15.9 | < 0.001 |
| Othersb | 14.0 | 18.2 | 30.0 | < 0.001 |
| Hispanic | 14.4 | 17.1 | 18.8 | < 0.001 |
| Education | | | | | | |
| High school or less | 20.4 | < 0.001 | 23.0 | < 0.001 | 12.7 | < 0.001 |
| Attended college or technical school | 23.2 | 26.8 | 15.5 | < 0.001 |
| Graduated college or technical school | 16.8 | 19.8 | 17.9 | < 0.001 |
| Employment | | | | | | |
| Employed | 18.6 | < 0.001 | 21.9 | < 0.001 | 17.7 | < 0.001 |
| Unemployed | 25.1 | 27.2 | 8.4 | < 0.001 |
| Homemaker | 22.3 | 24.9 | 11.7 | 0.032 |
| Family structure | | | | | | |
| Married | 16.2 | < 0.001 | 19.5 | < 0.001 | 20.4 | < 0.001 |
| Divorced/ Widowed/ Separated | 30.7 | 32.2 | 4.9 | 0.156 |
| Never married | 20.7 | 23.5 | 13.5 | < 0.001 |
| A member of an unmarried couple | 25.4 | 28.6 | 12.6 | < 0.001 |
| Health insurance | | | | | | |
| Yes | 21.0 | < 0.001 | 24.6 | < 0.001 | 17.1 | < 0.001 |
| No | 18.2 | 18.2 | 0.0 | 0.892 |
| Alcohol consumption | | | | | | |
| Yes | 22.0 | < 0.001 | 25.2 | < 0.001 | 14.5 | < 0.001 |
| No | 19.2 | 21.9 | 14.1 | < 0.001 |
| Smoking | | | | | | |
| Yes | 35.4 | < 0.001 | 37.5 | < 0.001 | 5.9 | 0.006 |
| No | 18.0 | 21.8 | 21.1 | < 0.001 |
| Exercise | | | | | | |
| Yes | 20.4 | 0.007 | 23.2 | 0.209 | 13.7 | < 0.001 |
| No | 21.6 | 23.8 | 10.2 | < 0.001 |
| Note: aRelative difference in the weighted prevalence of depressive disorder among young adults before and during COVID-19, presented in percentage terms; bOther race included multi-race, American Indian, Alaskan Native, Asian, Pacific Islander, and Hawaiian Native; cP-values in the third and fifth columns from left are from Rao-Scott Chi-Square test of association between depressive disorder and each of the independent variables; dItalic P-values are from Rao-Scott Chi-Square test of association between depressive disorder and study periods (before and during COVID-19) for each category of an independent variable separately. |
The relative changes (in percentage terms) in the prevalence of depressive disorder before and during COVID-19 showed an increase across all categories of sociodemographic and lifestyle factors. The highest relative increase was observed among those aged between 25 and 29 years (15.8%), females (15.5%), other races including multi-races (30.0%), graduated from college or technical school (17.9%), employed (17.7%), married (20.4%), and had health insurance (17.1%). Among lifestyle factors, relative changes in depressive disorder during COVID-19 were higher among those who consumed alcohol (14.5%), did not smoke (21.1%), and did exercise (13.7%) (Table 2).
Compared with the study period before COVID-19, the levels of depressive disorder remained high among females, non-Hispanic races other than White and Black, employed, and married young adults during COVID-19 after adjusting for sociodemographic and lifestyle factors (Table 3). Female young adults had 1.35 times higher odds (OR 1.35, 95% CI: 1.29–1.40) of depressive disorder during COVID-19, whereas it was 1.25 times higher for males (OR 1.21, 95% CI: 1.16–1.27). While Hispanic (OR 1.25, 95% CI: 1.14–1.37) and Non-Hispanic White (OR 1.27, 95% CI: 1.23–1.32) and non-Hispanic Black (OR 1.27, 95% CI: 1.14–1.41) young adults experienced 25 to 27 percent higher odds of depressive disorder during COVID-19, other races including multi-race, American Indian, Alaskan Native, Asian, Pacific Islander, and Hawaiian Native experienced 46 percent higher odds (OR 1.46, 95% CI: 1.31–1.62). During COVID-19 the odds of experiencing depressive disorder were highest among employed young adults (OR 1.32, 95% CI: 1.27–1.37) followed by homemakers (OR 1.26, 95% CI: 1.08–1.47), and unemployed (OR 1.20, 95% CI: 1.14–1.28). Young adults whether married (OR 1.32, 95% CI: 1.24–1.40) or a member of an unmarried couple (OR 1.30, 95% CI: 1.18–1.42) or never married (OR 1.29, 95% CI: 1.23–1.34), all groups experienced 29 to 32 percent higher odds of depressive disorder during COVID-19 except divorced/widowed/separated young adults (OR 1.13, 95%: 1.01–1.27). Although the relative percent increase and crude odds of depressive disorder were higher among those aged 25–29 years and graduated from college or technical school, adjusting for other sociodemographic and lifestyle factors showed higher odds for the age group 18–24 years (OR 1.34, 95% CI: 1.27–1.41) and who attended college or technical school (OR 1.33, 95% CI: 1.26–1.40).
Table 3
Depressive disorder among young adults aged 18–34 years during COVID-19 compared to before COVID-19 for each category of sociodemographic factors, presented with (weighted) odds ratios and 95% confidence intervals, BRFSS 2018–2022
| | Unadjusted Model | Adjusted Modelb |
| Socio-demographic variables | cOR (95% CI) | P-value | aOR (95% CI) | P-value |
| Age (in years) | | | | |
| 18–24 | 1.20 (1.15–1.26) | < .001 | 1.34 (1.27–1.41) | < .001 |
| 25–29 | 1.21 (1.15–1.27) | < .001 | 1.30 (1.22–1.37) | < .001 |
| 30–34 | 1.14 (1.09–1.20) | < .001 | 1.19 (1.12–1.25) | < .001 |
| Sex | | | | |
| Male | 1.14 (1.09–1.19) | < .001 | 1.21 (1.16–1.27) | < .001 |
| Female | 1.23 (1.18–1.28) | < .001 | 1.35 (1.29–1.40) | < .001 |
| Race | | | | |
| Non-Hispanic Black | 1.20 (1.09–1.33) | < .001 | 1.27 (1.14–1.41) | < .001 |
| Non-Hispanic White | 1.18 (1.14–1.22) | < .001 | 1.27 (1.23–1.32) | < .001 |
| Othersa | 1.36 (1.24–1.49) | < .001 | 1.46 (1.31–1.62) | < .001 |
| Hispanic | 1.23 (1.14–1.34) | < .001 | 1.25 (1.14–1.37) | < .001 |
| Education | | | | |
| High school or less | 1.17 (1.12–1.22) | < .001 | 1.25 (1.19–1.32) | < .001 |
| Attended college or technical school | 1.21 (1.15–1.27) | < .001 | 1.33 (1.26–1.40) | < .001 |
| Graduated from college or technical school | 1.22 (1.16–1.28) | < .001 | 1.28 (1.22–1.35) | < .001 |
| Employment | | | | |
| Employed | 1.23 (1.19–1.28) | < .001 | 1.32 (1.27–1.37) | < .001 |
| Unemployed | 1.12 (1.06–1.18) | < .001 | 1.20 (1.14–1.28) | < .001 |
| Homemaker | 1.16 (1.01–1.33) | 0.041 | 1.26 (1.08–1.47) | 0.003 |
| Marital status | | | | |
| Married | 1.25 (1.18–1.33) | < .001 | 1.32 (1.24–1.40) | < .001 |
| Divorced/ Widowed/ Separated | 1.08 (0.97–1.20) | 0.164 | 1.13 (1.01–1.27) | 0.040 |
| Never married | 1.17 (1.13–1.22) | < .001 | 1.29 (1.23–1.34) | < .001 |
| A member of an unmarried couple | 1.18 (1.08–1.28) | < .001 | 1.30 (1.18–1.42) | < .001 |
| Note: cOR - Crude Odds Ratio; aOR - Adjusted Odds Ratio; 95% CI − 95 percent confidence interval; aOther races included multi-race, American Indian, Alaskan Native, Asian, Pacific Islander, and Hawaiian Native; bAdjusted model for each variable categories were controlled for other socio-demographic variables in the table, health insurance, and lifestyle variables (alcohol consumption, cigarette smoking, and exercise). |