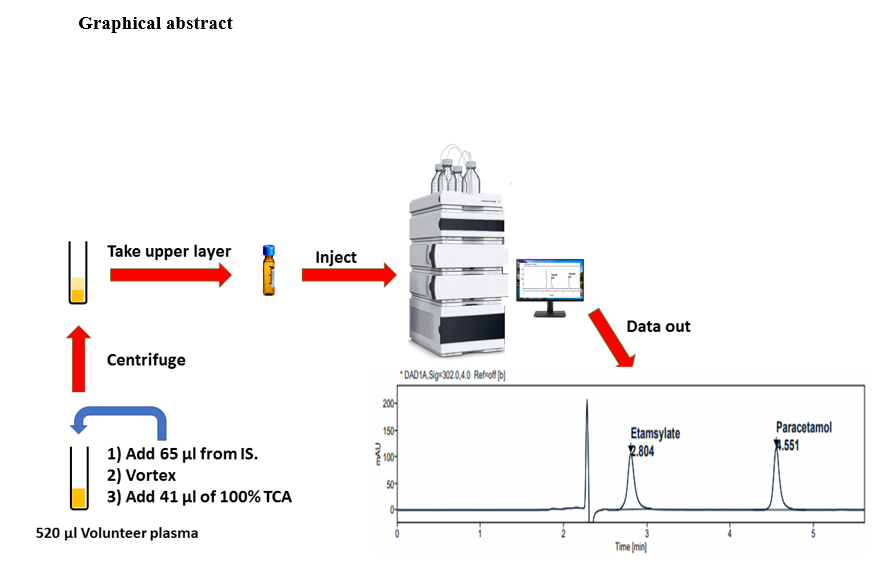
3.1 Chromatographic conditions
Several trials were carried out for selecting the suitable column and determining the components of the mobile phase in order to create optimum chromatographic peak shape and resolution. For both standard and internal standard maximum conditions, the selected column was Fortis C18 (150 mm x 4.6 mm, 5µm), the mobile phase was formed of 0.8% Orthophosphoric acid and acetonitrile at a ratio of 98:2 v/v at flow rate 1ml/min, and the wavelength of detection was 302 nm. All those adjusted parameters were perfect to obtain a typical peak, acceptable symmetry, and resolution as found in Table (1). Our method achieved rapid separation only takes 5.5 min with a resolution 12.92 which represents an excellent separation between drug and internal standard.
Table 1 The peak parameters for Etamsylate and Paracetamol.
|
Drugs
|
Peak Symmetry
|
Peak plates
|
Tailing factor
|
Resolution
|
|
Etamsylate
|
0.70
|
6018
|
1.36
|
12.92
|
|
Paracetamol
|
0.71
|
20443
|
1.37
|
|
Acceptance range
|
Less than 1.5
|
|
Less than 2
|
Not less than 2
|
3.2 Method validation
3.2.1 Selectivity
Chromatograms obtained from processed blank samples showed no interfering peaks at the retention times of both standard and internal standard when compared with chromatograms of spiked plasma with Etamsylate and Paracetamol. Figure 2.
3.2.2 Linearity
Calibration curves showed good linearity while covering a wide concentrations range (0.6–40µg/ml). Linearity of the calibration curves was qualified by the value of correlation coefficient (R2) which was R2 = 0.9992 Fig. 3. When the lowest concentration (LLOQ) presented RSD < 9, other concentrations demonstrated RSD < 4. The LOD and LOQ were calculated and found to be 0.73 and 2.2 µg/ml, respectively.
3.2.3 Precision
Precision of the analytical method is evaluated by relative standard deviation (RSD) of the percent drug recovered as it is clarified in Table 2. The average of the triplicate samples concentrations was emphasized to be within the tolerable parameters of variable limits. The table reveals that the applied method provided an acceptable variation of results for both intra- and inter-day precision. The RSD% of within-day precision varied from 0.85–2.07%, while the RSD% of intra-day ranged from 0.33–1.07%. The inter-day accuracy lied from 94–107%, and day-to-day accuracy was 101–107%.
Table 2 Intra-day and inter-day precision and accuracy of Etamsylate in human plasma.
|
Nominal conc. (µg/ml)
|
Day- to- Day a
Mean ± SD
|
RSD (%)
|
Accuracy (%)
|
Inter-Day b
Mean ± SD
|
RSD (%)
|
Accuracy (%)
|
|
0.6
|
0.640 ± 0.00
|
0.660
|
107.08
|
0.630 ± 0.01
|
2.07
|
105. 13
|
|
1.8
|
1.89 ± 0.01
|
0.330
|
105.25
|
1.93 ± 0.03
|
1.55
|
107.32
|
|
15
|
16.0 ± 0.16
|
1.02
|
107.15
|
15.5 ± 0.21
|
1.38
|
103.30
|
|
34
|
34.5 ± 0.36
|
1.07
|
101.55
|
31.9 ± 0.27
|
0.850
|
94.050
|
* a n = 3, b n = 6 where n is the number of injections.
3.2.4 Stability
Table 3 depicts the deviation in the concentrations of Etamsylate in human plasma less than 10% of the nominal concentrations in a variety of stability tests including short-term stability (6hr, 24hr), auto-sampler (24hr), freeze-thaw cycles, and long-term stability.
Table 3 Stability of Etamsylate in plasma with exposure to various conditions (n = 3).
|
Nominal conc. (µg/ml)
|
Stability
|
Mean ± SD
|
CV (%)
|
Accuracy (%)
|
|
1.8
(QCL)
|
0hr (initial)
|
1.960 ± 0.05
|
2.93
|
109.16
|
|
6hr (short-term)
|
1.890 ± 0.04
|
2.83
|
105.24
|
|
24hr (short-term)
|
1.970 ± 0.06
|
3.81
|
109.70
|
|
24hr (auto-sampler)
|
2.000 ± 0.03
|
2.11
|
111.30
|
|
3 Freeze-thaw cycle
|
1.970 ± 0.06
|
0.440
|
109.29
|
|
-70C, 45 days (long term)
|
1.970 ± 0.05
|
3.08
|
109.26
|
|
34
(QCH)
|
0hr (initial)
|
38.06 ± 0.67
|
2.16
|
111.94
|
|
6hr (short-term)
|
38.56 ± 0.04
|
0.140
|
113.41
|
|
24hr (short-term)
|
38.34 ± 0.09
|
0.300
|
112.78
|
|
24hr (auto-sampler)
|
38.15 ± 0.17
|
0.540
|
112.20
|
|
3 Freeze-thaw cycle
|
38.06 ± 0.40
|
0.600
|
111.93
|
|
-70C, 45 days (long term)
|
36.86 ± 2.02
|
6.72
|
108.40
|
3.2.5 Recovery
The applied method for Etamsylate determination in plasma after being spiked with the QCM and QCH concentrations of the drug revealed a recovery range (88.35% ± 4.80).
3.2.6 System suitability
This test is used for the verification of chromatographic system suitability for the intended analysis. After QCM analysis, the CV% was reported to be 0.97% which means that the HPLC system is perfect to achieve the analysis.
3.2.7 Matrix effect
The obtained matrix effect data shows in Table 4 which ranging from 95 to 105 for QCL and QCH and was found to be 101.9 for IS. Moreover, the CV% for the matrix factor found to be less than 1%. All the obtained results were within acceptance range and reflect the absence of interference.
Table 4 matrix effect of the drug and internal standard
|
Neat solution
(area)
|
Plasma (area)
|
|
Paracetamol
(Internal Std)
|
|
|
level
|
QCL
|
QCH
|
QCL
|
QCH
|
Matrix
factor
|
Neat solution (Peak Area)
|
plasma (Peak Area)
|
Matrix factor
|
|
Conc.
(µg/ml)
|
1.8
|
3.2
|
1.8
|
3.2
|
MF QCL
|
MF QCH
|
Internal std.
|
|
1
|
144.19
|
2166.68
|
140.87
|
2051.65
|
95.17
|
95.17
|
780.56
|
808.95
|
102.75
|
|
2
|
148.62
|
2141.01
|
142.84
|
2130.04
|
96.50
|
98.81
|
806.75
|
806.59
|
102.45
|
|
3
|
150.27
|
2138.28
|
144.71
|
2145.58
|
97.76
|
99.53
|
796.60
|
824.93
|
104.78
|
|
4
|
147.82
|
2134.49
|
142.19
|
2115.10
|
96.06
|
98.12
|
783.08
|
809.69
|
102.84
|
|
5
|
149.17
|
2172.04
|
140.68
|
2135.19
|
95.04
|
99.05
|
786.91
|
794.07
|
100.86
|
|
6
|
148.05
|
2181.53
|
144.44
|
2108.25
|
97.58
|
97.80
|
769.87
|
769.51
|
97.740
|
|
Mean
|
148.02
|
2155.67
|
142.62
|
2114.30
|
96.35
|
98.08
|
787.30
|
802.29
|
101.90
|
|
SD
|
2.07
|
20.12
|
1.72
|
33.54
|
1.16
|
1.56
|
12.90
|
18.83
|
2.39
|
|
CV%
|
1.40
|
0.93
|
1.2
|
1.59
|
0.01
|
0.02
|
1.64
|
2.35
|
0.02
|
3.2.8. Dilution integrity
The six replicate samples were prepared to produce a concentration 34µg/ml after dilution. All the prepared samples (2X and 4X) after dilution return to the range of the target concentration with a CV% 0.76 − 0.39% and accuracy 112–111 for 2X and 4X, respectively as depicted in Table 5.
Table 5 Dilution integrity (2X and 4X).
|
Dilution integrity (2X)
|
Dilution integrity (4X)
|
|
Concentration (µg/ml)
|
Percent (%)
|
Concentration (µg/ml)
|
Percent (%)
|
|
38.65
|
113.68
|
37.89
|
111.44
|
|
37.88
|
111.41
|
38.03
|
111.85
|
|
38.33
|
112.73
|
37.99
|
111.74
|
|
38.05
|
111.91
|
37.93
|
111.55
|
|
38.10
|
112.07
|
37.71
|
110.91
|
|
37.93
|
111.55
|
37.67
|
110.79
|
|
Average
|
38.16
|
112.23
|
37.87
|
111.38
|
|
SD
|
0.29
|
0.85
|
0.15
|
0.44
|
|
CV%
|
0.76
|
0.76
|
0.39
|
0.39
|
3.3. Application to a bioequivalence study.
The method was applied to the bioequivalence study and tested on twenty-four healthy volunteers for the analysis of collected blood samples. After oral administration of 500mg Etamsylate tablet reference and test, the mean plasma concentration was drawn against time profile as can be seen in Fig. 4. The average of maximum concentration Cmax 8.99µg/ml was reached after tmax 5.73hr as shown in Table 7. The 90% confidence interval (90% CI) for test/ reference ratio was illustrated in Table 6 to evaluate the bioequivalence of test and reference, which were within the bioequivalence acceptance (80–125%) allowed by Egyptian guidelines.
Table 6 Main pharmacokinetics parameters (mean ± SD, n = 24) after oral administration of single 500mg Etamsylate tablet test and reference.
|
Parameter
|
Test
|
Reference
|
|
t1/2 (h)
|
15.02 ± 0.03
|
14.06 ± 0.03
|
|
tmax (h)
|
5.73 ± 1.35
|
5.75 ± 1.29
|
|
AUC0 − t (µg*h/ml)
|
109.62 ± 24.78
|
106.18 ± 25.95
|
|
AUC0−∞ (µg*h/ml)
|
129.35 ± 27.72
|
127.69 ± 29.59
|
|
Cmax (µg/ml)
|
8.99 ± 1.99
|
9.40 ± 2.44
|
Table 7 The 90% confidence interval of (AUC0-t), (AUC0-∞), and Cmax for test/ reference (90% CI).
|
Parameter
|
Mean ratio (%)
|
90% CI (%)
|
| AUC0 − t( µg*h/ml)
|
103.06
|
98.250–108.10
|
|
AUC0−∞ (µg*h/ml)
|
100.95
|
97.190–104.86
|
|
Cmax (µg/ml)
|
96.410
|
91.870–101.16
|