Triple-negative breast cancer (TNBC), a highly malignant subtype of breast cancer (BC) that commonly affects females, is occurring at an increasingly younger age, yet there is a lack of clinically effective and safe drugs. The cross-kingdom regulation of plant microRNAs (miRNAs) in cancer immunotherapy has brought new therapeutic hope for TNBC. Here, we searched for plant miRNAs, twa-miRNA152-5p (miR152), from the anticancer plant Taxus wallichiana var. chinensis (Pilger) Florin, which can safely target to regulate human CTLA-4 immune checkpoint across kingdoms. The plant miRNA as a therapeutic requires safe and effective in vivo delivery technologies to prevent its degradation and mediate intracellular delivery. Therefore, we constructed a tumor-targeted folic acid-modified ionizable lipid nanoparticles vector to efficiently encapsulate miR152 and assist in targeted delivery of miR152 to tumor sites. The efficacy, immune antitumor mechanisms and biosafety of miR152 alone or in combination with clinical chemotherapeutic agents to treat TNBC were clarified in vitro and in vivo. The study demonstrated the potential for plant miRNAs cross-kingdom regulation as checkpoint inhibitors to exert immunotherapy in combination with chemotherapeutic drugs for potentiating antitumor efficacy.
Research Article
Immunotherapy induced by plant microRNA via ionizable Lipid Nanoparticles delivery enhances chemotherapy effects of Triple-negative breast cancer
https://doi.org/10.21203/rs.3.rs-3996189/v1
This work is licensed under a CC BY 4.0 License
Version 1
posted
You are reading this latest preprint version
Triple-negative breast cancer
Plant miRNA delivery
cross-kingdom regulation
twa-miR152-5p
immunotherapy
CTLA-4 inhibitor
Breast cancer (BC) is the highest incidence of female malignant tumors, with an exponential increase in morbidity and mortality in the past decade. Triple-negative breast cancer (TNBC) is a subtype of breast cancer that accounts for approximately 20% of cases[1, 2]. Due to its high genetic diversity and little response to hormone therapy, as well as low differentiation, high invasiveness, and easy metastasis, it has a higher recurrence and metastasis rate and mortality rate than ordinary BC. Currently, surgery and chemotherapy are still the standard core for TNBC[3]. Nevertheless, chemotherapy drugs are highly toxic and have little efficacy[4–6]. Once chemotherapy drug resistance occurs in patients, the tumor will rapidly relapse and metastasize. The overall survival rate of patients is usually less than 20 months[7, 8]. Therefore, the development of new drugs and treatments suitable for TNBC is urgent.
Immunotherapy against targets such as Programmed Cell Death 1(PDCD1, PD-1) has recently been reported to be successful in the treatment of a variety of tumors[9–16]. With the deepening of research, TNBC has been found to have a higher rate of tumor immune invasion and mutation than other types of BC[17–19]. Cytotoxic T lymphocyte-associated antigen-4 (CTLA-4) is an important target in Class 4 immunomodulation and is functionally important in driving regulatory cell (Treg). It accumulates in tumor tissues to inhibit anti-tumor immunity. After blocking CTLA-4, the tumor-infiltrating Treg function is deactivated, thus promoting T cell activation and enhancing intratumoral immune response. Significantly, studies have found that one of the mechanisms of immune escape from the tumor in BC is the inhibition of CTLA-4 on immune cells[20]. Therefore, targeting CTLA-4 for the treatment of BC is increasingly becoming a hot research direction[21, 22]. In addition to Yervoy, the world's first CTLA-4 inhibitor, there are currently dozens of drugs under development for CTLA-4[23, 24]. Although CTLA-4 antibody alone has a certain antitumor immune effect, the response rate of monotherapy for solid tumors is limited and the failure rate is high. Drugs like Yervoy can bind to normal tissues and peripheral blood cells due to their lack of selectivity, thus introducing many toxicities unrelated to the purpose for which they are administered[25–29]. In contrast, the combination of chemotherapeutics, radiotherapy, or others is more effective than the single treatment[30], but still inevitably produces greater toxic side effects.
RNA interference (RNAi)-mediated gene silencing has been extensively studied as an emerging approach to personalized cancer therapy[31–35]. One of these effector molecules is microRNAs (miRNAs). Similar to the RNAi mechanism, depending on the degree of complementarity of the miRNA to the 3'UTR region of the mRNA, it either inhibits its translation or specifically cleaves the degraded mRNA[36–38]. Interestingly, there has been growing evidence recently that, many miRNAs from plants can even regulate the expression of multiple target proteins in humans across the kingdom[38, 39]. Just like vitamins and minerals, miRNAs from dietary may be a seventh nutrient element in plants or may serve as an intensive treatment. Many researchers have also confirmed this idea, for example, miR20 from the herb Sculellaria barbata can effectively target TLR-4 inhibition and alleviate COVID-19-induced acute lung injury in mice[40, 41]. One report from Cell Research is successfully demonstrating that plant-derived miR159 can inhibit the growth of mammalian BC[42], which means that the cross-kingdom regulation of plant miRNA also has therapeutic potential in tumor treatment. Due to the high richness and diversity of plant miRNAs which are natural and convenient to obtain, we hope to lower the side effects and enhance the tumor treatment efficacy of chemotherapeutic drugs.
Unfortunately, serum nucleases in the blood degrade naked siRNAs and miRNAs. At the micro-level, they are mostly repelled by cell membranes because they are both negatively charged. The actual amount entering the cells is only approximately 0.7% of the injection dose[6]. Therefore, we anticipate a delivery system that can not only shield RNA molecules from degradation by nucleases in the bloodstream but also facilitate their optimal delivery into target cells without adverse reactions. In this regard, ionizable lipid nanoparticle platforms have proposed solutions for it, because of its good biocompatibility, biodegradability, easy production, low immunogenicity, and easy modification vector for targeting[43, 44]. These advantages have also been reflected in recent years in the anti-COVID-19 mRNA vaccines marketed by Pfizer and Moderna[45].
In this study, we first screened the Taxus wallichiana var. chinensis (Pilger) Florin (Taxus)-derived miRNA, twa-miR152-5p (miR152), targeting regulation of CTLA-4, and successfully verified its targeting properties and activity in vitro. Furthermore, a tumor-targeted ionizable LNP with suitable particle size, small PDI, and good stability was successfully constructed via microfluidic mixing ethanol solution of lipids with an aqueous solution of nucleic acid. Then, we explored the mechanisms against 4T1 tumors and the potentials of combination therapy of LNP containing miR152 with chemotherapeutics. Specifically, the in vivo CTLA-4 gene silencing effect of miR152 was explored by examining CTLA-4-related protein and gene in 4T1 tumor-bearing BALB/c mice. Moreover, we have studied and analyzed the regulatory effects of drugs on immune cells and factors in the immune microenvironment in vivo. By targeting and inhibiting the CTLA-4 gene expression, the miR152 has the potential to become an enhanced immunotherapeutic agent for TNBC and other cancers[46]. Together, the cross-kingdom regulation of plant miRNA for cancer immunotherapy can enhance antitumor efficacy in combination with chemotherapy.
Materials
1,2-distearoyl-sn-glycero-3-phosphocholine (DSPC), 2-Dimyristoyl-rac-glycero-3-methoxypolyethylene glycol-2000 (DMG-PEG2000), SM-102 were purchased from Shochem Biotech (Shanghai, CHN), 1,2-Dimyristoyl-rac-glycero-3-methoxypolyethylene glycol-2000- folate (Folate-DMG-PEG2000, FA) was purchased from Xi’an ruixi Biological (Xian CHN). Cholesterol was purchased from MilliporeSigma. Negative control (miR-NC), twa-miR152-5p (mimics), and has-miR-155-5p (mimics) were synthesized from the Gemma gene. PsiCHECK-2 and psiCHECK-2-3’-mRNA were synthesized from Sangon Biotech (Shanghai, CHN). Coumarin 6 (C6) and Cytoxan (CTX) were purchased from Aladdin (CHN). Doxorubicin (DOX) was purchased from Solarbio Science & Technology (Beijing, CHN).
Animal and cell lines
We adopt 4T1, B16, THP-1, HEK293T, and NIH3T3 cells in this study(Cell Resource Centre, Institute of Basic Medical Sciences, Chinese Academy of Medical Sciences). Animal experiments were performed using female BALB/c mice, 6-8 weeks of age, weighing 20 ± 2 g. (SPF Beijing Biotechnology, CHN). Mice were fed with standard chow for one week at 25°. Culturing was performed at 37°C with 5% CO2 in either RPMI 1640 or high-glucose DMEM medium. The culture media were enriched with 10% fetal bovine serum, accompanied by 100 U/mL penicillin and streptomycin. (Gibco, St. Louis, Missouri, USA). The animal experiments were conducted in accordance with the National Regulations for the Care and Use of Laboratory Animals in China and the National Research Council's Guide for the Care and Use of Laboratory Animals. It was approved by the Professional Committee of Animal Experimentation of Peking Union Medical College (Approval No. SLXD-20230425013).
Bioinformatic analysis
Prediction of target sites between mRNA and miRNAs. We used four classic tools to predict potential target sites of mRNA and miRNA, including Targetscan v8.0[47], RNAhybrid v2.1.2[48], miRanda v1.9-i686[49] (http://www.microrna.org/microrna/home.do), and PITA[50]. Except for miRanda, the parameters were set to default for the predictions. For miRanda, the energy threshold was set to -20.0 kcal/mol and the score threshold was set to 180. We integrated the results from these four tools and then took the intersection. Ultimately, we predicted a total of target sites between the 3′UTR of Genes in the cytotoxic T-lymphocyte protein 4 (Untranslated Regions) and twa-miR152-5p(miRNAs).
Dual-luciferase reporter assay
Vector sequences were synthesized by Sangon Biotech (Shanghai, CHN). The 3'UTRs of CTLA-4’s mRNA was cloned into the Not I and Xho I sites of the psiCHECK-2 vectors (Promega. USA). All constructs underwent sequencing verification. HEK293T cells in 96-well plates were transiently transfected with miR-152 mimics or scrambled negative control (miR-NC) using Lipofectamine 3000 (Invitrogen, USA). After 24 hours of incubation, 100 ng of luciferase vector psiCHECK2 or psiCHECK2-3'-mUTR was transfected into cells using Lipofectamine 3000 (Invitrogen, USA). After 24 hours of transfection, firefly luciferase and renilla luciferase were added sequentially to obtain fluc and rluc readings, and normalization was carried out (Solarbio Science & Technology)[51].
The activity of miR152 mimics in vitro
The logarithmically grown 4T1 or B16 cells were inoculated in 96-well culture plates with the concentration of 1.0 × 10⁴ cells per well. After incubation for 24 hours, miR152 was transfected by Lipofectamine 3000 (Invitrogen). Suspension cells THP-1 were inoculated with 3 ~ 4 × 10⁴ per well, and miR-155 was also transfected by Lipofectamine 3000 (Invitrogen). The final concentration of nucleic acid transfection was set at 0, 10, 50, 100, 200, 300, 400, 500, and 1000 nM, respectively, and all of them were set in a blank control group (acellular pore). Three parallel wells in each group were incubated for 48 hours. The adherent cells were replaced with a medium containing 10 % CCK8 (Solarbio Science & Technology), and the suspended cells were added with 10 % CCK8 solution, and incubated at 37°C for 2 ~ 4 hours. The absorbance value was measured using a microplate reader at the wavelength of 450 nm.
Preparation of LNP
The lipids DSPC, DMG-PEG2000, SM-102, Folate-DMG-PEG2000, and Cholesterol were dissolved in anhydrous ethanol according to the ratio (Table S2, the total concentration of lipids was 5 mg/mL), and miR152 mimics or miR-NC (6 μM) was dissolved in citrate buffer at pH 4.5 with a concentration of 0.1 M. LNP@DIR was dissolved in aqueous phase buffer with DIR (1 mg/mL) instead of miR, respectively. The preparation was carried out using a microfluidic system (NanoAssemblr, CHN) with a total flow rate (TFR) of 15 mL/min and a flow rate ratio (FRR) of 3: 1. Mature LNPs were also dialyzed and stirred in a PBS solution with pH 7.4 of 4 ℃ for at least 2 hours.
Particle Size and Zeta Potential
The particle size, zeta potential, and polydispersity indices (PDIs) of LNPs were assessed at room temperature through Dynamic Light Scattering (DLS) using Zeta Sizer Nano ZS (Malvern Instruments, UK). Each LNP sample underwent three consecutive measurements.
Storage stability of LNP
After LNP is prepared and mature, it is stored at 4 ℃, and its particle size and PDI changes on days 0, 2, 5, and 9 are monitored by Dynamic Light Scattering, parallel for 3 times (n = 3).
Cryogenic electron microscopy (Cryo-EM)
Lloyd's violet powder was prepared into 5mM working solution 0.22 filter membrane filtration, 10 % added to LNP, (i.e., 100 μL dye + 900 μL LNP) incubated at room temperature for 30 min, and the sample was prepared on the machine[52]. To prepare cryoEM grids, 2.5 μL of sample was applied to a Quantifoil 200 mesh grid, which was subsequently vitrified at 8°C using a Vitrobot Mark IV (ThermoFisher Scientific) immersed in liquid ethane. The image was acquired on a Talos Arctica using the EPU software with an accelerating voltage of 200 kV. The instrument is equipped with a 16-megapixel CCD camera using a nominal magnification of 59,000.
Encapsulation efficiency (EE) and drug loading (DL)
MiR-152 levels were determined utilizing the QubitTM 4 Fluorometer (Invitrogen, USA) and the Qubit miR Assay Kit (Invitrogen, USA). The excitation wavelength is 545nm, emission wavelength is 595nm. Adding the LNP suspension encapsulating miRNA into 10-fold volume of DMSO to destroy the LNP and release miRNA in LNP for quntifying the content of miRNA. Encapsulation efficiency (EE) and drug loading (DL) were computed using the following equations.

In vitro cell safety experiments of LNP
1.0 × 10⁴ logarithmically proliferated 4T1 cells or NIH3T3 cells were cultured into per well of 96-well culture plates, respectively. Following a 24-hour incubation period, the culture medium containing the LNP vector (at concentrations of 0, 18.8, 37.5, 50, 75, 375, and 750 μg/mL) was replaced. Additionally, a blank control group (acellular pore) was established. Each group consisted of four replicates. After 24 or 48 hours of incubation, 10 μL of CCK-8 solution was added and the absorbance value was recorded at 450 nm after another 4 hours.

In vitro hemolysis
4 mL of whole blood was collected from SD rats by abdominal aortic sampling and added to 8 mL of normal saline. 3000 g centrifugation was performed for 5 min to separate the erythrocytes from the whole blood. Then the supernatant was washed with saline to show a transparent and colorless state, and 1 mL of the lower layer of erythrocytes was added to 50 mL of saline and mixed homogeneously to obtain a 2 % erythrocyte suspension. To determine the positive and negative controls, take 1 mL of erythrocyte suspension and mix it with 1 mL of double-distilled water or saline. Add it to 1 mL of gradient concentration nanoparticle solution as experimental group respectively. The concentrations of the experimental groups were 1000, 500, 250, 125, 62.5, 31.25, and 15.625 μg/mL, respectively. Following vortexing, each set of solutions underwent a 1-hour incubation at 37 °C on a shaker, followed by centrifugation. Subsequently, 100 μL of the supernatant was transferred to a 96-well plate, and the absorbance of hemoglobin at 570 nm was measured with 540 nm as the reference wavelength.

In vitro antitumor assay
Logarithmically proliferated 4T1 or B16 cells were harvested and seeded into 96-well culture plates at a density of 1.0 × 10⁴ cells per well. After incubation for 24 hours, the solution containing LNP@miR152 or LNP@miR-NC (miR experimental concentration was 200 nM) was replaced, and the next day was replaced with a gradient concentration of the chemotherapeutic drug DOX or CTX. where the gradient concentration of CTX was 0, 1, 10, 15, 20 mM, and the gradient concentration of DOX was 0, 0.05, 0.1, 0.2, 0.5 μg/mL[53]. A blank control group was also set up (acellular pore). 4 parallel wells in each group were incubated for 48 hours. The blank medium was replaced and each well was incubated with 10 μL of CCK8 solution for 2 ~ 4 hours. The absorbance values were measured at 450 nm using an enzyme meter.
The in vitro antitumor activity of the combination at DOX of 0.5 μg/mL was observed individually. Inoculate 4T1 or B16 cells in 96-well culture plates at 1.0 × 10⁴ cells per well. After the cells were cultured for 24 hours until they were completely attached to the wall, they were replaced with the solution containing LNP@miR-NC, LNP@miR152, DOX, LNP@miR152/DOX (miR was 200 nM), and six blank control groups were set up in each group, and then incubated for 48 hours. The activity of the cells was detected by CCK8.
In vitro cellular uptake and lysosome escape
LNP@C6 was prepared using coumarin 6 (C6) as an aqueous phase model drug, in which 5 mg/mL of lipid percentage DSPC: DMG-PEG 2000: SM-102: Folate-DMG-PEG2000: Cholesterol was 10: 3: 40: 2: 50, and C6 was dissolved in 125 μg/mL of citrate buffer as previously mentioned LNP@C6 was prepared. Logarithmic growth phase 4T1 or NIH3T3 cells were inoculated in 48-well plates at a concentration of 1.3 × 10⁵ cells/mL. After the cells were cultured for 24 hours until they were completely attached to the wall, they were replaced with 200 μL of fresh medium, and 20 μL of LNP@C6 solution was added to each well, respectively (where the experimental concentration of C6 was determined by HPLC as 2.9 μg/mL). The spots were taken at 6, 4, 2, and 1 hours for lysosome-tracker-red staining for 30 min according to the concentration suggested in the instruction manual, PBS washed once, 2 μg/mL DAPI staining for 10 min, PBS washed again, and the cells were fixed with 4 % paraformaldehyde, and observed under the fluorescence microscope.
In vivo distribution
Animal model construction was performed using female BALB/c mice, 7 weeks of age. 100 μL of 4T1 cell suspension (3 × 10⁶ cells/mL) was inoculated under the left breast pad. After the tumor size reached 300 mm3, three groups of mice were randomly assigned, each including five mice. These groups were then treated with 200 μL of either free DIR or LNP@DIR (20 μg of DIR per mice) through tail vein injection. After 48 hours, the mice were euthanized and their hearts, livers, spleens, lungs, kidneys, and tumors were dissected and collected. The drug distribution in vivo was visualized using a small animal optical imaging system. (Hopkinton, MA, USA). The distribution of the drug in the body was calculated from the fluorescence intensity values.
Quantification of the miRNA/mRNA expression levels by qPCR
miRNA quantification - reverse transcription was performed using MicroRNA Reverse Transcription Kit (Applied Biosystems, Foster City, CA) according to the manufacturer's protocol. mRNA quantification - reverse transcription was performed using HiScript III 1st Strand cDNA Synthesis Kit (+gDNA wiper) (Nanjing Vazyme Biotech, CHN) according to the manufacturer's protocol. To analyze gene expression, quantitative PCR analyses were conducted using cDNAs extracted from cellular samples, along with optimized primer pairs targeting CTLA-4. (forward, 5′-GTGCCACGACATTCACAGAG-3′; reverse, 5′-CGTCCCGTTGCCCATG-3′); IL-10 (forward, 5′-ACTCCTTGGAAAACCTCG-3′; reverse, 5′-AAGAACCCCTCCCATCAT-3′). Relative gene expression of the target gene was calculated by ∆∆Ct method using a reference housekeeping gene ACTIN (forward, 5′- CCATCTACGAGGGCTATGCT-3′; reverse, 5′CTTTGATGTCACGCACGATT-3′). Twa-miR152-5p mimics (forward, 5′- TTATTTGTTTGGACATTTGG-3′; reverse, 5′- GGCCAACCGCGAGAAGATG-3′). Relative expression of miRNAs was calculated by ∆∆Ct method using a reference housekeeping miRNA U6 (forward, 5′-CTGCGCAAGGATGACACGCAAATT-3’; reverse, 5′-AACGCTTCACGAATTTGCGT-3′). Experiments were repeated three times.
In vivo antitumor assay
100 μL of 4T1 cell suspension (3 × 10⁶ cells/mL) was inoculated under the left breast pad of BALB/c mice, and the tumor size was observed until 50-90 mm3 ( approximately 10 d). Then 72 mice were randomly divided into 6 groups[54]. Mice were injected tail vein using saline, miR152, LNP@miR152, DOX, and LNP@miR152/DOX at a dose of 2 mg/kg (doxorubicin-based) or 13.5 nmol/kg (based on miR152)[40] per mice every day. Tumor size was calculated by measuring the longest diameter of the tumor (a) and the perpendicular transverse diameter of the tumor (b) using vernier calipers every two days after drug administration. The volume of the displaced tumor was then calculated using the formula V = 1/2 × ab2, and a tumor growth curve was generated. The mice were administered continuously for 14 days, and orbital blood was taken and euthanized 24 hours after the last administration. Serum was centrifuged, hearts, livers, spleens, lungs, kidneys, and tumors were taken, tumor sizes were determined, immersed in tissue fixative for immunophenotyping, and paraffin-embedded sections (3 - 5 μm) were made 24 hours later. Then, the tissues were soaked for 24 hours using tissue fixative, paraffin-embedded sections (3 - 5 μm) were made and colored with hematoxylin-eosin (H&E). Tumor sections were colored based on the recommended doses in TUNEL, immunohistochemistry (IHC) and immunofluorescence (IF). Then observing using a fluorescence microscope (PSC603-076).
Flow cytometry evaluation (FCM)
Fresh tumor tissue was taken as 50 mg, mechanically separated to about 1 mm3, and lysed with 1 mg/mL Collagenase II and 0.5 mg/mL DNase in a water bath at 37 ℃. Cells were filtered through 100 μm nylon membranes, and single-cell suspensions were washed three times with PBS. To obtain the cells for analysis, 500-600 μL of blood was collected from the mouse eyeballs and placed in an anticoagulation tube. The tube was rotated to prevent blood clumping, and erythrocyte lysate was added in a 10:1 ratio. After centrifugation (5 min,1,000 r/min), the supernatant was discarded, and the procedure was repeated once. The precipitate was aspirated into an EP tube, and 1 mL of PBS was added while gently blowing to avoid cell damage. Add CD3-PE, CD4-APC, CD8-FITC, CD45-percp-cy5.5, and CD25-BV42 antibodies, and the cells were incubated for 25 ~ 30 minutes in dark and washed before analysis using flow cytometry. The intracellular fluorescence intensity was measured, and the lymphocyte subpopulation was analyzed.CD45+ CD3+ CD4+ indicates CD4+ T cells, CD45+ CD3+ CD8+ indicates CD8+ T cells, and CD45+ CD3+ CD4+ CD25+ indicates Treg cells.
Enzyme linked immunosorbent assay (ELISA)
Tumor tissues were separated into bite-sized pieces and rinsed in sterile PBS (0.02 mol/L, pH 7.4) at a temperature of about 4 ℃ to remove the residual blood in it, drained of excess water and weighed. The homogenizing solution, protease inhibitor (Thermo Scientific, USA) and small steel beads were added and thoroughly ground in a homogenizer. Centrifuge (3000 rpm for 15 min) the already processed tissue mixure and retain the supernatant. The levels of tumor necrosis factor α (TNF-α), IL-2, and IL-10 were measured by ELISA (Invitrogen, USA) according to the kit instructions. The protein concentration of each group was also quantified by BCA kit, and the ELISA results were analyzed after protein equilibration.
Statistical Analysis.
All data are shown as mean ± SEM. Differences were analyzed using two-tailed t-tests. (* or # p < 0.05; ** or ## p < 0.01; *** or ### p < 0.001; **** or #### p < 0.0001). Data analysis and plotting were performed using GraphPad Prism 8.
In vitro efficacy of miRNAs and characterization of its ionizable lipid nanoparticles
At first, we screened the active twa-miRNA152-5p (miR152) targeting CTLA-4 from the classic anti-cancer plant Taxus by computer simulation. The activity of miR152 was evaluated in vitro. To exclude the influence of the experiment itself, we selected hsa-miR-155-5p (Table S1), which has been reported to be active, as a positive control and transfected THP-1 cells simultaneously. Also, in order to observe whether the plant miR152 is universal for antitumor in vitro, miR152 was chosen to be transfected into two solid tumor cells, B16 and 4T1, respectively. To our delight, similar to the reported activity of hsa-miR-155, miR152 showed obvious antitumor activity in vitro in both 4T1 and B16 cell lines and the antitumor activity of plant miR152 showed a parabolic change with the increase of transfection concentration, among which the activity was strongest when the transfection concentration was 200–300 nM (Fig. 1, A). However, the antitumor activity is reduced if the transfection concentration is too high. We speculate that this is caused by off-target effects with high concentrations of nucleic acid, while transfection with low concentrations avoids off-target effects[46]. In this study, in order to verify that the selected nucleic acid can accurately target CTLA-4, we constructed the original plasmid psiCHECK-2 and the target plasmid psiCHECK-2-3’-mRNA containing the CTLA-4 protein-coding gene, which were transfected into HEK293T cells in groups. Detection of fluorescent signal intensity by dual- luciferase showed a significant decrease in RLU due to the combination of miR152 to the target sequence of psiCHECK-2-3'-mRNA compared to miRNA negative control (miR-NC) or psiCHECK-2 (Fig. S1, p < 0.1).
Next, we used microfluidic methods to construct miR152 lipid nanoparticles that can target tumor cells by controlling the amount of folic acid-modified lipids added (Fig. 1, B). Due to the presence of folic acid, the uptake of LNP in 4T1 tumor cells could be accelerated to a certain extent with the increase of folic acid-modified lipids (FA) supplemental level. When the FA supplemental level was 2% or above, the uptake of LNP in vitro reached saturation for 4 hours (Fig. S2, A). Combined with the particle size parameters of LNP at different additive amounts (Fig. 1, C), we determined that a tumor-targeted ionizable LNP with appropriate particle size, small PDI (Fig. 1, D, size = 120 nm, PDI = 0.127) and good stability (Fig. 1, E, F) could be constructed when the additive amount of FA was 2%. The encapsulation rate of miR152 was measured to be 99.8% by Qubit TM 4 Fluorometer. The miR152 loading capacity was 1,000.67 ng/mg. It was observed in cryo-EM that a bleb structure existed in the mature LNP, and a large number of miRNAs existed in this bleb structure, showing the characteristic mottled structure (Fig. 1, G). The presence of a bleb structure can protect the stable delivery of miRNAs into the body[55].
In vitro transfection and lysosomal escape efficacy, activity and target verification of LNP@miR152
Having confirmed the activity of miR152 and prepared the suitable tumor-targeted LNP, we attempted to observe the antitumor performance of plant miRNA combined with chemotherapeutic drugs. Firstly, in the in vitro level study, we verified that LNP had no obvious toxicity to either normal or tumor cells within 24 or even 48 hours (Fig. S2, B), and had a higher affinity for tumor cells compared with normal cells (Fig. S2, C). The addition of SM-102 ionizable lipids further allows LNP to both wrap negatively charged miRNAs in a neutral environment to form protection, and to escape after endocytosis in the acidic nature of lysosomes through the proton pump effect[56]. Saturation of uptake was observed at 6 hours in 4T1 tumor cells and lysosomal escape was observed at 2 hours (Fig. 2, A). Next, we selected two classical chemotherapeutic agents: Cytoxan (CTX) and Doxorubicin (DOX) and determined their experimental concentration intervals (Fig. S2, D), both of which have good anti-tumor effects as single agents but both of which have reported significant toxicities in the clinic. With miRNA negative control mimics (LNP@miR-NC) as a negative control, we first transfected the 4T1 and B16 tumor cells with LNP@miR152 at 200 nM concentration and then replaced it with a gradient concentration chemotherapeutic drug environment 24 hours later. To our delight, LNP@miR152 can improve the tumor cell inhibition rate of monotherapy at the same chemotherapeutic drug concentration. The effect of DOX combined with LNP@miR152 became more and more obvious with the increase in DOX dosage (Fig. 2, B). When DOX was used at 0.5 µg/mL, there were significant differences between the combined treatment group (group LNP@miR152/DOX) and the single treatment group (groups LNP@miR152 and DOX), and this difference was most obvious in the 4T1 cell line (Fig. 2, C, p < 0.0001). Further, we detected the expression of the CTLA-4 gene in the 4T1 cell line after transfection with miR152 in vitro. Q-PCR revealed that the expression of CTLA-4 mRNA in 4T1 cells for LNP@miR152 group was significantly reduced (Fig. 2, D, p < 0.001), indicating that miR152 played an inhibitory role in degrading or cutting CTLA-4 mRNA.
In vivo tumor-targeted miRNA Delivery via LNP
Encouragingly, in vivo imaging system (IVIS) results showed that the high-affinity property of LNP for tumor cells had the same trend in vivo. Tumor sites of 4T1 in situ loaded mice were seen to have significantly higher fluorescence intensity of LNP-delivered DIR than nude DIR solution (Fig. 3, A-iii, p < 0.01). In the pharmacokinetic study, we administered female BALB/c mice with in situ tumor-loaded 4T1 breast cancer by tail vein for 2 consecutive weeks. Significant levels of exogenous plant miR152 were detected in the blood and tumor tissue sites of mice administered with naked miR152 (miR152 group) and mice administered with LNP-encapsulated miR152 (LNP@miR152 group) in comparison with the model group injected with saline (Fig. 3, B, p < 0.0001), and were identified as twa-miR152-5p by sequencing (Fig. S3). It is also noteworthy that the LNP@miR152 group had a more substantial detection level of miR152 in comparison with the miR152 group (Fig. 3, B, p < 0.0001), which implies that LNP indeed protects the exogenous nucleic acids from degradation, stably exists in the bloodstream and targets the tumor site.
In vivo anti-4T1 tumor efficacy evaluation
The good pharmacokinetic performance and in vivo antitumor effect of LNP@miR152 prompted us to further verify whether the LNP vector delivering miR152 in vivo also has an excellent antitumor effect. In the study at the in vivo level, female BALB/c mice were inoculated with mouse breast cancer cell line 4T1 to establish a model and were randomly divided into blank group, model group, naked miR152 group (miR152), LNP@miR152 group, doxorubicin group alone (DOX), and LNP@miR152 combined with doxorubicin group (LNP@miR152/DOX). The tumor growth of mice in each group was recorded, and the mice were killed after 14 days of continuous tail vein injection. The tumor was isolated to record the size, H&E to observe the organ and tumor microscopic morphology, immunohistochemistry, ELISA and q-PCR to detect the tumor and immune-related indexes, and immunofluorescence and flow cytometer (FCM) to detect the tumor or the tumor and peripheral blood immune cell subtypes, respectively. In this study, we first evaluated the hemolysis of LNP carriers, and the results showed that there was no obvious hemolysis phenomenon below 500 µg/mL (Fig. S4). When the tumor grew to a volume of 50 ~ 90 mm3, each mouse was administered in groups through the tail vein, and the dosage of miR152 was controlled to 13.5 nmol/kg per mouse. The above indexes were detected after 14 days of continuous administration (Fig. 4, A).
To our delight, as expected, some degree of inhibition of tumor growth rate was observed in the administration group over time. We were excited to see that the growth rate of the tumor growth curve was the slowest in the LNP@miR152/DOX group, which was significantly lower than that in the model group (Fig. 4, B, p < 0.5). The tumors in situ were isolated and obtained on day 15, and the tumors were seen from large to small in the Model, miR152, LNP@miR152, DOX, and the smallest size LNP@miR152/DOX groups (Fig. S5). In addition, through the analysis of the spleen index of mice in each group, we found that the spleen of tumor-bearing mice was greatly enlarged, which was because the spleen, as the largest immune organ in the body, was playing an antitumor immunotherapy role, and the burden of the spleen could be significantly reduced in the drug administration group. The spleen index in groups DOX and LNP@miR152/DOX recovered to a normal level (Fig. 4, C).
Further, we investigated the antitumor efficacy and mechanism of antitumor immunotherapy in vivo. We first combined the results of H&E, TUNEL, immunohistochemistry (IHC) and immunofluorescence (IF) for semi-quantitative analysis and the mechanism was verified by flow cytometry (FCM) and q-PCR. Firstly, the H&E results indicated the tumor histomorphology and the group model showed typical pathological characteristics of tumors, with cells closely arranged, complete structure, mostly fusiform, complete and clear nuclei, stained uniformly blue, more mitotic images, and less interstitial tissue. On the contrary, it could be seen that tumor cells in the obvious vascular drug administration group were looser than those in the group model, and the nuclei began to contract. In the lysis phenomenon, necrotic cells appeared, cytoplasmic staining signal was weakened, mesenchyme was enlarged, and the number of blood vessels was reduced. Among them, tumor cells in group LNP@miR152/DOX had the loosest arrangement, a large number of nuclei dissolved and fragmented, a large number of necrotic cells appeared, and the cytoplasmic staining signal was the weakest. The mesenchyme became larger, and the number of blood vessels became fewer (Fig. 4, D). CD31 is usually used to evaluate tumor microvasculature. MMP9 indicates the degree of tumor cell necrosis, and the higher the positive rate of Ki67 indicates the higher the ability of tumor invasion and metastasis. To our satisfaction, the expression levels of these three tumor indicators in group LNP@miR152/DOX were significantly lower than those in the group model, and the expression levels of CD31 and Ki67 were significantly lower than those in single-drug groups (groups LNP@miR152 and LNP@miR152/DOX) (Fig. 4, E, F). And TUNEL's fluorescence results suggest the same (Fig. 4, G, H, DOX with LNP@miR152/DOX, p < 0.0001). This suggests that combined administration can produce a more significant tumor-killing effect than a single DOX, that is, a synergistic effect.
Subsequently, IHC, IF, FCM, ELISA and q-PCR were used to analyze the expression of immune-related cells and cytokines at the tumor site. Tumor immune microenvironment (TME) is mainly composed of immune cells and immune cytokines[57]. T cells include Helper T cells (Th) and Cytotoxic T cells (CTL, Tc). The important markers of Th and CTL subsets are CD4+ and CD8+, and Th is mainly divided into Th1 and Th2 according to function, among which Th1 mainly secretes Interleukin 2 (IL-2), Tumor necrosis factor α (TNF-α), Interferon γ (IFN-γ), etc., and mediate antitumor cellular immune response, while Th2 mainly secretes Interleukin 10 (IL-10), etc., and mediates humoral immune response. Tumor-associated macrophages (TAMs) are macrophages infiltrated in tumor tissue, which are also an important component of TME[58]. Studies in mice have also found that TAM can stimulate tumor angiogenesis, assist tumor cell migration and invasion, and inhibit tumor immunity. In TAM, M1 uses CD86 as a surface marker and secretes TNF-a, INOS, etc., to produce tumor resistance; M2 uses CD206 as a common surface protein marker and secretes IL-10, ARG1, etc., to promote the growth of malignant tumor cells[59].
CTLA-4 gene silencing effect and immune-related cytokines analysis
Since the designed target of miR152 is CTLA-4, inhibiting the expression of the CTLA-4 gene at the tumor site can release the inhibition of Treg. Therefore, we directly examined CTLA-4 translation and protein expression levels at the q-PCR and IHC levels (Fig. 5, A, B). The results showed that administration of miR152 could extremely significantly reduce the protein and mRNA levels of CTLA-4 in tumor tissues compared with the model group (Fig. 5, B, p < 0.0001). The LNP@miR152 group could further exert the targeting inhibition of CTLA-4 mRNA by nude miR152 with the help of vector LNP (Fig. 5, B-ii, p < 0.0001). At the same time, PCR, ELISA and IHC also showed differences in the expression of immune cytokines IL-2, IFN-γ, TNF-α, IL-10 at different levels (Fig. 5, C ~ F). Similarly, the secretion of Th1-related cytokine IL10 was decreased at IHC, ELISA or q-PCR levels in LNP@miR152/DOX group compared with the model group or DOX group (Fig. 5, D-iii, E, F-ii). IFN-γ and TNF-α were mutually corroborated by increased secretion in ELISA and IHC experiments (Fig. 5, D-ii, D-iii, F-ii, F-iii). And the LNP@miR152/DOX group also showed the highest expression of IL-2 in ELISA experiments (Fig. 5, F-i). It was also significant that LNP@miR152 group had better performance at IHC or ELISA levels with the help of the carrier LNP than nude miR152 (group miR152), including fewer tumor microvascular levels (Fig. 4, F-ii, CD31, p < 0.01), higher IFN-γ (Fig. 4, D-ii, p < 0.05), TNF-α (Fig. 4, D-iii, p < 0.01) and IL-2 (F4, G-i, p < 0.001) expression, etc.
Regulation of immune cell subtype
The IF study further corroborated the mechanism that miR152 forms an anti-tumor immunotherapy mechanism by regulating immune cells. The study was carried out by labeling CD4+ Treg cells with FoxP3 and CD8+ Tc cells with GranB. It can be seen that FoxP3 fluorescence decreased while GranB intensity increased in the miR152 group, and this trend of GranB change was most obvious in the combination (F6, A ~ D). It suggests that miR152 can increase Tc cell infiltration at the tumor site, directly kill cancer cells while reducing the proportion of CD4+ Treg cells, and lift some immunosuppression. Similarly, we continued to compare the fluorescence expression intensity of CD86 and CD206 in each group. The results showed that the fluorescence intensity of M1 markers was elevated. The fluorescence of M2 markers was weakened in the miR152 group, and even more so in the LNP@miR152/DOX group, which was speculated that miR152 could help TAM to become M1 and act synergically with DOX (Fig. 6, F ~ I). Likewise, in the context of IHC, by labeling the proteins ARG1 or INOS in M1 or M2 type macrophages. We found that the drugs stimulated the shift of TAM to M1 type at the tumor site, and the advantage of combined administration was also demonstrated at the level of ARG1, which was significantly lower in the LNP@miR152/DOX than in the DOX group (Fig.. 6, K-i, p < 0.01).
Fresh tumor tissues were collected, peripheral blood immune cells and tumor infiltrating T cells were detected by flow cytometry, and the distribution and proportion of tumor sites and peripheral blood lymphocyte subsets (CD4+, CD8+) in each group were analyzed (CD4+ Th cells: CD4+, CD3+; CD8+ Tc cells: CD8+, CD3+; Treg cells: CD4+, CD25+, CD3+) (Fig. S6). We then got an interesting result that the proportion of T lymphocyte subsets in peripheral blood and tumor sites seemed to change in reverse after administration. This was reflected in the increased proportion of CD4+ subgroup in peripheral blood of group LNP@miR152/DOX compared with the group model (Fig. 6, E-ii, p < 0.01), and decreased in tumor tissue compared with the group model (Fig. 6, E-i, p < 0.01). Similarly, the proportion of CD8+ subgroups in peripheral blood decreased to different degrees in all groups (Fig. 6, E-ii), but significantly increased at tumor sites (Fig. 6, E-i, p < 0.001). This seems to tell us that the drug miR152 can further recruit peripheral blood CD8+ immune cells to soak into the tumor site to kill the tumor directly. In addition, with combination therapy (group LNP@miR152/DOX), the proportion of Treg cells can be further reduced, both at the tumor site and in peripheral blood, compared with group LNP@miR152, group DOX or group model (Fig. 6, E).
Because of the large toxic side effects of chemical drugs in the clinic, in order to further quantitatively analyze whether miR152 could reduce the organ toxicity of DOX, we collected serum for liver and kidney biochemical function. As a result, not surprisingly, we observed significant hepatic and renal injuries in the DOX group, including extremely significant elevation of serum AST, BUN, and CRE. By combined administration of LNP@miR152/DOX, we were pleased to find that all of these indexes were greatly regressed, and there was no significant difference with the indexes in blank mice (Fig. S7, B). This result also coincided with H&E staining, and we similarly found that the LNP@miR152/DOX group could improve the problem of cardiomyocyte breakage produced due to the use of DOX, attenuate inflammation relative cells infiltration in hepatic tissues, and enhance the immune function of the organism by increasing the macrophage content in the splenic cord along with the retuning of splenic indices (Fig. S7, A).
Collectively, we screened miR152 from Taxus chinensis, a classic anti-cancer plant, and designed ionizable lipid nanoparticles for its targeted delivery to tumor tissues and cells using microfluidics. The particle has a high encapsulation rate and good drug loading, which can improve the stability of miRNA in the carrier by forming a bleb structure, and significantly improve the detectability of exogenous miR152 in vivo after delivery. At the same time, we also demonstrated that plant-derived miRNA152 mimics can across kindom target silence CTLA-4 gene in mammals, inhibit the proportion of Treg cells in T cells in vivo, increase the proportion of CD8+ Tc in tumor sites, directly kill tumors[60, 61], promote the secretion of Th1 and M1-related cytokines such as TNF-α, IFN-γ, IL-2, and reduce the production of IL-10, enhance the body's antitumor immune response[62]. On the other hand, the LNP vector constructed in this experiment achieved the effect of efficiently encapsulating plant miRNAs for cross-kingdom targeted delivery to mammalian tumor sites, which further improved the stability of plant miRNAs in animals. We reasonably speculate that this vector also has great potential for nucleic acid drug tumor delivery.
This result is of great value in the treatment of breast cancer, suggesting that plant-derived miRNA not only has a clear antitumor effect[63–65] but also may become a new adjuvant therapy[66], which can greatly improve its antitumor effect while reducing the toxic and side effects of chemical drugs, just like other plant-derived bioactive compounds[67]. Nature seems to provide precise treatment for many human diseases. Due to the high richness and diversity of plant miRNAs, which are natural and convenient to obtain, they have more obvious advantages in the treatment of tumors compared with chemotherapy drugs. The Taxus derived miRNA152 screened in this study is expected to become an enhanced immunotherapy in the treatment of cancers such as TNBC by targeting and inhibiting the CTLA-4 gene, which provides a new and safe choice direction for the treatment of tumor combination drugs. Plant-derived miRNAs regulate animal protein expression across kingdoms. It not only overturns the previous concept of digestion and absorption but also provides ideas for finding new medicinal ingredients. We started from the classical anticancer plant, Taxus wallichiana var. chinensis (Pilger) Florin, to excavate miR152 for antitumor immunity activity, in order to bring more inspiration to researchers on the basic research of phytopharmaceutical substances.
Herein, the twa-miR152-5p (miR152) screened from Taxus wallichiana var. chinensis (Pilger) Florin (Taxus) targeting CTLA-4 was verified its target and antitumor activity at the cellular level. A tumor-targeted ionizable lipid nanoparticle system was constructed utilizing a microfluidic chip to deliver miRNA efficiently. The ionizable LNPs were characterized by DLS, cryo-EM to confirm the uniform of preparation technology. The IVIS test and miRNA determination in vivo exhibited higher blood and tumor distribution of LNPs than nude drugs. The miR152 was demonstrated to be an enhanced immunotherapeutic agent and enhanced chemotherapy effects of DOX for TNBC. Specifically, the miR152 could target silence CTLA-4 gene, reduce Treg cells percentage in the tumor sites, increase CD8+ cytotoxic T cells percentage, and enhance the immunity of the body in antitumor therapy. This result is of great value to treat BC and suggests that plant-derived miRNA not only has a clear antitumor effect but also may become a new adjuvant therapy that can greatly improve its antitumor effect while reducing the side effects of chemotherapeutics, which provides a novel and safe choice direction for the treatment of tumor combination drugs. Moreover, plant-derived miRNAs regulate human protein expression across kingdoms, which not only subverts the previous concept of digestion and absorption but also provides a new paradigm for finding new drugs.
Author Contributions
Conceptualization, Y. L. and Z.D.; Data curation, H.Y. and Y.L.; Formal analysis, H.Y. and Y.F.; Funding acquisition, Y.L. and Z.D.; Investigation, Y.L. H.Y., Y.F. and Z.W.; Methodology, H.Y., T.Z., S.S., L.M., and Y.X.; Validation, S.L., M.H., C.L.; Project administration, Y.L., L.M. and Z.D.; Resources, Y.L., L.M., and Z.D.; Software, H.Y., Y.F. and T.Z.; Writing—original draft, H.Y., and Y.F.; Writing—review and editing, Y.L., H.Y., Y.F., L.M. and Z.D. All authors have read and agreed to the published version of the manuscript.
Acknowledgments
This work was financially supported by the National Natural Science Foundation of China (No. 82304733, No.82373807), CAMS Innovation Fund for Medical Science (CIFMS) (Nos. 2021-I2M-1-022, 2022-I2M-2-001, 2022-I2M-2-002, and 2021-I2M-1-018), Beijing Natural Science Foundation (Z220022), the National Key Research and Development Program of China (71932271), and the Jilin Scientific and Technological Development Program (No. 20230401102YY). We thank the support of the State Key Laboratory for Quality Ensurance and Sustainable Use of Dao-di Herbs.
Institutional Review Board Statement
The study was conducted in accordance with the standard of the National Regulation of China for the Care and Use of Laboratory Animals complied with the National Research Council's Guide for the Care and Use of Laboratory Animals, and was approved by the Animal Testing Committee of Peking Union Medical College (protocol code: SLXD-20230425013 and date of approval: 21 April 2023).
Declaration of Interests
The authors declare that they have no known competing financial interests or personal relationships that could have appeared to influence the work reported in this paper.
Data Availability Statement
Data will be made available on request.
- He Q, Peng Y, Sun J, Liu J: Platinum-Based Chemotherapy and Immunotherapy in Early Triple-Negative Breast Cancer: A Meta-Analysis and Indirect Treatment Comparison. Front Oncol 2021, 11:693542.
- Zhu Y, Zhu X, Tang C, Guan X, Zhang W: Progress and challenges of immunotherapy in triple-negative breast cancer. Biochim Biophys Acta Rev Cancer 2021, 1876:188593.
- Bergin ART, Loi S: Triple-negative breast cancer: recent treatment advances. F1000Res 2019, 8.
- Jing H, Cheng W, Li S, Wu B, Leng X, Xu S, Tian J: Novel cell-penetrating peptide-loaded nanobubbles synergized with ultrasound irradiation enhance EGFR siRNA delivery for triple negative Breast cancer therapy. Colloids and Surfaces B: Biointerfaces 2016, 146:387-395.
- Liu Y, Zhu Y-H, Mao C-Q, Dou S, Shen S, Tan Z-B, Wang J: Triple negative breast cancer therapy with CDK1 siRNA delivered by cationic lipid assisted PEG-PLA nanoparticles. Journal of Controlled Release 2014, 192:114-121.
- Parvani JG, Jackson MW: Silencing the roadblocks to effective triple-negative breast cancer treatments by siRNA nanoparticles. Endocr Relat Cancer 2017, 24:R81-r97.
- Yin L, Duan J-J, Bian X-W, Yu S-C: Triple-negative breast cancer molecular subtyping and treatment progress. In Breast cancer research : BCR, vol. 22. pp. 61; 2020:61.
- Lin HY, Chu PY: Advances in Understanding Mitochondrial MicroRNAs (mitomiRs) on the Pathogenesis of Triple-Negative Breast Cancer (TNBC). Oxid Med Cell Longev 2021, 2021:5517777.
- Reddy NKM: Changing landscape of immuno-oncology: CAR-T therapy and PD1/PDL1 blockade. 2016.
- Elvin JA, Goldberg ME, Gay LM, Suh J, Vergilio J-A, Ramkissoon SH, Ali SM, Schrock A, Fabrizio D, Frampton G, et al: Profiling of Tumor Mutational Burden and PD1/PDL1 Immunohistochemistry (INC) in Non-Small Cell Lung Cancer. Laboratory Investigation 2017, 97:477A-477A.
- Liu Q, Li B, Zeng Y, Chen H, Poznanskey M, Cao X: Lower dose paclitaxel augments the efficacy of PD1/PDL1 blockade therapy in ovarian cancer by reprogramming tumor microenvironment. European Journal of Immunology 2019, 49:1739-1739.
- Tan Q, Wang Y, Liu S, Luo R, Wang S, Liang T, Yang J, Xing P, Yao J, Wu D, et al: Distribution of anti-PD1/PDL1 autoantibodies in multiple cancer types and potential biomarker role for anti-PD1 therapy. Annals of Oncology 2020, 31:S1097-S1098.
- Teo MY, Whiting K, Mota JM, Li H, Regazzi AM, Solit DB, Aggen DH, Lee C-H, Funt SA, Bajorin DF, et al: Clinicogenomic predictors of extreme responses to anti-PD1/PDL1 checkpoint inhibitors (CPI) in metastatic urothelial cancer (mUC). Journal of Clinical Oncology 2020, 38.
- Tian K, Wang X: Clinical analysis of patients (pts) with Lung cancer treated with anti-PD1/PDL1 therapy. Journal of Clinical Oncology 2022, 40.
- Tobias J, Battin C, Linhares ADS, Karin B, Ambroye K, Drinic M, Garner-Spitzer E, Zielinski C, Kundi M, Steinberger P, Wiedermann U: Identification of PD1 B cell mimotopes with functional PD1-PDL1 blocking capacity: New strategy for cancer immunotherapy. Cancer Research 2019, 79.
- Zhao X, Liu S, Su J: Clinical analysis of patients (pts) with lung cancer treated with anti-PD1/PDL1 therapy. Cancer Research 2023, 83.
- Safonov A, Jiang T, Bianchini G, Győrffy B, Karn T, Hatzis C, Pusztai L: Immune Gene Expression Is Associated with Genomic Aberrations in Breast Cancer. Cancer Res 2017, 77:3317-3324.
- Luo C, Wang P, He S, Zhu J, Shi Y, Wang J: Progress and Prospect of Immunotherapy for Triple-Negative Breast Cancer. Front Oncol 2022, 12:919072.
- Zhang Y, Zhang Z: The history and advances in cancer immunotherapy: understanding the characteristics of tumor-infiltrating immune cells and their therapeutic implications. Cell Mol Immunol 2020, 17:807-821.
- Mocellin S, Nitti D: CTLA-4 blockade and the renaissance of cancer immunotherapy. Biochim Biophys Acta 2013, 1836:187-196.
- Vanneman M, Dranoff G: Combining immunotherapy and targeted therapies in cancer treatment. Nat Rev Cancer 2012, 12:237-251.
- Emens LA: Breast cancer immunobiology driving immunotherapy: vaccines and immune checkpoint blockade. Expert Rev Anticancer Ther 2012, 12:1597-1611.
- Oliver B, Jackson E, Soliman H: Chapter 17 - Immunostimulators and Immunomodulators in Cancer Treatment. In Novel Approaches and Strategies for Biologics, Vaccines and Cancer Therapies. Edited by Singh M, Salnikova M. San Diego: Academic Press; 2015: 411-431
- Buchbinder EI, Desai A: CTLA-4 and PD-1 Pathways: Similarities, Differences, and Implications of Their Inhibition. Am J Clin Oncol 2016, 39:98-106.
- Bhalla S, Hauck K: HYPOPHYSITIS AND ADRENAL INSUFFICIENCY SECONDARY TO IPILIMUMAB AND NIVOLUMAB: A NEARLY LIFE THREATENING SIDE EFFECT OF NOVEL IMMUNOTHERAPY AGENTS. Journal of General Internal Medicine 2017, 32:S514-S514.
- De Felice KM, Markovic S, Kottschade LA, Finnes HD, Loftus EV, Raffals LH: Ipilimumab-Induced Colitis in Patients With Metastatic Melanoma. Gastroenterology 2014, 146:S604-S604.
- Garcia-Manero G, Daver NG, Montalban-Bravo G, Jabbour EJ, DiNardo CD, Kornblau SM, Bose P, Alvarado Y, Ohanian M, Borthakur G, et al: A Phase II Study Evaluating the Combination of Nivolumab (Nivo) or Ipilimumab (Ipi) with Azacitidine in Pts with Previously Treated or Untreated Myelodysplastic Syndromes (MDS). Blood 2016, 128.
- Hinds A, Ahmad D, Muenster J, Berg Z, Lopez K, Holly JS, Matteson M, Bechtold M: Ipilimumab-induced Colitis: A Rare but Serious Side Effect. American Journal of Gastroenterology 2013, 108:S374-S375.
- Jose A, Yiannoullou P, Bhutani S, Denley H, Morton M, Picton M, Summers A, van Dehen D, Augustine T: Renal Allograft Failure After Ipilimumab Therapy for Metastatic Melanoma: A Case Report and Review of the Literature. Transplantation Proceedings 2016, 48:3137-3141.
- Peggs KS, Quezada SA, Allison JP: Cell intrinsic mechanisms of T-cell inhibition and application to cancer therapy. Immunol Rev 2008, 224:141-165.
- Shi Y, Jiang Y, Cao J, Yang W, Zhang J, Meng F, Zhong Z: Boosting RNAi therapy for orthotopic glioblastoma with nontoxic brain-targeting chimaeric polymersomes. Journal of Controlled Release 2018, 292:163-171.
- Ulpiano C, Alves CAP, Silva-Santos AR, Serra J, da Silva CL, Monteiro GA, Ieee: RNAi as a tool to inhibit the angiogenic potential of human Mesenchymal Stem/Stromal Cells in malignancy. In 6th IEEE Portuguese Meeting on Bioengineering (ENBENG); 2019 Feb 22-23; ISEL, Lisbon, PORTUGAL. 2019
- Yu A-M: Bioengineered RNAi molecules for cancer research and experimental therapy. Cancer Research 2022, 82.
- Cuiffo BG, Boone A, Yan D, Maxwell M, Rivest B, Cardia J, Fricker SP: INTASYL self-delivering RNAi therapeutic dual targeting PD-1 and CTLA-4 provides synergistic antitumor efficacy in the treatment of murine colon cancer in vivo. Cancer Research 2023, 83.
- Yoo B, Sojoodi M, Jordan VC, Pantazopoulos P, Ghosh S, Caravan P, Medarova Z: Cancer immunotherapy based on the RNAi-based PD-L1 inhibitor, MN-siPDL1, demonstrates efficacy in preclinical pancreatic adenocarcinoma. Cancer Research 2023, 83.
- Fabian MR, Cieplak MK, Frank F, Morita M, Green J, Srikumar T, Nagar B, Yamamoto T, Raught B, Duchaine TF, Sonenberg N: miRNA-mediated deadenylation is orchestrated by GW182 through two conserved motifs that interact with CCR4-NOT. Nat Struct Mol Biol 2011, 18:1211-1217.
- Fabian MR, Sonenberg N: The mechanics of miRNA-mediated gene silencing: a look under the hood of miRISC. Nat Struct Mol Biol 2012, 19:586-593.
- Sanchita, Trivedi R, Asif MH, Trivedi PK: Dietary plant miRNAs as an augmented therapy: cross-kingdom gene regulation. RNA Biology 2018, 15:1433-1439.
- Du J, Liang Z, Xu J, Zhao Y, Li X, Zhang Y, Zhao D, Chen R, Liu Y, Joshi T, et al: Plant-derived phosphocholine facilitates cellular uptake of anti-pulmonary fibrotic HJT-sRNA-m7. Science China Life Sciences 2019, 62:309-320.
- Zhang L, Hou D, Chen X, Li D, Zhu L, Zhang Y, Li J, Bian Z, Liang X, Cai X, et al: Exogenous plant MIR168a specifically targets mammalian LDLRAP1: evidence of cross-kingdom regulation by microRNA. Cell Research 2011, 22:107-126.
- Zhao D, Qin Y, Liu J, Tang K, Lu S, Liu Z, Lin Y, Zhang C, Huang F, Chang J, et al: Orally administered BZL-sRNA-20 oligonucleotide targeting TLR4 effectively ameliorates acute lung injury in mice. Sci China Life Sci 2023, 66:1589-1599.
- Chin AR, Fong MY, Somlo G, Wu J, Swiderski P, Wu X, Wang SE: Cross-kingdom inhibition of breast cancer growth by plant miR159. Cell Res 2016, 26:217-228.
- Campani V, De Rosa G, Misso G, Zarone MR, Grimaldi A: Lipid Nanoparticles to Deliver miRNA in Cancer. Curr Pharm Biotechnol 2016, 17:741-749.
- Naidu GS, Yong S-B, Ramishetti S, Rampado R, Sharma P, Ezra A, Goldsmith M, Hazan-Halevy I, Chatterjee S, Aitha A, Peer D: A Combinatorial Library of Lipid Nanoparticles for Cell Type-Specific mRNA Delivery. Advanced Science 2023, 10:2301929.
- Hassett KJ, Higgins J, Woods A, Levy B, Xia Y, Hsiao CJ, Acosta E, Almarsson Ö, Moore MJ, Brito LA: Impact of lipid nanoparticle size on mRNA vaccine immunogenicity. Journal of Controlled Release 2021, 335:237-246.
- Fedorov Y, Anderson EM, Birmingham A, Reynolds A, Karpilow J, Robinson K, Leake D, Marshall WS, Khvorova A: Off-target effects by siRNA can induce toxic phenotype. Rna 2006, 12:1188-1196.
- Mcgeary SE, Lin KS, Shi CY, Bisaria N, Bartel DP: The biochemical basis of microRNA targeting efficacy. Cold Spring Harbor Laboratory 2018.
- Jan K, Marc R: RNAhybrid: microRNA target prediction easy, fast and flexible. Nucleic Acids Research 2006, 34:451-454.
- Enright A, John B, Gaul U, Tuschl T, Sander… C: MicroRNA targets in Drosophila. Genome Biology 2003, 5:R1.
- Kertesz M, Iovino N, Unnerstall U, Gaul U, Segal E: The role of site accessibility in microRNA target recognition. Nat Genet 2007, 39:1278-1284.
- Li X, Liang Z, Du J, Wang Z, Mei S, Li Z, Zhao Y, Zhao D, Ma Y, Ye J, et al: Herbal decoctosome is a novel form of medicine. Science China Life Sciences 2019, 62:333-348.
- Brader ML, Williams SJ, Banks JM, Hui WH, Zhou ZH, Jin L: Encapsulation state of messenger RNA inside lipid nanoparticles. Biophysical Journal 2021, 120:2766-2770.
- Sun L, Zuo C, Liu X, Guo Y, Wang X, Dong Z, Han M: Combined Photothermal Therapy and Lycium barbarum Polysaccharide for Topical Administration to Improve the Efficacy of Doxorubicin in the Treatment of Breast Cancer. Pharmaceutics 2022, 14.
- Xiong Y-x, Li N, Han M-m, Ye F, Liu T, Ye H-y, Zheng T-t, Wu J-j, Li Y, Lv S, et al: Rhodiola rosea polysaccharides-based nanoparticles loaded with DOX boosts chemo-immunotherapy for triple-negative breast cancer by re-educating Tumor-associated macrophages. International Journal of Biological Macromolecules 2023, 239.
- Cheng MHY, Leung J, Zhang Y, Strong C, Basha G, Momeni A, Chen Y, Jan E, Abdolahzadeh A, Wang X, et al: Induction of Bleb Structures in Lipid Nanoparticle Formulations of mRNA Leads to Improved Transfection Potency. Advanced Materials 2023, 35.
- Buschmann MD, Carrasco MJ, Alishetty S, Paige M, Alameh MG, Weissman D: Nanomaterial Delivery Systems for mRNA Vaccines. Vaccines (Basel) 2021, 9.
- Dudas J: Supportive and rejective functions of tumor stroma on tumor cell growth, survival, and invasivity: the cancer evolution. Front Oncol 2015, 5:44.
- Du W, Johnston A, Nair P, Zhu J, Win KS, Zhou B, Phillip J, Wu P-H, Wirtz D: Modulate TAM infiltration at cancer-immune interface by targeting at monocyte migration. Cancer Research 2023, 83.
- Lin Y, Xu J, Lan H: Tumor-associated macrophages in tumor metastasis: biological roles and clinical therapeutic applications. J Hematol Oncol 2019, 12:76.
- Farhood B, Najafi M, Mortezaee K: CD8(+) cytotoxic T lymphocytes in cancer immunotherapy: A review. J Cell Physiol 2019, 234:8509-8521.
- Elewa YHA, Abd Elwakil MM, Harashima H, Mohamed SKA, Zahran MH: Microenvironmental Changes in Mediastinal Fat-associated Lymphoid Clusters and Lungs in Early and Late Stages of Metastatic Lung Cancer Induction. Microscopy and Microanalysis 2023, 29:1228-1243.
- Knudson KM, Hicks KC, Ozawa Y, Schlom J, Gameiro SR: Functional and mechanistic advantage of the use of a bifunctional anti-PD-L1/IL-15 superagonist. J Immunother Cancer 2020, 8.
- Kadriya A, Falah M: Nanoscale Phytosomes as an Emerging Modality for Cancer Therapy. Cells 2023, 12.
- Link J, Thon C, Petkevicius V, Steponaitiene R, Malfertheiner P, Kupcinskas J, Link A: The Translational Impact of Plant-Derived Xeno-miRNA miR-168 in Gastrointestinal Cancers and Preneoplastic Conditions. Diagnostics (Basel) 2023, 13.
- Zhang WJ, Li YY, Xiang ZH, Deng J, Li W, Lin QL, Fang Y, Liu F, Bai J, Zhang L, Li J: Emerging evidence on the effects of plant-derived microRNAs in colorectal cancer: a review. Food Funct 2023, 14:691-702.
- Kantarcıoğlu M, Yıldırım G, Akpınar Oktar P, Yanbakan S, Özer ZB, Yurtsever Sarıca D, Taşdelen S, Bayrak E, Akın Balı DF, Öztürk S, et al: Coffee-Derived Exosome-Like Nanoparticles: Are They the Secret Heroes? Turk J Gastroenterol 2023, 34:161-169.
- Zou H, Li Y, Liu X, Wu Z, Li J, Ma Z: Roles of plant-derived bioactive compounds and related microRNAs in cancer therapy. Phytother Res 2021, 35:1176-1186.
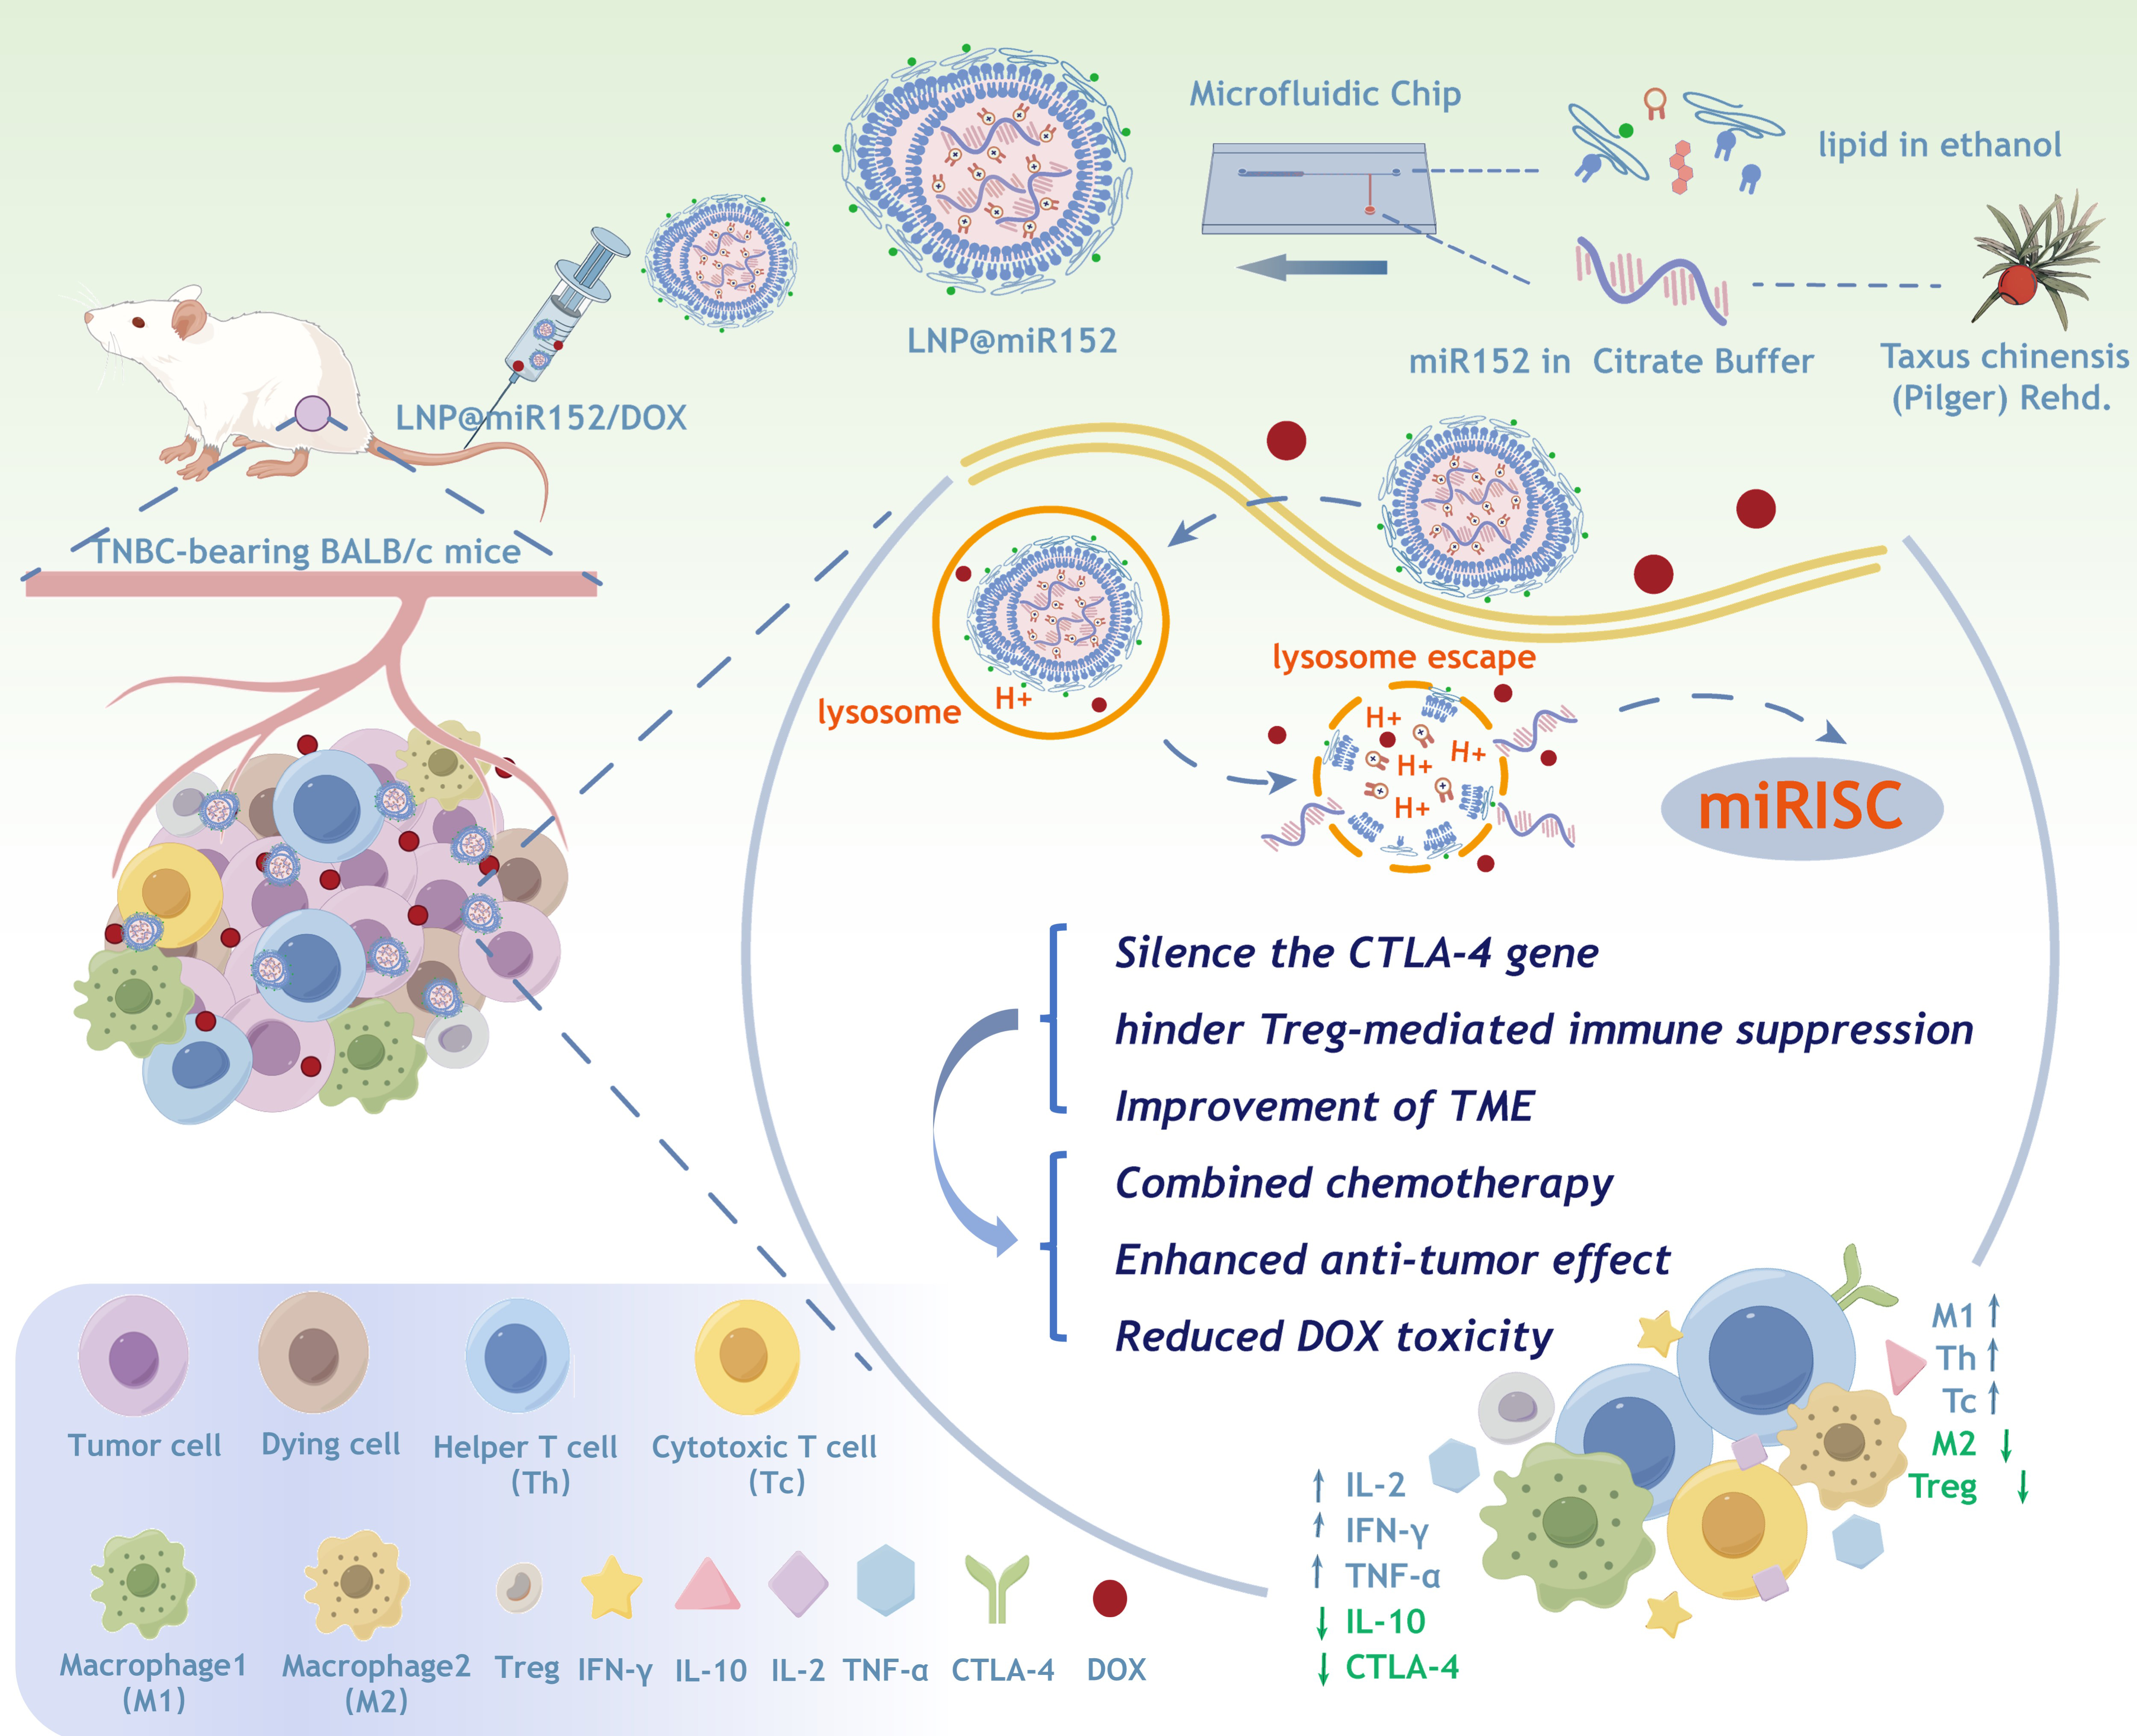
Scheme 1 is available in the Supplementary Files section.
No competing interests reported.
- Scheme1.jpg
Scheme 1. Schematic of lipid nanoparticles (LNPs) encapsulating twa-miR152-5p (miR152) and the potential of combination therapy of LNP containing miR152 (LNP@miR152) with chemotherapeutic-doxorubicin (DOX) for TNBC-bearing BALB/c mice therapy. LNP formulations were administered intravenously to TNBC-bearing BALB/c mice. LNP@miR152 was taken by tumor cells and entered into the lysosome, then escaped from the lysosome and released miRNA. Then, miRNAs recruit the miRNA-induced silencing complex (miRISC) that is a ribonucleoprotein complex. miRISC can target mRNAs and mediate mRNA repression of CTLA-4.
- AppendicesA.Supportinginformation.docx
Appendices A. Supporting information Supplementary data associated with this article can be found in the Appendices A.