3.1 Biochemical Methane Potential and Microbial diversity
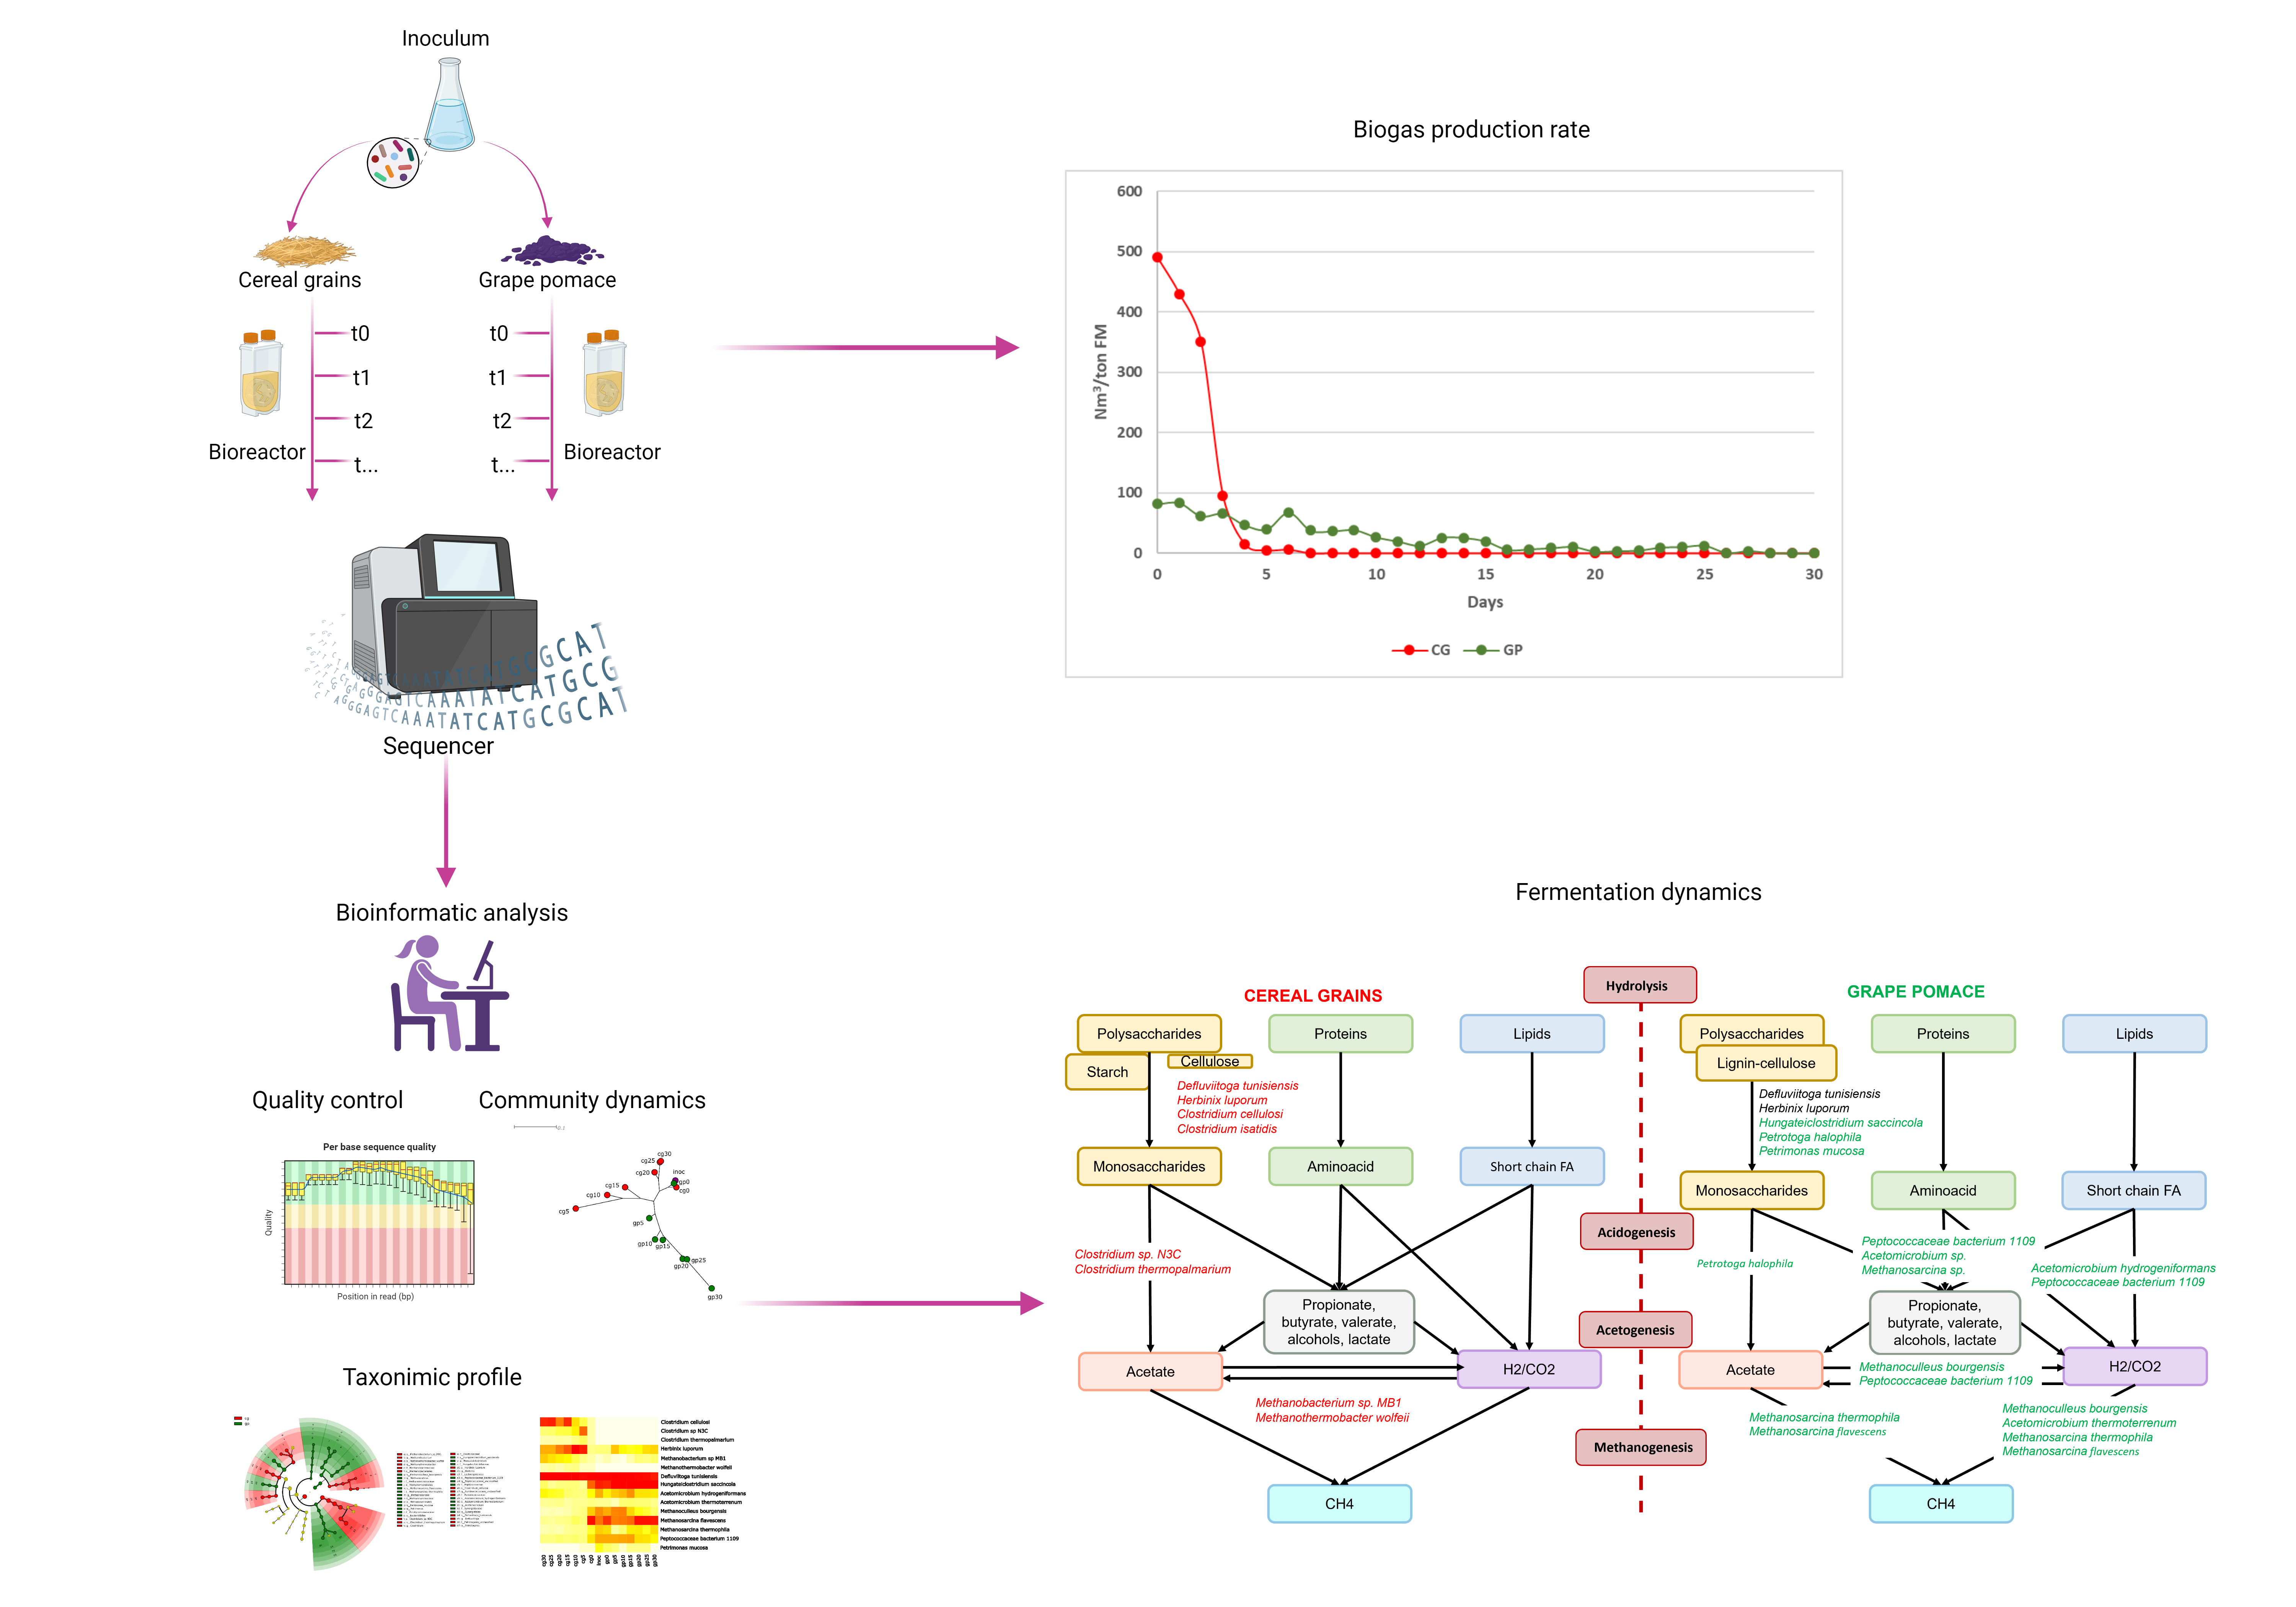
Average daily biogas production from cereal grains and grape pomace AD are shown in Fig. 1. The CG had the highest biogas yield, compared with GP. After 5 days of digestion, CG have completely exhausted the substrate, whereas GP showed a very slow trend and a minimal biogas production within the 30 days.
Characterization of CG- and GP-based substrates has been reported in Table 1. For CG-based substrates (Table 1A), all parameters evidenced the rapid digestion within the first 5 days. Residual acetic acid from day 5 to day 30 may indicate cessation of methanogenesis due to the complete depletion of fermentable substrate. Table 1B shows compositional parameters of GP-based substrate. As evidenced by the low and slow biogas production rate, high lignin content inhibited anaerobic digestion.
Table 1
– Chemical characterization of the AD of cereal grains (A) and grape pomace (B) over 30 days. Data are expressed as fresh matter (FM).
| (A) Cereal grains | | | | |
| Day | TS (g/kg FM) | VS (g/kg FM) | pH | Lignin (g/kg FM) | Cellobiose (% FM) | Glucose (% FM) | Acetic acid (% FM) |
| 0 | 145.0 | 121.5 | 8.0 | 0.20 | 0.08 | 0.04 | 0 |
| 5 | 57.9 | 31.5 | 6.0 | 0.32 | 0 | 0 | 0.16 |
| 10 | 74.0 | 33.7 | 5.8 | 0.24 | 0 | 0 | 0.17 |
| 15 | 64.1 | 29.4 | 6.0 | 0.27 | 0 | 0 | 0.19 |
| 20 | 59.0 | 35.1 | 5.9 | 0.28 | 0 | 0 | 0.16 |
| 25 | 55.9 | 31.8 | 5.9 | 0.29 | 0 | 0 | 0.20 |
| 30 | 54.5 | 27.5 | 6.0 | 0.29 | 0 | 0 | 0.17 |
| (B) Grape pomace | | | |
| Day | TS (g/kg FM) | VS (g/kg FM) | pH | Lignin (g/kg FM) | Cellobiose (% FM) | Glucose (% FM) | Acetic acid (% FM) |
| 0 | 150 | 122.2 | 8.0 | 0.59 | 0 | 0.04 | 0.009 |
| 5 | 142 | 115.1 | 8.4 | 0.56 | 0 | 0.05 | 0 |
| 10 | 140 | 113.3 | 8.2 | 0.57 | 0 | 0 | 0 |
| 15 | 131 | 101.2 | 8.3 | 0.56 | 0 | 0 | 0 |
| 20 | 138 | 107.9 | 8.2 | 0.58 | 0 | 0 | 0 |
| 25 | 144 | 113.4 | 8.3 | 0.60 | 0 | 0 | 0 |
| 30 | 145 | 117.3 | 8.2 | 0.61 | 0 | 0 | 0 |
The Alpha diversity along with Evenness (Fig. 2A and 2B) calculated on the different samples showed a different trend in the two substrates: the CG samples (cg0-30) present a peak corresponding to the fifth day of fermentation and then decreased until the 30th day, while the GP samples show a linear growth over time. Richness index (Fig. 2C) shows a similar trend in both matrices, growing in the first 10 days, then remaining more or less stable until day 30.
A higher J Pielou's evenness at increased biogas production in both group of samples was observed. Compared with biogas production (see Fig. 1), it indicates that the better performing process (in terms of biogas production and methane content) is always related with higher community evenness (30). Community evenness is particularly important in a system such as AD, as it signposts equitable distribution between the various AD functional groups; this enables the community to fully exploit all metabolic pathways, as well as the co-metabolic pathways, which are known to play an important in AD performance (31). Further to this, communities with uneven distributions of diversity tend to be dominated by groups of microorganisms specialised to the current conditions, when exposed to external changes (e.g. pH) they are unable to adapt rapidly and require long recovery times. CG showed a rapid progressive loss of diversity over time, maintaining the number of species but with a prevalence of few taxa. Otherwise, in GP substrate samples a smooth and slow increase of diversity over time was evidenced, but with a good equipartition.
3.2 Taxonomical profiling
The processing details of WMS sequencing for the 15 samples, seven for both CG and GP plus inoculum, are shown in supplementary materials. The throughput of sequencer was quite similar among the 15 samples, even after filtering out low quality sequence (see supplementary material).
Three different software, differing in their ability to assign reads to specific taxonomic units, were used to build the taxonomical profiles: in terms of number of reads classified, BLASTN and MetaPhlAn3 showed similar values, while the classification rates increased by an order of magnitude with MetaPhlAn4 (see supplementary material), which is able to improve the metagenomic taxonomic profiling using the metagenome-assembled genomes (MAGs) to define an expanded set of species-level genome bins (25). All the three classification showed the same trend, with sample cg0 with the minor number of reads classified and sample cg25 with the highest classification rate.
One of the main problems in the taxonomic profile reconstruction, obtained from metagenomic analyses, lies in the high percentage of reads that fail to be uniquely assigned to a species and are therefore classified as "unclassified organism" or "uncultured bacterium/archeon”. For BLASTN + MEGAN6 and Methaphlan3 the percentage of unclassified reads reaches 80–90%, whereas Methaphlan4 allows a deeper assignment of reads, through the adoption of the species-level genome bins system that makes it possible to drastically reduce the number of unassigned reads (see supplementary material).
For this specific study design, despite the great potential of MetaPhlAn4 in metagenome analysis, it proved to be less useful because, by targeting generic OTUs instead of specific cultivable strains, it is less successful in identifying specific strains that could be subsequently used to improve and optimize the fermentation system. On the other hand, BLAST-based analysis also has some disadvantages, mainly related to the high computational time requested for analyses and to the redundancy of the database used by BLASTN.
Furthermore, as a first descriptive approach, community progression analysis during biogas production was performed by NJ tree construction on BLASTN results (Fig. 3A) and by PCoA (Fig. 3B) for MetaPhlAn3. The two analyses highlighted exactly the same trend, showing two different dynamics for the two substrates during the fermentation process: in GP the microbial community changes slowly over time, while CG shows a rapid initial change in microbiome structure, corresponding to a high rate of biogas production, and then the community tends to return to a composition similar to the initial inoculum composition.
In fact, the microbial community retrieved in the samples from CG fermentation after 5 days (cg5) was distant from the start point (inoculumu-cg0) in both representation; then through time the bacterial composition in CG returned similar to cg0. Conversely, the microbial composition of the samples obtained from GP fermentation gradually deviated from the starting point (inoculum-gp0) until day 30 during the biogas production process.
Therefore, based on the above considerations and on the initial descriptive analyses of microbial community dynamics, which were found to be widely overlapping between BLASTN and MetaPhlAn3, only the taxonomic profile generated with MetaPhlAn3 will be discussed in detail below, while the results of the taxonomic analysis performed with BLASTN + MEGAN6 and MetaPhlAn4 are presented in the supplementary materials.
The taxonomical composition of inoculum, in term of phylum and species, is detailed in the supplementary material; this sample was characterized by the presence of 5 phyla, the most abundant was Thermotogae (over than 65% of assigned reads), followed by Firmicutes (renamed as Bacillota), Euryarcheota (the only Archaea phylum identified), Synergistetes and Bacteroidetes. Eleven genera and 14 species were identified in the inoculum: Defluviitoga was the most abundant genera and Defluviitoga tunisiensis the dominant species (see supplementary material). The taxonomic profiles from time 0 to day 30 of the samples from both CG and GP are also showed in the supplementary material, where the distribution of phyla and species were, respectively, presented. As in the inoculum, in all samples the sequences were classified into 5 phyla (Thermogae, Firmicutes, Euryarchaeota, Synergistetes, and Bacteroidetes), with the Thermogae always being the most abundant followed by the Firmicutes, while the other three phyla are present with lower relative abundances.
A total of 16 genera and 22 species were detected, the most abundant genera were Defluviitoga, Hungateiclostridium (reclassified as Acetovibrio) and Herbinix; the most represented species in all the samples were D. tunisiensis (over 65% of all samples), Hungateiclostridium saccincola (reclassified as Acetovibrio saccincola in GP samples, and Herbinix luporom in CG samples; all the other species had a relative abundance lower than 1% (see supplementary material).
3.3 Differences in microbial composition among different substrate
Overall 12 genera and 15 species were identified: 6 genera and 7 species enriched in samples from CG; 6 genera and 8 species enriched in samples from GP. The relative abundance among all samples of these 15 species was used to generate the heatmap represented in Fig. 4B. As previously described, D. tunisiensis was largely (relative abundance > 65%) present in all the samples during all the phases of biogas production (Fig. 4B), but resulted statistical most abundant in the CG community samples (Fig. 4A). Samples from CG were also significantly enriched by the presence of Clostridium cellulosi, Clostridium sp. N3C, Clostridium thermopalmarium, Methanobacterium sp. MB1 and Methanothermobacter wolfeii (Fig. 4A). During the first days (cg5-15) of production of biogas in samples from cereal grains there was a higher abundance of H. luporum, C. sp. N3C, C. thermopalmarium and M. wolfeii (Fig. 4B). Conversely, the same substrate showed an increase of C. cellulosi an M. sp. MB1 during the late phases of biogas production in CG samples (cg20-30, Fig. 4B).
The second most abundant species detected in all samples was H. saccincola, which was one of the most common species at the beginning of the biogas production process (inoculum, cg0, gp0) and remained significantly highly abundant during all time in grape pomace samples (Fig. 4B). Samples from GP were also enriched by Acetomicrobium hydrogeniformans, Acetomicrobium thermoterrenum, Methanoculleus bourgensis, Methanosarcina flavescens, Methanosarcina thermophila, Peptococcaceae bacterium 1109 and Petrimonas mucosa (Fig. 4A and 4B). A. hydrogeniformans, M. bourgensis and P. bacterium 1109 presented all the same dynamics: they were abundant during the first stages (gp5-15) of fermentation and then their abundance decrease. Conversely A. thermoterrenum, M. thermophila and P.mucosa showed a progressive increase during last days of biogas production (gp20-25). M. flavescens exhibited a different growth dynamic: it was very abundant at the beginning (gp0), its abundance slightly decreased during the later stages of fermentation (gp5-15) and then increased again in the last ten days (gp20-30, Fig. 4B).
Since the biogas production rate had its peak during the first days of the fermentation process a comparison of early time samples (5-10-15 days), on both substrates, were performed with LEfSe (see supplementary material). The principal results of this analysis were similar to the general comparison between samples (CG vs GP Fig. 4A), but this analysis also revealed the presence of Clostridium isatidis as significantly enriched in the CG samples, and Petrotoga halophila enriched in GP samples.
3.4 Structure of microbial community in the key microbiological steps of AD process
In recent years, various molecular biological techniques (including genomics, metagenomics, meta-transcriptomics) have been applied to investigate the composition and the dynamics of the AD microbiome and to understand its implications for the biogas process (15).
Among the organic biomasses of interest for biogas production, GP is one of the most abundant waste products in the agri-food industry, but fermentation of this type of substrate has a low yield in biogas production; the purpose of this work was to compare, through the WMS approach, the different dynamics of the microbiome during GP and CG fermentation with the aim of identifying effective approaches to optimize biogas production and ensure process stability in GPs.
The two different substrates show different microbiome structure and dynamics over time, although the two processes were both characterized during all experimental phases by very high levels of D. tunisiensis (Fig. 4B). High abundances of D. tunisiensis were already detected in a thermophilic laboratory fermenter (32), highlighting the broad spectrum of substrates (polymers, oligosaccharide, acids and alcohols) that D. tunisiensis is capable of metabolizing therein including the ability to degrade cellulose since genes encoding non-cellulosomal cellulases were identified in its genome. Li et al. (33) confirmed the cellulose-degrading ability of D. tunisiensis, showing how this microorganism is predicted to participate in the AD of a variety of carbohydrates and produces acetate, H2 and CO2. Other researches support the idea that the high H2-producing ability of D. tunisiensis significantly influenced the proportion of hydrogenotrophic archaea species that, syntrophically associated with this bacterium, can utilise CO2 and H2 for methanogenesis (34).
Next to D. tunisiensis, two other bacteria, H. luporum and H. saccincola, also characterized at high levels CG and GP respectively (Fig. 4B). With regard to H. luporum, although its relative abundance is significantly higher in CG, its levels in GP are more than 3% making it a relatively abundant species in this matrix as well. The complete genome sequence of H. luporum was reported in 2016 (35) and its characterization has shown that the bacterium is able to digest cellulosic and hemicellulosic substrates. Also, Maus et al. (36) described H. luporum to be involved in thermophilic degradation of lignocellulosic biomass representing together with C.cellulosi an important cellulose degrader.
On H. saccincola there is not much information, in 2019 Rettenmaier et al. (37) showed that H. saccincola is closely related to Hungateiclostridium thermocellum a well-known cellulolytic key players such as C.cellulosi and Herbinix hemicellulosilytica. Recently, a study aimed to characterize the synergism of a hydrolytic/cellulolytic bacterial consortium isolated from biogas fermenters proposed that enzymatic activity of H. thermocellum liberates soluble mono- and oligosaccharides from cellulose and hemicellulose, thereby promoting growth of saccharolytic bacteria. Bacterial synergism is supposed to accelerate biomethane production in AD of plant fibers by increasing the overall cellulose hydrolysis rates and increasing the amounts of produced volatile metabolites (38).
Present results seem to confirm the importance of this metabolic synergy, in fact in both matrices the co-presence of cellulolytic, saccharolytic and hydrolytic bacteria was confirmed: in the CG, H. luporum was flanked by a consortium of clostridia among which the non-cellulolytic C. sp. N3C and C. thermopalmarium strains, while the cellulolytic H. saccincola and H. luporum in GP are accompanied with non-cellulolytic Acetomicrobium sp and P. mucosa (Fig. 5) as we will discuss below.
A further general consideration of the overall microbiome dynamics of the two different biomasses concerns methanogenesis by two different types of Archea: M. wolfeii and M. sp. MB1 characterise the CG while, the M.thermophila and M.flavescens are more represented in GP and, reasonably, all grow in abundance toward the terminal phase of the AD cycle, indicating their role in the aceticlastic and hydrogeno-trophic pathways (Fig. 5). To date, while the role of Methanosarcina in AD is fairly well described in the literature, not much is known about the two strains observed in CG, and the present analysis is one of the first studies that identify M. wolfeii and M. sp. MB1 as two prokaryotes with a main role in methanogenesis from CG.
3.4.1 Dynamics of microbial community in AD process for cereal grains
Exploring the structure and dynamics of CG microbial community in more detail, from the comparison of early time samples (5-10-15 days) between CG and GP, C. isatidis results significantly enriched in CG. Little is known about this clostridium strain, but its role in AD results from a 2010 study indicating the C.isatidis strain as capable of directly converting cellulose to ethanol (39). Moreover, we observed that during the early days (cg5-15) there was a higher abundance of C. sp. N3C and C. thermopalmarium (see supplementary material), both are non-cellulolytic, hydrogen-producing bacteria and both seemed to contribute to butyrate production (36, 40). The co-existence of cellulolytic strains, such C.isatidis and H.luporum, and hydrogen producers, such as the C. sp. N3C and C. thermopalmarium as seen in the present study highlights the idea that these strains, by taking advantage of their specific metabolic capacities, offers a promising new way to improve the conversion efficiency of cellulose to hydrogen. In fact, the use of cellulolytic bacteria for hydrogen production is often limited by low hydrogen yields, due to the bacteria's poor growth rates and pH sensitivity.
The present analysis is one of the first studies that identify M. wolfeii and M. sp. MB1 as two prokaryotes with a major role in methanogenesis from CG (cg20-30, Fig. 4B). These two archaea are both hydrogenotrophic methanogens that use formate, hydrogen, and carbon dioxide as substrates for methanogenesis and require acetate for growth (36). Furthermore, it cannot be ruled out that C. cellulosi might form a syntrophic association with these hydrogenotrophic methanogens, in particular with M. sp. MB1 since both these prokaryotes show a similar growth in their abundance in the final stage of the fermentation process.
3.4.2 Dynamics of microbial community in AD process for grape pomace
As described (Fig. 3A and 3B) the structure of the microbial community changes slowly over time in GP, maintaining biogas production capacity longer, albeit at lower levels, than CGs (Fig. 1). Next to the two cellulolytic bacteria already discussed, D. tunisiensis and H. saccincola, present at high abundance throughout GP digestion as well, this matrix is characterized by the presence of A.hydrogeniformans, M.bourgensis and P. bacterium 1109, that typify the first days of AD and A. thermoterrenum, M. thermophila, M. flavescent and P.mucosa showing a progressive increase during last days of AD (Fig. 4B).
The Acetomicrobium genus, identified in 2016 and initially classified as Anaerobaculum (41), is reported in biogas production reactors, and their role could be attributed to the digestion of fats and proteins (42), as well as glucose fermentation to acetate, CO2 and H2 (41). However, to date, little or no information is available in the literature about the two species observed in the present study, i.e. A.hydrogeniformans and A. thermoterrenum. Their presence in GP digestion could be explained considering the high concentration of promptly digestible lipids (7–15%) and proteins (8–16%) that characterized this substrate (43). In fact, in A. hydrogeniformans genome a thermostable esterase was identified presenting high catalytic activity with a preference towards short-acyl-chain esters (44), while A.thermoterrenum is involved in glycerol conversion (45), both processes being related to lipids metabolism during AD.
Moreover, is interesting to notice that both strains of Acetomicrobium observed in this study potentially act as syntrophic partner with homoacetogenic or syntrophic acetate-oxidizing bacteria (SAOB)(46), and with acetoclastic or hydrogenotrophic methanogens (HM) even if their role in these syntrophic communities still remains enigmatic (47). The strong association between SAOB and HM is well documented and, compared to acetoclastic methanogenesis, methane production from the association between SAOB and HM is thermodynamically favoured at high temperatures (48). In this regard, the co-presence of A. hydrogeniformans and M.bourgensis, a known syntrophic partner of SAOB bacteria (49), detected in this study at the early stages of GP AD (Fig. 4B and 5) elucidates how the system is capable of synthesizing methane via the hydrogenotrophic pathway even in the initial stages of fermentation of this biomass.
P. halophila and P. bacterium 1109 species have been identified in our GP substrate. So far, Petrotoga species has been isolated only from oil reservoirs, whereas P. bacterium 1109 is typically classified as belonging to acetogenic community, highly abundant in most biogas plants Singh et al. (50). Buettner et al. (51) with a network analyses approach demonstrated that P.bacterium 1109 was a key module in both HM and acetoclastic methanogenesis, highlighting a possible SAOB behaviour. An additional ability of the P.bacterium 1109 appears to be the conversion of propionate in methane, through cooperation between the P. bacterium and the methanogen M.bourgensis, even in inhibiting ammonia concentration Singh et al. (50), deriving from proteins catabolism.
The later GP fermentation stages, are characterized by the presence of two relevant Methanosarcina species, M. flavescens and M.thermophila. M. flavescens is a hydrogenotrophic and acetoclastic methanogen species that was recently identified and proliferates at increased shear velocity when acetic acid is the major VFA component (52); conversely, M.thermophila is a more established thermophilic archea that is referred to as acetoclastic methanogen but that can grow well also by utilizing methanol or methylated amines and slowly utilizing H2/CO2 (53). All Methanosarcina selected from GP substrate contain cytochrome c, a high intermembrane electron transfer medium, which enables them to withstand high hydrogen partial pressures, compared with methanogens present in CG substrate, lacking cytochrome c (54). This could be presumably due to the prevalence of catabolism pathways of protein and lipids in GP that increase the hydrogen partial pressure (Fig. 5).
Another bacterium that could play an important role in this microbial community is P.mucosa, also observed at higher abundance in the later stage of AD of GP in the present investigation (Fig. 4B). Its function in the AD process most probably is associated with acidogenesis. Based on integrated omics analyses it has also been observed that P. mucosa encodes a diverse set of glycosyl-hydrolyses involved in carbohydrate metabolism. Under these conditions, it may play an important role in conversion of lignocellulosic biomass (55).
It’s worth noting as digestion GP substrate leads to the development of a more complex bacterial consortium than CG and a combination of synergistic behaviours. The presence of bacteria as Acetomicrobium sp. and P.mucosa, involved in the degradation of lipids and protein-rich substrates, together with Methanosarcina sp. and P.bacterium 1109, able to tolerate high hydrogen pressures and high ammonia concentration derived by aminoacids degradation, seems to confirm the preference towards more rapidly-fermentable biomass components, as proteins and lipids, rather than lignocellulose. Moreover, in the late AD stages, the co-presence here observed of M.bourgensis with P.bacterium 1109, which relative abundance was seen as positively correlated to pH and is able to hydrolyze substrates efficiently even at pH ≥ 7.7, could be indicative of an adapted microbial communities (51).
The present results pave the ground on the perspective to build a tailored microbial consortium to be inoculated from the beginning of the process in view of improve biogas yield during lignocellulosic biomass AD.