3.1 The differential expression and diagnostic value of IL1RN
The expression levels of IL1RN were initially analyzed in the TCGA cohort consisting of 512 PTC samples and 58 normal samples (Figure 1A). Furthermore, expression data from four independent PTC cohorts obtained from the Gene Expression Omnibus (GEO) (GSE3467, GSE33630, GSE58545, and GSE60542) were employed for validation (Figure 5A-D). Both the GEO and TCGA patient cohorts had significantly higher IL1RN mRNA expression in PTC tissues than in normal tissues (P<0.05). Elevated levels of IL1RN protein expression were observed in PTC tissues compared with those in normal tissues by immunohistochemistry performed using the IL1RN antibody CAB9633. (Figure 1C)
ROC curves were constructed to evaluate the diagnostic value of IL1RN for PTC. The area under the ROC curve of the TCGA cohort was 0.7084 (Figure 1B) and that of each GEO cohort was 0.9753, 0.7279, 0.8868, and 0.8384, respectively. (Figure 5E-H) These results suggest the good positive diagnostic value of IL1RN for PTC.
3.2 Prognostic value and clinical significance of IL1RN
The PTC samples from the TCGA cohort were divided into two groups according to the IL1RN expression level: the high-expression group (H-IL1RN) (n = 116) and the low-expression group (L-IL1RN) (n = 385). Differences in progression-free survival (PFS) between the two groups were analyzed by Kaplan-Meier analysis. (Figure 1D) The results showed that patients with high IL1RN expression had significantly shorter PFS than those with low expression (P=0.0034). However, the data for the multivariate analysis by the Cox regression model suggested that IL1RN expression was not a significant independent prognostic risk indicator for PTC (hazard ratio, 1.033; 95% confidence interval, 0.999−1.068, p > 0.05) (Table 1). Age was an independent predictor of poor prognosis (P<0.05).
To examine the clinical significance of IL1RN in PTC, the relationship between the expression level of IL1RN and clinical characteristics was investigated by the chi-square test (Table 2). The results suggested that IL1RN expression was significantly associated with age, clinical stage, N stage, T stage, pathologic type, BRAF mutations and RAS mutations.
3.3 Gene coexpression and pathway enrichment analysis
We identified the genes that are significantly positively or negatively related to IL1RN. The result is presented as a volcano plot (Figure 2A). Red and green colors indicate a positive and negative correlation, respectively. The top 50 positively (Figure 2B) or negatively (Figure 2C) correlated genes are depicted by heatmaps. In addition, 2 hub genes (CCL20 and FN1) were identified from the protein–protein interaction (PPI) network (Figure 2D).
GO enrichment analysis revealed that the identified genes were mainly enriched for the GO biological process terms “neutrophil mediated immunity”, “positive regulation of cytokine production”, “adaptive immune response” and “immune response-regulating signalling pathway” (Figure 2E). Further KEGG enrichment analysis suggested that the identified genes were mainly involved in pathways associated with “cell adhesion molecules (CAMs)”, “cytokine-cytokine receptor interaction”, and “phagosome” (Figure 2F).
3.4 Immune-related analysis of IL1RN
Using ESTIMATE, the association between IL1RN expression and immune infiltrates was analyzed. We found that the H-IL1RN group showed a higher immune score (Figure 3B) and ESTIMATE score (Figure 3C) and lower tumor purity (Figure 3D) than the L-IL1RN group. No significant difference in the stromal score was found between the two groups (Figure 3A). The correlations between the IL1RN expression level and the infiltration of six immune cell types in PTC were estimated. The results demonstrated that the expression of IL1RN was found to be significantly correlated with the infiltration of immune cells, especially neutrophils and dendritic cells (Figure 3E). Correlations between IL1RN expression and 28 TIL types (Figure 3F), chemokines (Figure 3G), immune-activating cytokines (Figure S2A), immunosuppressive cytokines (Figure S2B), MHC molecules (Figure S2C), and chemokine receptors (S2D) in pancancer are shown in heatmaps. The correlation analysis results showed a good correlation between IL1RN expression and immune-related molecules.
3.5 Methylation-related analysis
The data showed that the degree of IL1RN DNA methylation was higher in carcinoma tissues than in normal tissues (P<0.0001) (Figure 4A). To further determine the role of methylation, we performed a correlation analysis between the DNA methylation levels of IL1RN and the expression levels of IL1RN. As expected, DNA methylation was negatively correlated with IL1RN expression (R=-0.600, P=2.29e-50) (Figure 4B). Tumor purity was significantly positively associated with IL1RN methylation (R=0.447, P=7.49e-32) (Figure 4C). Patients with an advanced clinical stage (Figure 4D), advanced T stage (Figure 4E) and lymph node metastasis (Figure 4F) tended to have decreased IL1RN methylation levels. In the pathological subtype of PTC, the tall cell type variant of PTC had the lowest degree of methylation, followed by the classical type, and the follicular variant of PTC had the highest degree of methylation (Figure 4G). To further explore the associated functional changes in IL1RN methylation, GO (Figure 4I) and KEGG (Figure 4F) enrichment analyses were performed. The results showed that methylated IL1RN had the opposite effect of IL1RN. Furthermore, the most significant methylation sites are shown in Table 3.
3.6 Pancancer analysis of IL1RN
We analyzed the IL1RN expression levels in different kinds of tumors via the GEPIA platform (Figure 6A). The results showed that the expression levels of IL1RN varied greatly in different cancer types. Of the 33 cancer types tested, 12 cancer types were associated with significantly increased IL1RN expression. Subsequently, the relationship between IL1RN and OS in pancancer was investigated (Figure 6B). Kaplan-Meier survival curves for the high IL1RN expression group (4745 patients) and low IL1RN expression group (4750 patients) indicated that increased IL1RN expression was associated with a shorter survival time in pancancer (HR=1.6, P<0.0001) (Figure 6C). The results showed that increased IL1RN expression levels were significantly associated with shorter OS in kidney renal clear cell carcinoma (KIRC) (Figure 6D), brain lower grade glioma (LGG) (Figure 6E), pancreatic adenocarcinoma (PADD) (Figure 6F) and uterine corpus endometrial carcinoma (UCEC) (Figure 6G).
3.7 Related mutant gene analysis
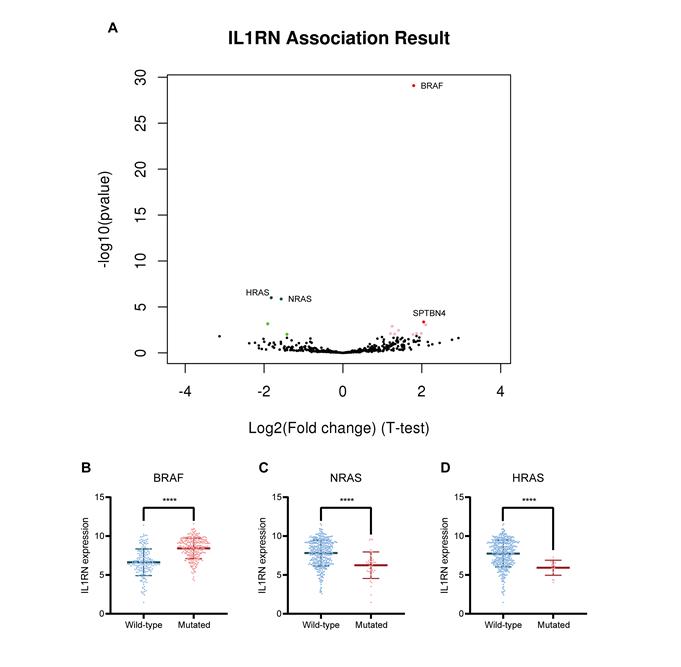
The analysis of the relationship between IL1RN expression and PTC mutations was performed by linkedOmics (Figure S1A). The IL1RN expression level was further compared between the groups with wild-type and mutant variants of BRAF, NRAS and HRAS (Figure S1B-D). The expression of IL1RN was significantly higher in PTC with the BRAF mutant than in PTC with the wild type (Figure S1B). However, mutated NRAS (Figure S1C) and mutated HRAS (Figure S1D) were correlated with decreased IL1RN expression.