The ionic form of Arsenic As3+ is the most toxic, causing severe health problems like cancer, cardiovascular diseases, and developmental disorders. Therefore, researchers have contributed significantly to its removal and detection work. However, there is still a need for accurate, trustworthy, and sensitive methods that may be employed at field sites for detecting Arsenic ions at nano levels. In the present study, we report a novel and robust electrochemical sensing platform for the selective and sensitive detection of As3+ ions in aqueous samples. The method combines the high sensitivity of stripping voltammetry with the data analytics and power of Chemometric modelling to achieve superior performance. Optimising key instrumental parameters such as deposition potential, deposition time, and scan rate improves the analytical response. To address potential interferences from co-existing ions, a Chemometric modelling approach based on principal component analysis (PCA) is employed to ensure the selection of predictor variables. This multivariate technique effectively discriminates As(III) signals from background noise and interfering species, enhancing selectivity and accurate quantification. The proposed method demonstrates a threshold limit and sensitivity of 0.4nM and 176.34µA/µM, for Arsenic, which is less than the World Health Organization (WHO) permissible limit in drinking water. Furthermore, the method shows good repeatability and stability, making it suitable for real-world water analysis applications. This novel sensing platform offers a promising alternative for sensitive, selective, and robust As(III) detection in water samples, contributing to improved water quality monitoring and public health protection.
Research Article
Stripping Voltammetry and Chemometric Modelling Scheme for Robust, Sensitive, and Selective Electrochemical Sensing of As3+ ions in Water
https://doi.org/10.21203/rs.3.rs-4059252/v1
This work is licensed under a CC BY 4.0 License
Version 1
posted
You are reading this latest preprint version
Square Wave Voltammetry (SWV)
Arsenic
Sensor
Optimisation
Partial Least Squares Regression (PLSR)
Prin-cipal Component Analysis (PCA)
✓ The SWV parameters were experimentally optimised to enhance the sensitivity, selectivity, range, and lower detection limit using the gold electrode as a sensor with a detection limit of 0.0044µM and sensitivity of 176.34µA/µM, respectively.
✓ For further analysis, the Unscrambler software processed the data to validate the parameters' effects on the signal response. For this, Chemometric modelling was applied and established a prediction model with the optimised parameters using the PLSR model and measured fitness values, R2-:0.998, RMSE (cal: 0.596), RMSE (val: 1.103), RMSEP (0.596), that indicating reliability and robustness of the developed prediction model.
Over the past 50 years, the occurrence of inorganic metal ions in potable water has seen a severe effect due to their non-biodegradable nature and high toxicity (1) . Heavy metal ions accumulation in an organism (even at trace levels) contributes to a significant environmental health problem. Even though heavy metal ions contaminate water resources and the environment, they are still continuously produced by industrial, agricultural, domestic, and fossil fuel combustion. These metal ions are mainly generated from industrial processes such as mining, smelting operations, textiles, metal processing in refineries, etc. Other sources include weathering, volcanic, pharmaceutical chemicals, and domestic and agricultural activities.
Arsenic has been considered a toxic metal ion among different types of heavy metals, severely affecting the environment even at trace exposure levels (2; 1) . Arsenic contamination can impact entire ecosystems, harming aquatic life and eventually entering the food chain. Arsenic ions have the top toxicity rank among all the heavy metal ions; therefore, the World Health Organization (WHO) established strict regulations for arsenic levels in drinking water, i.e. 10ppb for inorganic Arsenic (3; 4; 5) . Epidemiological studies demonstrated that exposure to arsenic ions significantly impacts the body, increasing health concerns, including jaundice, vascular diseases, and cancer risk in the skin, liver, lung, and bladder (6; 7) . Presently, the Ganga is one of the world’s most polluted rivers, containing several toxic heavy metals, including Arsenic, nearly 3000 times higher than the safe limit prescribed by the World Health Organization (4) (8) . Understanding the level and distribution of As3+ ions helps to develop targeted filters and treatment systems for efficient arsenic removal. Hence, developing sensitive, rapid, and simple methods to monitor trace inorganic arsenic is urgent.
The detection of Arsenic has been carried out using different methods, such as atomic adsorption spectroscopy (AAS), atomic fluorescence spectrometry, and inductively coupled plasma (ICP). The challenges of cost, sample preparation, field application, and user-friendliness of these methods are mitigated by electrochemical methods scharacterised by lower prices, the possibilities of on-site or real-time measurements, low detection limit, etc. (9; 10; 11; 12) . In the present work, we have used the electrochemical sensor, which provides high sensitivity and selectivity, is fast, measures enhanced detection limits, and has low cost (13; 14; 15; 16). These sensors detect changes in electrical properties caused by As3+ ions in the samples. Agnese et al., 2011 used the novel citrate sstabilised gold nanoparticle-modified glassy carbon electrode for arsenic detection with the detection limit of 0.025ppb. Still, in this study, other ions, including Cu(II), Pb(II), and Hg(II), all create interference toward As(III) determination (17). Pereira et al., (2016) evaluated an anodic stripping voltammetric method to determine the arsenic ions using the two novel thoria nanoparticles-carbon paste electrodes with detection limit and sensitivity 0.1ppb and 0.54µA/ppb, but there was no linearly for range 0 to 180ppb and also the presence of Cu(II) ions effect by decreasing the As(III) signal (18). Guo et. al., (2019) worked on the determination of trace As(III) by square wave anodic stripping voltammetry in the linear range of 10-50ppb with detection limit and sensitivity 0.08ppb and 1.521µA/ppb (19). Ismail et al., (2020) detected the As(III) ions by using silica nanoparticles modified screen-printed carbon electrode in the concentration range of 5-30ppb with the detection limit and sensitivity 6.2ppb and 0.327µA/ppb but also faced significant interference of Cu(II) in arsenic detection (20). Sullivan et. al., detected Arsenic (III) using square wave stripping voltammetry with gold nanoparticle-modified screen-printed electrodes that had a sensitivity of 0.1007 µA/ppb and a limit of detection of 16.73 ppb (21) . Rashmi et al., 2022 worked for the low-level detection of As(III) in water by synthesis of reduced graphene oxide-ceria (rGO-CeO2) nanocomposite up to 0.93 μg/L detection limit (22). In the published research work, there is still a need for an enhancement of the sensitivity, detection limit, selectivity, or interference of other ions, and the practical applicability of these materials in the field is yet to be addressed. Besides the excellent advantages of electrochemical techniques, including speed, sensitivity, cost-effectiveness, etc., the performance of SWV is influenced by several variables such as deposition potential, time, scan increment, and supporting electrolyte, which we have thoroughly discussed in our study.
The study aims to soptimise the most relevant factors/parameters that can enhance the sensitivity and low detection limit and establish a mathematical relationship between the factors/parameters and their respective responses analysis by chemometrics. The reported work for arsenic detection using electrochemical methods is compared/benchmarked and mentioned in Table 1.
Table 1. Comparison of the different research for Arsenic Sensing
|
Species |
Methods |
Potential (Dp) |
Working Electrode |
Detection Range |
LOD |
Sensitivity |
References |
|
As3+ |
CP |
-300mV |
Gold Film |
- |
0.08ppb |
- |
(23) |
|
As3+ |
DPASV |
-1.1V |
TNThNPCP |
0-180ppb |
0.1 ppb |
0.54µA/ppb |
(18) |
|
As3+ |
ASV |
-0.4V |
GNPCNTs |
10-70ppb |
0.1 ppb |
1.985µA/ppb |
(24) |
|
As3+ |
LSASV |
-0.5V |
SiNPs- SPCE |
5-30ppb |
6.2 ppb |
0.327µA/ppb |
(20) |
|
As3+ |
ASV |
0V |
Au/GNE |
0.1-9ppb |
1.06 ppb |
39.54μA/ppb/cm2 |
(25) |
|
As3+ |
DPASV |
-0.3V |
AuNPs |
4-1498ppb |
0.9 ppb |
8.13µA/ppb |
(26) |
|
As3+ |
SWASV |
-0.3V |
rGO-AuN/GCE |
1-50ppb |
0.08 ppb |
1.521µA/ppb |
(19) |
|
As3+ |
SWASV |
-0.3V |
GE |
5-50ppb |
0.329ppb |
2.3512 µA/ppb |
Present Work |
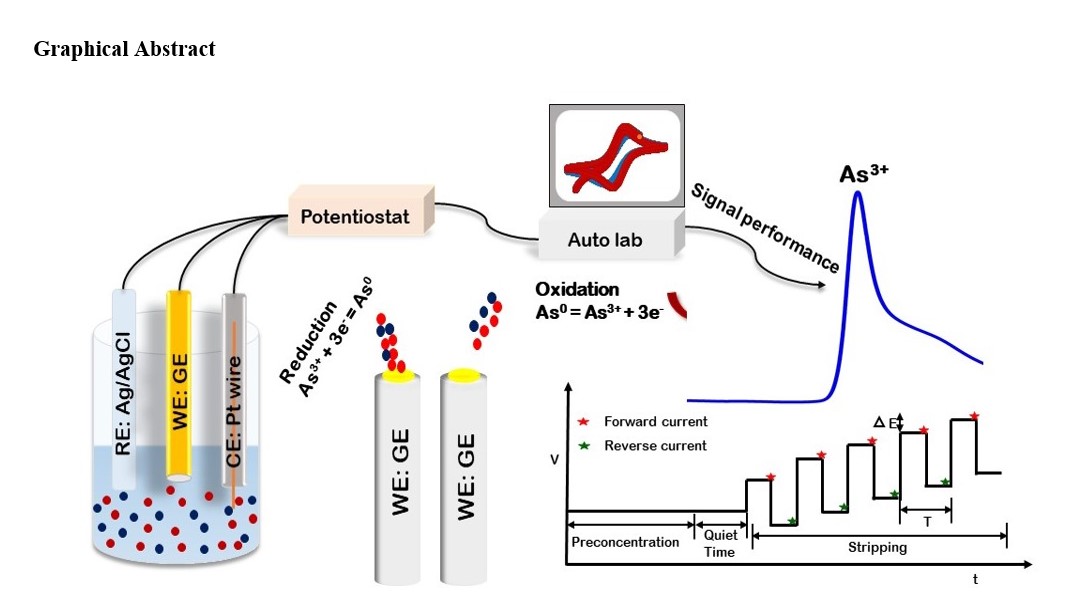
The electrochemical measurements, such as CV and SWASV were carried out in a standard three-electrode glass cell covered with an airtight Teflon cap using an AUTOLAB potentiostat (PGSTAT302N, CH Instruments, Netherlands). CV and SWASV were conducted using 0.1 M nitric acid as an electrolyte solution with pH ≈ 1. After a few experiments, a polishing kit (purchased from M/s Sinsil International) is used to polish electrode surfaces to ensure clean and uniform surfaces. The chemicals and standard reagents used in the present study were purchased from Sigma Aldrich make and used without further purification.
2.1. Sensing Technique
The electrochemical method, the square wave anodic stripping voltammetry technique (SWASV), was employed to sense arsenic ions at the trace level. It was performed on a computer-controlled electrochemical workstation using instrument control software NOVA (electrochemistry software by Metrohm Auto lab) to sanalyse a wide range of data. The technique and associated configuration are used for several merits, such as sensitivity, selectivity and simultaneous detection of multi ions attained through a pre-concentration step (27) (28). The selected ASV technique is more sensitive than other voltammetric techniques because of a pre-concentration action that concentrates the desired analyte on the working electrode surface. It is considered a sensitive and reproducible (RSD<5%) method for trace metal ion analysis in aqueous media. The detection limit of ASV for different metals can be in the ppb to ppt range (S/N=3).
Several soptimisation parameters were studied to develop the sensor for instant As3+ detection. Initially, several electrolytes were tested using an electrochemical process to obtain the desired analytical signal for As3+ ions sensing. Further, electrochemical processes such as CV were performed for potential -0.2 to 1.2 V with a scan rate of 100 mV/Sec, and SWASV soptimisation studies were performed under the varying square wave parameters: deposition potential (−0.1 to 1V), deposition time (30–300s) and frequency (50–350 Hz).
3.1. Cyclic Voltammetry Analysis
Cyclic Voltammetry was used to study redox processes to understand reaction intermediates. Redox peaks in the CV indicate the involvement of electron transfer reactions. The peak potentials reveal the thermodynamic favorability of the redox reaction, while the peak currents reflect the reaction kinetics and concentration of the redox species. From the cyclic voltammetry response, refer to Figure 1 it was observed that there is no peak recorded for the blank solution of electrolyte while after adding the arsenic ions, the signal peak was observed at soxidised potential, i.e. 1.078V.
3.2. Square Wave Anodic Stripping Voltammetry Analysis
SWV excels at detecting analytes at low concentrations, making it ideal for trace analysis in environmental applications. Therefore, to achieve the sensitivity and lower detection limit, square wave voltammetry was studied, and we tuned the pre-concentration and stripping parameters to record the maximum current signal peak for targeted ions.
3.2.1 Redox reactions and current measurement
a). Preconcentration Step: A negative potential is applied to the working electrode (-0.3V) for a specific preconcentration time. This negative potential favours the reduction of the As3+ ions in the solution onto the electrode surface. The reduced arsenic atoms accumulate on the electrode, building up its concentration and effectively amplifying the subsequent stripping signal. This step effectively enhances the detection limit of the technique. In the preconcentration step, at a particular deposition potential i.e. -0.3V, arsenic ions (As^3) present in the solution get reduced at the Working Electrode, which means the transfer of arsenic ions from the solution to the WE electrode surface.
b). Stripping Step: After preconcentration in the reverse pulse, the previously reduced arsenic species can re-soxidise back to their original state, releasing electrons and generating an oxidation current peak. In this step, a positive potential scan is applied to the electrode, and the scan gradually reverses the reduction process applied earlier. The reduced As0 ions re-soxidise and re-dissolve back into the solution. This process generates a sharp current peak in the voltammogram.
c). Peak analysis: The current peak's height and potential are directly proportional to the concentration of arsenic ions present in the solution.
A simple acid-base reaction occurred in SWV where the protons from nitric acid combine with the lone pair electrons on the oxygen atoms of the arsenite ion, and the arsenite ion loses electrons (gets oxidized_As3+) to the nitrate ions in nitric acid, which gain electrons (get reduced) to form nitrite ions (NO2⁻).

The peak's height is proportional to the concentration of the arsenic ions in the solution, making the square wave highly sensitive. To obtain the desired sensor performance, the Square-wave Voltammogram was recorded after optimising the SWV parameters (Table 2).
3.2.2 Optimisation of SWV Parameter- Reduction potential
Deposition potential is the vital parameter affecting the targeted analytes’ sensitivity and selectivity (29) . Increased deposition potential can lead to higher sensitivity because a higher potential drives the deposition reaction more strongly, resulting in a thicker or more densely packed deposit. However, there is a limit to this effect, as a potential that is too high can lead to unwanted side reactions or damage to the sensor. Decreased deposition potential can lead to lower sensitivity because a lower potential drives the deposition reaction less strongly, resulting in a thinner or less densely packed deposit. In the experiment, we studied the behaviour of deposition potential -0.1 to -1V, (Figure 2), and the highest signal peak was obtained at - 0.3V, so finalised.
3.2.3 Optimisation of SWV Parameter- Deposition Time
Deposition time affects the sensitivity of the analyte to be detected, so sufficient time must be spent adsorption of targeted species to the electrode’s surface.
As the deposition time increases, more analyte ions can migrate to the electrode and be reduced/oxidized (depending on the experiment). This leads to more accumulated analyte on the electrode surface, resulting in a progressively higher current signal during the stripping stage (30). This is typically observed as a linear increase in peak current with increasing deposition time. Eventually, the analyte occupies all available active sites on the electrode surface. Further increasing the deposition time won't significantly increase the current signal, as no more analyte can be accumulated. This is the saturation point, and the current may reach a plateau or even start to decrease slightly. To optimise deposition time for arsenic ions, we examined 30 to 300 sec, and 60sec was observed as sufficient time (Figure 3) for the arsenic ions to adsorb on the electrode surface (31) .
3.2.4 Electrochemical Effect of Scan Rate on the As3+ Signals
The scan rate in square wave voltammetry (SWV) significantly impacts the analyte's current signal, influencing both its magnitude and signal/noise ratio. As the scan rate increases, the peak current of the analyte generally increases because faster potential switching leads to a steeper concentration gradient near the electrode surface, enhancing the diffusion flux of the analyte and boosting the faradaic current. Also, increasing the scan rate can improve the signal-to-noise ratio (SNR) because the background current (primarily arising from double-layer charging) increases linearly with the scan rate, while the faradaic current increases proportionally to the square root of the scan rate. Therefore, the faradaic signal becomes more prominent at higher scan rates relative to the background noise.
The current signal peak is proportional to the square root of the scan rate according to the Randles–Ševčík equation (a), (32) .
2.69 × 10⁵ n1.5 AC √Dv………………. (a)
- ip = current
- n = number of electrons transferred
- A = electrode area in cm2
- D = diffusion coefficient in cm2/s
- C = concentration in mol/cm3
- ν = scan rate in V/s
In this work, we have recorded the current signal (Figure 4) at different scan rates (50 to 350mV/sec), and the highest current peak was reached at a scan rate of 200 mV/Sec; therefore, 200 mV/Sec was selected as the optimal scan rate, ensuring the fastest sensor response time and the least limit of quantitation (LoQ).
3.2.5 Supporting Electrolytes and the effect of pH
The type and pH of the supporting electrolyte greatly influence arsenic's behaviour during square-wave anodic stripping voltammetry. As a result, selecting an electrolyte takes careful consideration. Figure 5 shows how different electrolytes affect the measurement of Arsenic. HNO3 at 1.08 V was found to have the highest detection sensitivity, followed by potassium chloride (pH 2), acetate buffer (pH 4.5), and hydrochloric acid (pH 1). Hydrochloric acid did not produce a sensitivity or an arsenic peak. (25) Chlorine ions from the hydrochloric acid electrolyte solution may be adsorbed on the Gold and cover the electrode surface due to the electrode's wide surface area, which eventually limits the number of active sites for arsenic adsorption. (33) Mohammad et al., (2010) mentioned in their research that Cl1- may serve as an ionic bridge to help reduce Arsenic by forming complex Arsenic to create AsCl3, leading to quicker electron kinetics. Meanwhile, the origin of this arsenic peak couldn't be identified and was subject to wide variation (34) . In 0.1 M KCl, a broad peak was observed, and no detectable arsenic signals were found, so this investigation did not consider arsenic detection. Since the development of the extra peaks in the 0.1M acetate buffer was not fully understood, it was not considered for arsenic detection in this investigation. The low sensitivity in detection under high pH conditions may be due to the valency change, hydrolysis of Arsenic, and presence of other interfering ions of electrolytes, which may interact with the electrode surface and make the Arsenic interact with the electrode at its ultralow concentration quite tricky (25) (35) . 0.1 M nitric acid solution produced results that were quite sensitive. So, from the analysis, it was observed that the supporting electrolyte nitric acid plays an exciting role in increasing the arsenic solution's conductivity, providing optimum sensitivity and sharp stripping peak current toward As3+ compared with other supporting electrolytes (20) . Therefore, pH 1 was chosen as the optimum pH for all subsequent experiments.
3.2.6 Interference Study
The selectivity toward As3+ was verified by measuring multicomponent potential competing for anions (Fluoride, phosphate, and Bromide, respectively). In the potential range of -0.5 to 1V, little stripping peak current signal could be observed for the Anions mentioned above, even though they are at high concentrations (100ppb) compared with that of 50ppb As3+ refer to Figure 6. Therefore, the proposed sensor is selective, i.e., it does not influence the potential interfering ions.
3.3 Voltammogram and Linearity
The ASV response in terms of voltage versus current plot (Voltammogram) was obtained (Figure 7) for a varying arsenic concentration (5-50 ppb). An anodic current peak arises at a 1.078 V stripping window (oxidising potential), which is uniquely obtained through the above-stated optimisations (Table 2) and provides the sensor specificity for the targeted analyte. The Calibration curve for Arsenic ions sensing is a plot between concentration and current values (Figure 8). The Calibration curve's slope value is 2.3512, indicating the higher sensitivity, and the regression coefficient R2 is 0.9987, proving strong linearity between the current value and arsenic concentration.
Table 2. Optimised Parameters for Arsenic Quantification
|
Optimised parameters for the As3+ Sensing |
|
|
Deposition Potential |
-0.3V |
|
Deposition Time |
60 sec |
|
Quiet Time |
20 sec |
|
Amplitude |
25mV |
|
Step Size |
4mV |
|
Frequency |
50Hz |
|
Scan Rate |
200mV/sec |
|
Stripping Potential |
1.078V |
3.4 Detection and Quantitation Limit
The detection limit is a critical parameter in analytical contexts, representing the smallest quantity of a substance that can be reliably distinguished from its absence. In the context of detecting genetically modified grains, LOD is defined in terms of the probability of detection (POD), which is influenced by sampling uncertainty. The LOD & LOQ values were calculated from the linear curve (36) using equations (1,2) are given below:

The repeatability test is measured by the relative standard deviation (RSD) of multiple measurements (standard trial experiments in triplicates) made under the same conditions. The values for detection limits were calculated using equations (1) and (2), given in Table 3.
Table 3. Detection and Quantification limit for As3+ ions
|
Analyte |
Sensitivity (µA/ppb) |
R2 |
SD |
LoD (ppb) |
LoQ (ppb) |
|
As3+ |
2.3512 |
0.9987 |
0.258 |
0.33 |
1.09 |
4.2 Statistical Modelling and Chemometric Analysis
In this study, the data analysis was done using the software “The Unscramble (version 10.4)” to explore the trends in the varying Arsenic Samples of concentration range (5 to 50 ppb) and extract optimised data relevant to variables, including oxidising potential, scan rate, deposition potential and deposition time, which are associated/responsible for maximum peak current values without noise or disturbance, and provided linear sensing trend (37) .
3.5.1 Principal Component Analysis
Principal Component Analysis, or multivariate technique, analyses a data set in which observations/behaviours are described through several inter-correlated quantitative dependent variables (38) . Using PCA, large oxidising potential scan data is extracted into smaller data sets, which becomes easier to explore and visualise, making analysing data much more manageable. After applying data reduction, it was found that PC1 and PC2 carry 99% and 1% of the data variance, respectively, i.e. PC1 indicated maximum variance in the dataset. From the weighted regression coefficient (BW) analysis (Figure 9, BW-Plot), it was seen that at 1.078 V stripping potential value (close to PC1 as seen in Figure 9, correlation loading plot) suggests that at this particular oxidising potential value (refer to Figure 9, correlation loading plot), linear behaviour of Arsenic samples distributed based on the current values as seen in Scores plot (Figure 9).
3.5.2 Optimisation of Prediction Model Parameters/Design Variables
In this analysis, different parameters were studied, including deposition potential, deposition time, and scan rate affecting the current response for Arsenic samples. The data analysis found (refer to Figure 11, BW-Box Plot) that -0.3V deposition potential, 60 sec & 300sec deposition time, the scan rate of 75mV/s & 200mV/s shows maximum weighted regression coefficients (BW), indicating that these are the most relevant features/design variables that can be used to predict the Arsenic concentration. A similar analysis was confirmed by the Correlation loading plot and Scores plot (Figure 10). The design/optimised variables (Dp, Dt, SR) are used in the correlation loading plot to develop a regression model that lies on the highest explained variance eclipse and is closest to the PC1 axis. The closeness to the PC1 axis indicates the least angle with the origin and the direct proportionality to the concentration of the samples, i.e., increasing from left to right direction. Also, the external eclipse variables (DP3, DT2, and SR4) inform 100 % of the variance explained in the information in the model.
3.5.3 PLSR Regression Model
Based on the optimised design variables using weighted regression coefficient (BW), a regression model was developed to predict the Arsenic concentration with RMSE (cal. & val.) and R-square (cal. & val.) values 0.596 &1.10 and 0.998 & 0.996, respectively (Figure 12). The slope value obtained for the regression plot is 0.998&0.984 (cal. & val.). In Table 5, the fitness measures (R-square, RMSE, RMSEP and Slope) indicate robustness and reliability to predict (39) . The reliability of the prediction was tested using the full cross-validation method. The model was fitted using Factor 1 only.
Table 4. Prediction Model Fitness Measures
|
Analyte |
Values |
Slope |
Offset |
RMSE |
R2 |
RMSEP |
|
As3+ |
Calibrated |
0.998 |
0.036 |
0.596 |
0.998 |
0.596 |
|
Validated |
0.984 |
0.243 |
1.103 |
0.996 |
3.5.4 Predicted with Deviation Interpretation
A prediction vs deviation interpretation can be made (Figure 13) to know the model's reliability and how well it can predict the unknown samples whose reference measurements are unknown. In Figure 13, the horizontal red line shows an expected response for the As3+ samples. The blue box around the predicted value (that spans the deviation in both directions) estimates the prediction uncertainty. From the X-variable values for the samples, deviations from the calibration samples can be seen in Figure 14 and Table 6. Also, Figure 13 shows the Predicted vs Reference plot for test set validation, where the Root Mean Square Error of Prediction (RMSEP) is a dispersion of the validation samples around the regression line.
Table 5. Prediction with Deviation Values
|
Reference (ppb) |
Predicted (ppb) |
Deviation |
|
5 |
4.8201 |
0.7144 |
|
10 |
9.9785 |
0.8137 |
|
20 |
19.7297 |
0.5499 |
|
30 |
30.4928 |
0.7151 |
|
40 |
40.9350 |
0.9352 |
|
50 |
49.0440 |
1.1050 |
This study demonstrated that the standard gold electrode can be applied as a sensor for sensing arsenic ions using the electrochemical technique of square wave anodic stripping voltammetry (SWASV). The Limit of Detection and Quantitation was measured at 0.33 ppb and 1.09 ppb, respectively, which is less than the safe Arsenic limit. It was found that the sensitivity value is 2.3512µA/ppb, proving the proposed sensor's sensitivity. For further analysis, we used Chemometric models to predict arsenic concentration from 5-50ppb with encouraging fitness measures (R-square, RMSE, RMSEP). The highest deviation in prediction is 1.10, and the minimum is 0.55, which is acceptable. Weighted regression coefficients (BW) are checked to optimise the process parameters (Dp, Dt, and SR) for developing a prediction model for Arsenic sensing at trace levels.
To our knowledge, the work has achieved high sensing characteristics (LoD, LoQ, and range) using a bare gold electrode scheme in conjunction with electrolyte, SWASV parameter optimisation, and Chemometric modelling. The work presented can be of particular relevance as far as field deployment of arsenic sensing is concerned. The reported work paves the way for developing field-usable heavy metal ions sensing probes that are rugged, highly sensitive, and selective, thus helping deliver clean water to consumers and supporting the efforts of protecting against environmental degradation and sustainable goals.
Acknowledgements
The authors feel grateful to Prof S Anant Ramakrishna, Director CSIR-CSIO, Chandigarh, India, for facilitating the reported research. The written work is a part of the CSIR-funded project, MLP0060, and is duly acknowledged.
CP- Chronopotentiometric
DPASV-Differential Pulse Anodic Stripping Voltammetry
TNThNPCP-Two novel thoria (ThO2) nanoparticles-carbon paste
ASV-Anodic Stripping Voltammetry
GNPCNTs-Gold nanoparticles on multiwalled carbon nanotubes
SPCE- Silica nanoparticles (SiNPs)-modified screen-printed carbon electrode
LSASV- Linear sweep anodic stripping voltammetry
Au/GNE-Gold nanotextured Electrode
rGO-AuN/GCE- Reduced graphene oxide (rGO) and gold nanoparticles on a glassy carbon electrode
SWASV-Square wave anodic stripping voltammetry
BGE- Bulk Gold Electrode
- Using Stripping Voltammetry to Determine Heavy Metals in Cooking Spices Used in Iraq. Matloob, M.H. and . 2016, Pol. J. Environ. Study, pp. 2057-2070.
- Analysis and speciation of Arsenic by stripping potentiometry : a review. E., Mu. and Palmero, S. 2005, talanta, pp. 613–620.
- Enhanced Cathodic Preconcentration of As(0) at Au and Pt Electrodes for Anodic Stripping Voltammetry Analysis of As(III) and As(V). Bu, L., et al. 2015, The Journal of Physical Chemistry C., pp. 11400–11.
- WHO. Arsenic in drinking-water: background document for development of WHO guidelines for drinking-water quality. Geneva : World Health Organization, 2019.
- Toxicological profile for Arsenic. https://www.atsdr.cdc.gov/toxprofiles/tp2.pdf. U.S : U.S. DEPARTMENT OF HEALTH AND HUMAN SERVICES , 2017.
- Arsenic toxicity, mutagenesis, and carcinogenesis – a health risk assessment and management approach. Tchounwou, P.B., J.A., Centeno and A.K, and Patlolla. 2004, Molecular and Cellular Biochemistry, pp. 47–55.
- TOXICOLOGICAL PROFILE FOR. U.S : U.S. DEPARTMENT OF HEALTH AND HUMAN SERVICES , 2007.
- The Ganga River: A Summary View of a Large River System of the Indian Sub-Continent. S.K. Tandon, R. S. 2018, The Indian Rivers, pp. 61–73.
- Analytical applica tion using modern electrochemical techniques. O.A. Farghaly, R.S.A. Hameed, A. Alhakeem, H. Abu-Nawwas. 2014, Int. J. Electrochem. Sci., pp. 3287–3318.
- Voltammetric detection of Arsenic on a bismuth-modified exfoliated graphite electrode. T. Ndlovu, B.B. Mamba, S. Sampath, R.W. Krause, O.A. Arotiba. 2014, Electrochim. Acta, pp. 48–53.
- Modified electrodes used for electrochemical detection of metal ions in environmental analysis. G. March, T. Nguyen, B. Piro. 2015, Biosensors , pp. 241–275.
- Anodic stripping voltammetry of Arsenic (III) using gold nanoparticle-modified electrodes. X. Dai, O. Nekraseova, M.E. Hyde, R.G. Compton. 2004, Anal. Chem. , pp. 5924–5929.
- Gold nanostar electrodes for heavy metal detection. S., Dutta, G., Strack and Kurup, P. 2018, Sensors Actuators, B Chem., pp. 383–391.
- Chemical Low-cost screen-printed sensors on-demand : Instantly prepared sparked gold nanoparticles from eutectic Au / Si alloy for the determination of Arsenic at the sub-ppb level. Trachioti, M.G., et al. 2018, Sensors and Actuators B , pp. 273–280.
- Biosensors and Bioelectronics Aptamer-DNA concatamer-quantum dots-based electrochemical biosensing strategy for green and ultrasensitive detection of tumor cells via mercury-free anodic stripping voltammetry. Zheng, Y. 2018, Biosens Bioelectron, pp. 261–268.
- Chemical Integrated on-chip sensor with sputtered Ag-Au-Au electrodes for the voltammetric determination of trace Hg(II). Roditi, E., Tsetsoni, M. and Kokkinos, C., Economou, A. 2019, Sensors Actuators B. Chem., pp. 125-130.
- Determination of As(III) by anodic stripping voltammetry using a lateral gold electrode: experimental conditions, electron transfer and monitoring of electrode surface. Agnese Giacomino, Ornella Abollino, Marco Lazzara, Mery Malandrino, Edoardo Mentasti. 2011, Talanta, pp. 1428-1435.
- Inorganic arsenic speciation by differential pulse anodic stripping voltammetry using thoria nanoparticles-carbon paste electrodes. Pereira, F.J., et al. 2016, Talanta, pp. 211–218.
- Electrochemical deposition of gold nanoparticles on reduced graphene oxide by fast-scan cyclic voltammetry for the sensitive determination of As(III). Zhao, G. and Liu, G. 2019, Nanomaterials, p. 41.
- Electrochemical detection of arsenite using silica nanoparticles-modified screen-printed carbon electrode. Ismail, S., et al. 2020, Materials (Basel), p. 3168.
- Voltammetric detection of Arsenic (III) using gold nanoparticles modified carbon screen printed electrodes: Application for facile and rapid analysis in commercial apple juice. Connor Sullivan, Dingnan Lu, Andre Senecal, Pradeep Kurup. 2021, Food Chemistry, p. 129327.
- Highly sensitive detection of Arsenic in groundwater by paper-based electrochemical sensor modified with earth-abundant material. Rashmi V. Dahake, A. B. 2022, Groundwater for sustainable development, p. 100855.
- Speciation of inorganic Arsenic in alimentary and environmental aqueous samples by using derivative anodic stripping chronopotentiometry (dASCP). Dugo, G., et al. 2005, Chemosphere, pp. 1093–1101.
- Sensitive electrochemical detection of Arsenic (III) using gold nanoparticle-modified carbon nanotubes via anodic stripping voltammetry. L., Xiao, G.G., Wildgoose and Compton, R.G. 2008, Anal. Chim. Acta, pp. 44–49.
- Highly Sensitive and Selective Detection of Arsenic using electrogenerated nanotextured gold assemblage. Babar, N.U.A., et al. 2019, ACS Omega, pp. 13645–13657.
- Determination of Arsenic(III) at a Nanogold Modified Solid Carbon Paste Electrode. Sakira, A.K. 2015, Electroanalysis, pp. 309–316.
- Screen-printed electrodes for environmental monitoring of heavy metal ions: a review. Barton, J. 2016, Microchim. Acta, pp. 503–517.
- Modified Electrodes Used for Electrochemical Detection of Metal Ions in Environmental Analysis. March, G., Dung, T. and Piro, B. 2015, Biosensors, pp. 241-275.
- Chemical Synthesis and scharacterisation of the first cyrhetrenyl-appended calix[4] arene macrocycle and its application as an electrochemical sensor for the determination of Cu(II) in bivalve mollusks using square wave anodic stripping voltammetry. Pizarro, J. 2018, Sensors Actuators B. Chem., pp. 115-122.
- Electrochemical sensors for in-situ measurement of ions in seawater. Cuartero, Maria. 2021, Sensors and Actuators B: Chemical, p. 129635.
- Electrochemical detection of lead and cadmium in UHT-processed milk using bismuth nanoparticles/Nafion-modified pencil graphite electrode. Palisoc, S., et al. 2019, Sensing and Bio-Sensing Research, p. 10026.
- Team, PSIBERG. Randles-Sevcik equation: The Cyclic Voltammetry peak current (Ip). s.l. : PSIBERG Team, 2022.
- Selective Detection of As(III) at the Au(111)-like Polycrystalline Gold Electrode. Mohammad Rezaur Rahman, T. O. 2010, Anal. Chem., pp. 9169–9176.
- Electrochemical Determination of Arsenite Using aGold Nanoparticle Modified Glassy CarbonElectrode and Flow Analysis. Ehsan Majid, S. H. 2006, Anal. Chem., pp. 762-769.
- Anodic Stripping Voltammetry of Arsenic(III) using gold nanoparticle-modified electrodes. Xuan Dai, O. N. 2004, Anal. Chem. , pp. 5924-5929.
- A simple and sensitive electrochemical method for the determination of capsaicinoids ichilli peppers. W., Lyu. 2019, Sensors Actuators B. Chem., pp. 65–70.
- Electrochemical sensors coupled with multivariate statistical analysis as screening tools for wine authentication issues: A review. Geană, E.I., Ciucure, C.T. and Apetrei, C. 2020, Chemosensors, p. 59.
- Multivariate Statistical Data Analysis- Principal Component Analysis (PCA). Mishra, S. 2017, International Journal of Livestock Research, pp. 60-78.
- Authentication of Tokaj Wine (Hungaricum) with the Electronic Tongue and Near Infrared Spectroscopy. Zaukuu, J.L.Z., et al. 2019, J. Food Sci.,, pp. 3437–3444.
No competing interests reported.