Study populations
The research took place in Burkina Faso, specifically in the Boulkiemde province, spanning from February 2019 to January 2020. In this investigation, we enrolled a total of 30 households in good health from three different cohorts in Burkina Faso, comprising 147 individuals of varying ages, from 1 to 73 years old. These households were carefully chosen from three distinct locales with different urbanization levels: rural villages, the semi-urbanized area of Nanoro town, and the urban area of the capital city, Ouagadougou. These selection criteria align with the details outlined in our earlier publication by Casari et al. in 2022 [34]. Participants’ enrollment was performed during the dry season with the support of the Nanoro Health and Demographic Surveillance System (HDSS), a surveillance organ established by the Clinical Research Unit of Nanoro (CRUN). Data on lifestyle, dietary habits, socio-economic conditions, hygiene, sanitation, health status at the time of enrollment and previous illnesses, were collected in a database by means of a questionnaire already analyzed by Casari et al. 2022 [34].
The main characteristics of the African cohorts are the following :
(i) 10 polygamous households, composed by one father, at least 2 mothers and up to 4 children (n=51 individuals), randomly selected by three rural villages (Boulpon, Poessi, and Godo, details in Casari et al. 2022 [34]) located in Boulkimede province. The populations of these rural villages live on subsistence farming and raise small animals (e.g., chickens and goats). Their housing are clusters of huts built using soil, wood, and straw, without electricity and scarce access to water. These households are in poor contact with urban areas. Their diet is traditional and predominantly plant-based (i.e., local cereals, legumes, and herbs). Western influences on diet are almost totally absent. This population is at high risk of infectious diseases and malnutrition.
(ii) 10 families, either polygamous or monogamous, with one father, one or two mothers, and up to 4 children (n=51 individuals), living in the semi-urbanized area of the small town of Nanoro. People live in groups of small brick houses with scarce access to electricity. Water is collected from public wells. Their diet is still traditional and plant-based, but different foods can be found at local markets, including meat and dried fish that they eat once-a-week, and occasionally processed and Western-like foods. In this area, people are at risk of infectious diseases and malnutrition.
(iii) 10 monogamous families, with one mother and father and up to 4 children (n= 45 individuals) living in the capital city of Ouagadougou, selected among wealthy urban families in medium-high economic conditions. This population lives in concrete or brick buildings with access to electricity and private water sources. They have a predominantly Burkinabè diet, but have access to a variety of foods, including Western and processed foods available in supermarkets. These families have good hygiene and sanitation, and the risk of infection and malnutrition is extremely reduced.
In addition, a total of 143 subjects belonging to 45 different families, composed of 2 parents and up to 4 children, living in the urban areas of Florence (Tuscany, Italy) have been enrolled as representatives of an urban population with a Western-like diet and lifestyle.
Inclusion and exclusion criteria of study participants
Inclusion criteria for the African cohorts were as follows: (i) households and families composed of a biological father and from 1 to more mothers and up to 4 children; (ii) belonging to the Mossi ethnic group; (iii) apparently in good health status.
Exclusion criteria: individuals who had fever (>38.5 °C) in the previous 72 hours, in order to exclude acute illnesses at the time of enrollment.
For Italian families, inclusion criteria are: (i) families composed of 2 parents and up to 4 children living in urban areas in Florence province (Italy); (ii) good health status.
Subjects with acute illnesses, including infections, at the time of enrollment were not included in the project. Furthermore, in order to avoid conceptual and descriptive biases, the subjects with gastrointestinal diseases such as Crohn disease and ulcerative colitis were removed from the current study due to the impact of these pathologies on the intestinal microbiota (A total of 8 children with Crohn’s disease and 12 children with ulcerative colitis from Italian cohort were removed from the whole subjects cohort included in the bioproject mentioned in the section ‘Availability of data and materials’). To avoid technical biases during the analysis, we also removed two samples, 1 from the Italian cohort and 1 from the Nanoro cohort, which presented no fungal counts (samples named ‘IT-IBD-21-F1’ and ‘F304N’ were removed from the whole subjects cohort included in the bioproject mentioned in the section ‘Availability of data and materials’).
For all the enrolled African and Italian participants included in the analyses, information obtained by the questionnaires about health status, diseases, vaccinations, dietary habits, and socio-economic conditions were extensively reported in Supplementary Table 1.
The pruning procedures based on the exclusion criteria mentioned above produced a final dataset composed of 122, 45, 50 and 51 subjects from the Italian, Ouagadougou, Nanoro and Rural villages cohorts, respectively, on which the statistical analyses were carried out.
Data deposition
Sequence data are deposited in the European Nucleotide Archive (ENA) under accession code PRJEB59322. The dataset available in the EBI-ENA database includes ITS1 raw sequences from both healthy subjects and patients with inflammatory bowel disease. For the computational analysis of this study, only healthy subjects belonging to families were considered.
Ethics
In Burkina Faso, the study was carried out in accordance with the recommendations of the National Ethics Committee of Burkina Faso that granted ethical clearance (reference number 2018-8-104). For the Italian families, the study was approved by the Ethics Committee of Meyer Children Hospital, Florence, Italy (reference number 187/2018).
Adult participants gave their informed consent. Parents or primary caregivers signed off on children under the age of 18. Confidentiality was maintained for data and sample collection by assigning each participant an identifying code.
Sample collection and DNA extraction
For each participant, a stool sample was collected by a commercial sterile collection tube supplied with RNAlater (Thermo Fisher Scientific), then stored at -80°C in order to preserve nucleic acids. The DNeasy PowerSoil Pro Kit (Qiagen) was used to extract total DNA from 250 mg (wet weight) of each fecal sample according to the manufacturer's instructions. The Qubit 4 Fluorometer (Thermo Fisher Scientific) and the 1x dsDNA High Sensitivity Kit were used to assess DNA concentration before the downstream analyses.
ITS1 amplification, library preparation and sequencing
For each DNA sample, the fungal internal transcribed spacer 1 (ITS1) was amplified using a specific primer set for the ITS1 rDNA region (ITS1f: 5′‐CTTGGTCATTTAGAGGAAGTAA‐3′ and ITS2r: 5′‐GCTGCGTTCTTCATCGATGC‐3′) [35], with overhang Illumina adapters. Library preparation was performed according to the Fungal Metagenomic Sequencing Demonstrated Protocol (Document # 1000000064940 v01).
Sequencing was performed on the Illumina MiSeq platform (Illumina) with the V3 chemistry 600 cycle PE300 protocol at the Department of Biology, University of Florence, Italy.
Amplicon sequence variance assemblage
Both primer sequences were removed by using cutadapt version 1.15 [36] in paired-end mode. If a primer sequence was not found, the entire sequence was discarded along with its pair to reduce possible contamination. The raw sequences were processed using DADA2 pipeline version 1.14.1 [37] to infer amplicon sequence variants (ASVs). The low quality reads were filtered using the “filterAndTrim” function with a maximum number of expected error thresholds of 2 for forward and reverse read pairs and a minimum cut-off length of 70bp. Error rate estimation (“learnErrors” function) and denoising (“dada” function) with default parameters were performed. Denoised reads were merged using the “mergePairs” function, discarding those with any mismatches and/or an overlap length shorter than 20 bp. Chimeric sequences were also removed (“removeBimeraDenovo” function) and taxonomic classification was produced by using DECIPHER package version 2.14.0 against the Warcup database for fungal ITS1 [38]. All sequence variants not classified as Fungi and/or with no fungal counts were removed from the dataset to properly perform the downstream analyses.
Statistical analysis
Statistical analyses were performed in R environment version 4.2.2 [39].
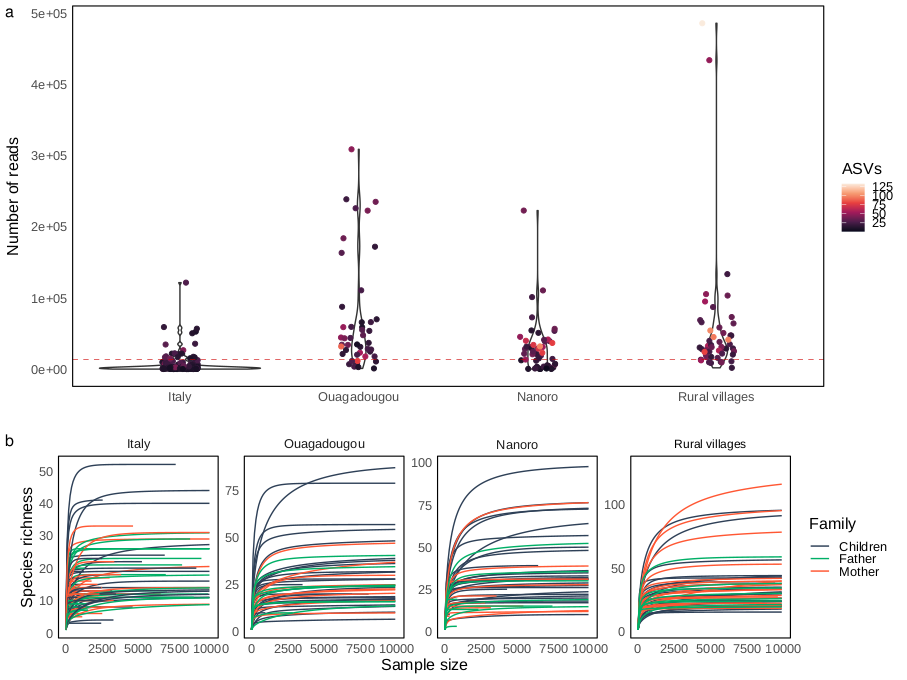
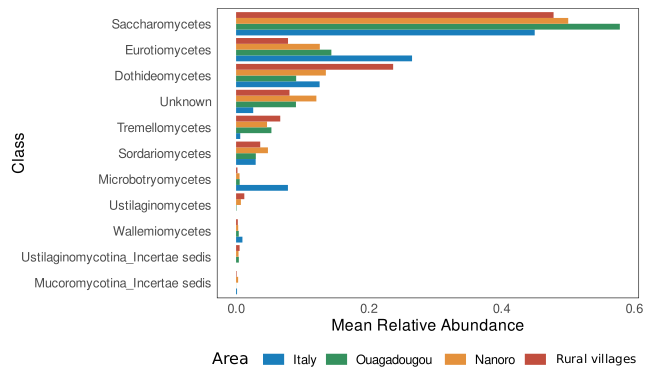
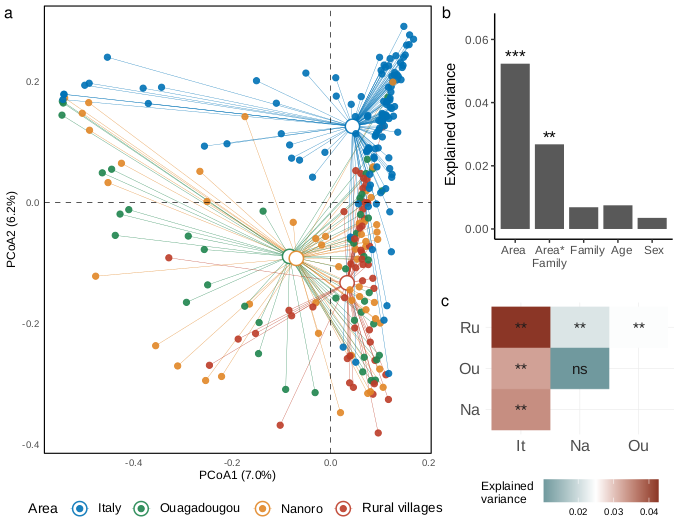
Sequencing depth was depicted by rarefaction curves generated by using the “ggrare” function of “ranacapa” package version 0.1.0 [40]. Mean relative abundance was calculated using “microbiomeutilities” package version 1.0.17 [41]. Variations in fungal diversity (beta diversity analysis) were inspected using “vegan” package version 2.6.4 [42]. In detail, samples distribution was displayed by principal coordinate analysis (PCoA) using the “cmdscale” function of the “stat” package performed on distance matrices based on Bray-Curtis diversity index and Jaccard similarity coefficient to infer quantitative and qualitative differences, respectively. The data were normalized before multidimensional analysis removing counts present less than once within the sample dataset, and then transformed in relative abundances to reduce coverage bias among samples. Permutational multivariate analysis of variance using distance matrices (adonis PERMANOVA) was performed to inspect differences between sample groups by using the “adonis2” function of “vegan” package. Adonis PERMANOVA was tested on a multiple factor formula (formula = ∼Area * Family + Age + Sex) considering the interaction between area and family degree due to the crossed design experiment. Pairwise comparisons on variance among geographical areas were assessed using pairwise adonis PERMANOVA by using the “pairwise.adonis” function from “pairwiseAdonis” package version 0.4 [43] adjusting the resulting p-values with Holm correction method. The same model formula was used to inspect differences in alpha diversity metrics, first fitted the model formula using linear model (“lm” function of “stats” R package) then inspected by analysis of variance ANOVA type II from “car” package version 3.1.0 [44]. Covariation between nutritional data (amounts of macronutrients represented by the percentages of carbohydrates, simple sugar, total protein, animal protein, vegetable protein, fats, and gr/1000 Kcal of fibers) and beta diversity was assessed by fitting the nutritional parameters onto the principal components analysis (PCA) by using the ‘envfit’ function in ‘vegan’ package setting a number of permutations of 1000. PCA was built on VST (variance stabilizing transformation) scaled abundance matrix by using DESeq2 package version 1.38.3 [45] after single counts removal and estimated using the “rda” function of the “vegan” package.
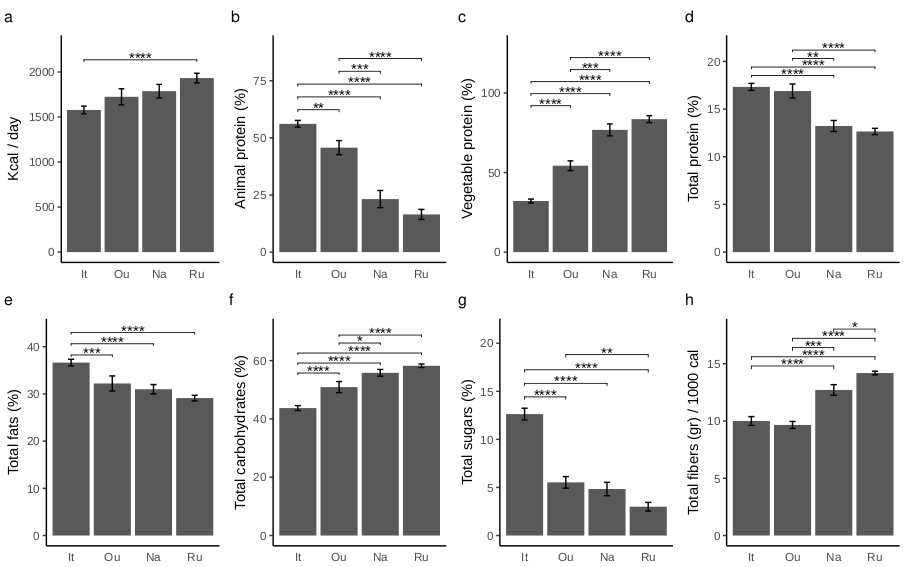
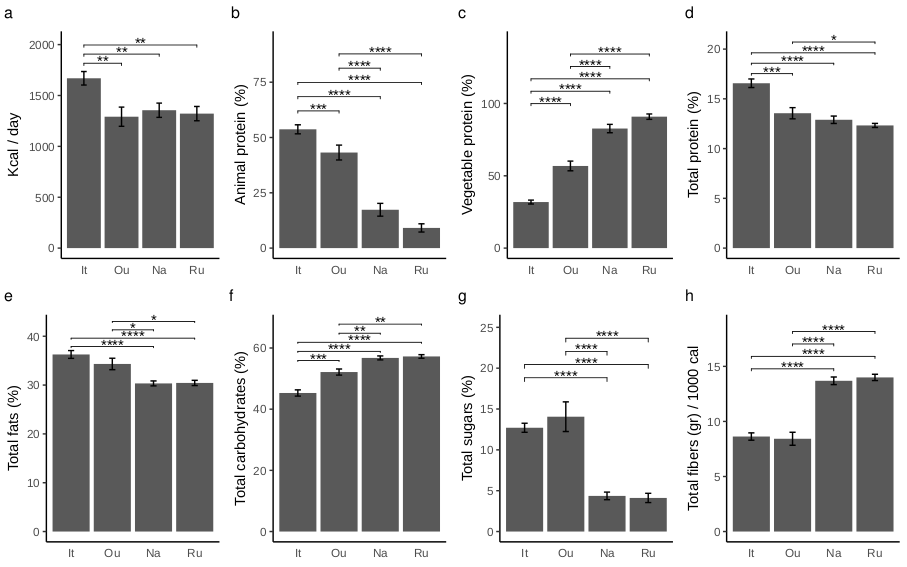
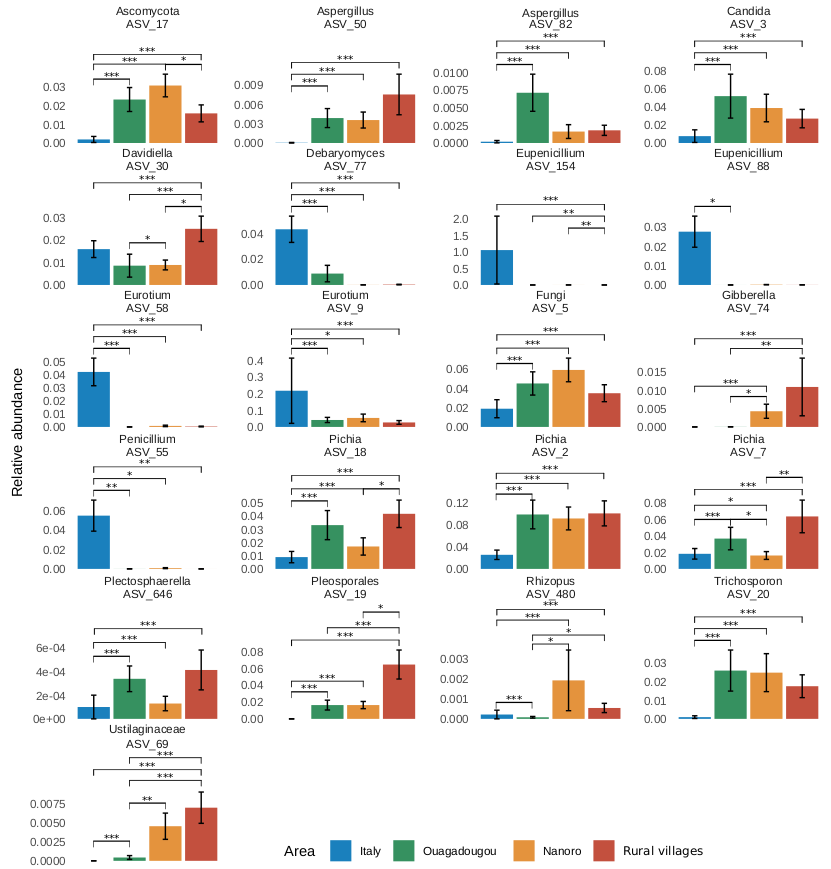
Differences in nutritional parameters among sample groups were assessed by Wilcoxon test by using the “wilcox_test” function from the “rstatix” package version 0.7.2 adjusting the resulting p-values with Benjamini-Hochberg correction method [46]. To assess differences on variance related to the family degree only, thus excluding the geographic area effect, the adonis PERMANOVA was also performed on multiple factors formula (formula = ∼Family member + Age range + Sex) after separating the dataset according to four geographical areas. All multivariate analyses were conducted with a number of permutations of 1000 and the r-squared values were used to inspect the amount of variance explained. The dispersion among sample group centroids was computed using the ”betadisper” function of “vegan” package and the differences in dispersion were tested using the analysis of variance (ANOVA) and Tukey post-hoc test (TukeyHSD function from “stats” R package) to inspect significant pairwise contrasts. After singleton removal, the differential abundance analysis was performed using the likelihood-ratio test (LRT) method by the “DESeq” function from the “DESeq2” package. LRT was used to test significance of change in deviance between a full model (Area + Family) and reduced model (Family) provided in the model formula. Statistically significant counts (alpha = 0.05) were scaled using variance stabilizing transformation (VST) then clustered using “pheatmap” package version 1.0.12 [47]. Differences in alpha diversity metrics and taxa relative abundances were assessed using the “ggpubr” package [46]. Figures were produced by using “ggplot2” package version 3.4.2 [48] and edited using open-source graphics editor Inkscape (http://inkscape.org/).