2.1 Cell Lines
Mouse brain endothelial cells (bEnd.3 cells, CL-0598, Procell) were maintained with culture media containing 10% FBS ( FBS-CP500, NEWZERUM), 1% 100* Penicillin-Streptomycin Solution (PB180120, Procell) in DMEM (10-013-CVRV, CORNING) at 37℃ in a 5% CO2-humidified incubator. Cell line was obtained directly from Pricella, with no additional cell authentication performed. Mouse nerve cells (CATH.a cells, HTX2209, ATCC)were maintained in CATH.a cell-specific medium (CM-0665, Procell) at 37℃ in a 5% CO2-humidified incubator. Cell line was obtained directly from ATCC, with no additional cell authentication performed.
2.2 Cell treatment
The bEnd.3 or CATH.a were seeded in six-well plates at a density of 10^5 cells/ml. We exposed bEnd.3 or CATH.a with 10mM exogenous L-lactate (L6402, sigma) or 5 mM α-cyano-4-hydroxycinnamic acid (α-CHCA) (S8612, Selleck) for 1 day before being examined..
For the contact co-culture experiments, we used Ibidi 2-well inserts (81176, ibidi) were installed into 20mm confocal culture dish (801001, NEST) with sterile tweezers and gently pushed with a gloved fingertip. Pretreated bEnd.3 or CATH.a with Laconic infection were seeded into opposite chambers at a density of 1 × 10⁵ cells/cm2 and incubated overnight. The culture insert was then removed with sterile tweezers and the well topped up with 1 ml of DMEM media. After 48-hour incubation, cells were fixed with freshly prepared 4% PFA (AWI0056b, Abiowell) for 30 minutes at room temperature. After fixing, cells were subjected to imaging using a Zeiss confocal laser scanning microscope LSM 9.
2.3 Lentiviral vector construction and transfection
The construct for Laconic (Plasmid #44238; San Martin et al, 2013) was obtained from Addgene. Seed well-conditioned target cells at a density of 5 × 10⁴ cells/well. Plate in a 24-well plate, and after cell counting, add 500 µL of DMEM culture medium to each well. After 24 hours, replace with DMEM medium containing 1 µg/mL Polybrene-plus, choosing an MOI (Multiplicity of Infection) value of 40, and add 20 µL of 1 × 10⁸ TU/mL viral particles. After 24 hours, replace with fresh culture medium. 72 hours post viral infection, observe under a fluorescence microscope to evaluate the efficiency of lentiviral infection in the target cells.
2.4 Adeno-associated virus construction and transfection
Adeno-associated virus used in this study was produced at the Obio Technology (Shanghai, China). The following AAV plasmid was used and detailed sequence information is available as detailed or upon request: pAAV-SIc16a1-FLAG-mCherry (Obio Technology). Injection volumes, coordinates and experimental purpose are described below.
2.5 Mice
Adult male or female C57BL/6 mice (8–10 weeks old, weight 20-25g) were used in this study. The animals were purchased from Hunan SJA Laboratory Animal Company Limited and were kept in a pathogen-free animal facility at Central South University, following standard purification procedures. They were housed in the laboratory animal unit, with a 12-hour day/night cycle, and were provided ad libitum access to food and water. All mice are housed in a laboratory animal facility with an ambient temperature of 22–24°C and relative humidity of 60–80%. Manual bladder voiding and all other animal care was performed 2 to 4 times daily throughout the entire experiment.
2.6 SCI models
The Animal Care and Use Committee of Central South University, Changsha, China, approved all animal protocols and experimental procedures. Perform routine anesthesia, skin preparation, disinfection, and draping. Make an incision centered on the T10 spinous process, sequentially cutting through the skin, subcutaneous tissue, muscles, and lamina to expose the spinal cord. Severe crush SCI were made after laminectomy of a single vertebra by using No. 5 Dumont forceps (Fine Science Tools, Foster City, CA) without spacers and with a tip width of 0.5mm to completely compress the entire spinal cord laterally from both sides for 5 second. Irrigate the wound, then close the incision in layers, cover with a dressing, and secure it. Postoperatively, mice are housed individually with standard feed and water available ad libitum. Administer penicillin 20,000 units bi-daily via intramuscular injection for postoperative infection prevention for 3 days. Manually express the bladder 2 to 4 times daily to assist with urination.
2.7 Spinal injections for AAV
To overexpress MCT1 in endothelial cells, partial laminectomy at the T9 spinal level was performed two weeks prior to spinal cord injury, using 30-33G Hamilton needles to bilaterally inject pAAV-Slc16a1-FLAG-mCherry2 (0.5 µl per injection) at two depths of 0.8 mm and 0.4 mm below the dorsal surface, spaced 1 mm apart, with each injection maintained for 5 minutes. Post-injection, the needle was left in the spinal tissue for 15–20 minutes. During the injection process, care was taken to keep the mice warm. The needle was then slowly withdrawn. The skin was sutured and the wound disinfected. For postoperative pain relief, mice were administered carprofen via intramuscular injection daily for 3 days. Animals were perfused 28 days after AAV injection.
2.8 Perfusions
At different time points post-SCI, 1% sodium pentobarbital (50 mg/kg) is administered intraperitoneally for deep anesthesia in mice. Rapid thoracotomy is performed to expose the heart, and a size 12 medical intravenous catheter is inserted into the left ventricle up to the origin of the ascending aorta and secured. The right atrium is incised, followed by sequential perfusion with pre-warmed heparinized saline and 10% formalin solution, maintaining the 10% formalin perfusion for approximately one hour. The specimens are then stored in a 4°C refrigerator.
2.9 Immunofluorescence
For immunofluorescence of tissue, frozen sections of 16-µm thickness from the spinal cord containing the lesion site were harvested at different time points post-SCI (or sham group) and cut along the sagittal plane. The frozen sections were rewarmed at room temperature for 15 minutes and rinsed three times with a PBS solution for 10 minutes each time. The immunohistochemical pen was used to circle the spinal cord sections on the slides. The sections were then permeabilized with 100µL of PBS solution containing 0.1% Tween 20 and 0.3% Triton-X 100 for 30 minutes and blocked with 5% BSA in PBS for an additional 30 minutes. After blocking, the sections were incubated with a group of primary antibodies including F4/80 (Abcam, ab6640, 1:400), TUJ-1 (CST, 5568, 1:400), GFAP (Proteintech, 16825-1-AP, 1:800), MCT1 (Proteintech, 20139-1-AP, 1:200), CD31(R&D systems, inc., fab3628G, and 1:200), overnight at 4℃. After being rinsed five times for 10 minutes each with PBS containing 0.1% Tween 20, the sections were incubated for one hour at room temperature with species-appropriate secondary antibodies conjugated with Alexa Fluor 594 (Abcam, 1:400) or Alexa Fluor 488 (Abcam, 1:400). Subsequently, the sections were rinsed with PBS containing 0.1% Tween 20 before being mounted on slides and covered with DAPI (Genetex).
For immunofluorescence of cells, we place sterile 24-well slides into a 24-well plate. The bEnd.3 or CATH.a, post trypsinization, are seeded onto the slides at a density of 5 × 10⁴ cells/well, with 0.5 ml of complete culture medium added per well. The culture plate is then incubated in a 37°C, 5% CO2 incubator. Once cells reach 85% confluency, the medium is aspirated, and old culture medium is washed off with PBS along the walls of the well. Each well is then fixed with 500 µl of 4% paraformaldehyde for 12 minutes, followed by a PBS wash to remove the paraformaldehyde. Each well is treated with 200 µl of 0.1% Triton-X100 in PBST for 20 minutes. After aspiration of the PBST, the wells are blocked with 3% BSA in PBS solution for 30 minutes. The blocking solution is then aspirated, and primary antibodies including CD31, MCT1, and TUJ are added and incubated overnight at 4°C. The next day, primary antibodies are aspirated, and the wells are washed three times with PBS for 5 minutes each. Corresponding secondary antibodies are then added and incubated at room temperature for 1.5 hours. After aspiration of the secondary antibodies, the wells are washed three times with PBS for 5 minutes each. A drop of DAPI solution containing an anti-fade agent is then added to the slide, and the cell slide is picked up with forceps and inverted onto the slide. The sections were analyzed under a fluorescence microscope or confocal microscope (Zeiss). To validate antibody specificity and distinguish genuine target staining from the background, secondary antibody-only controls were employed. The ImageJ software was used for quantitative analysis of the images, while the Imaris 9.0 software was used for 3D reconstruction.
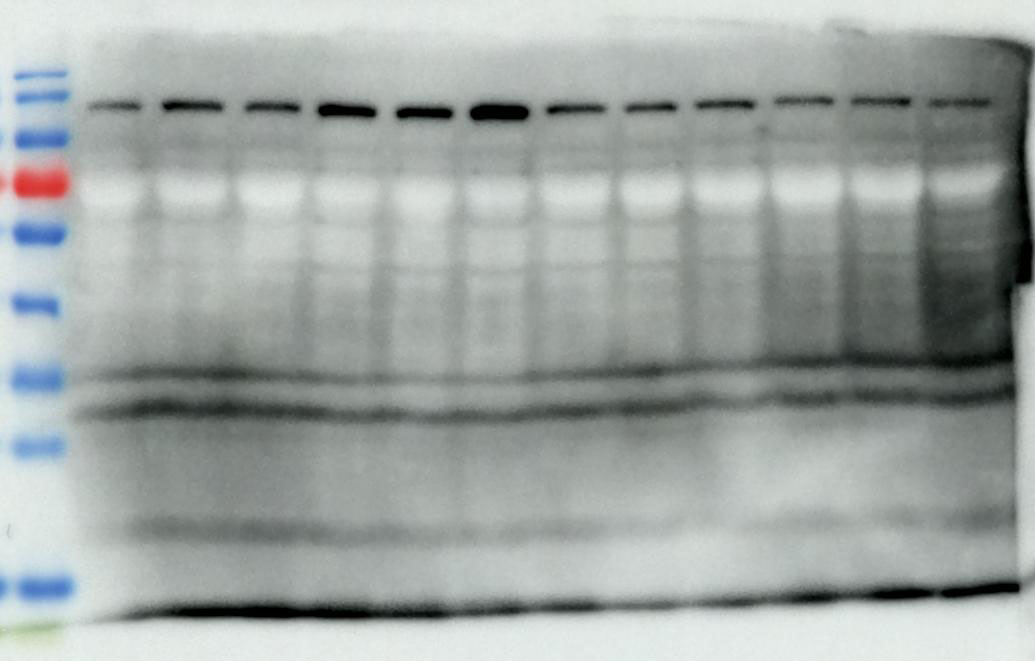
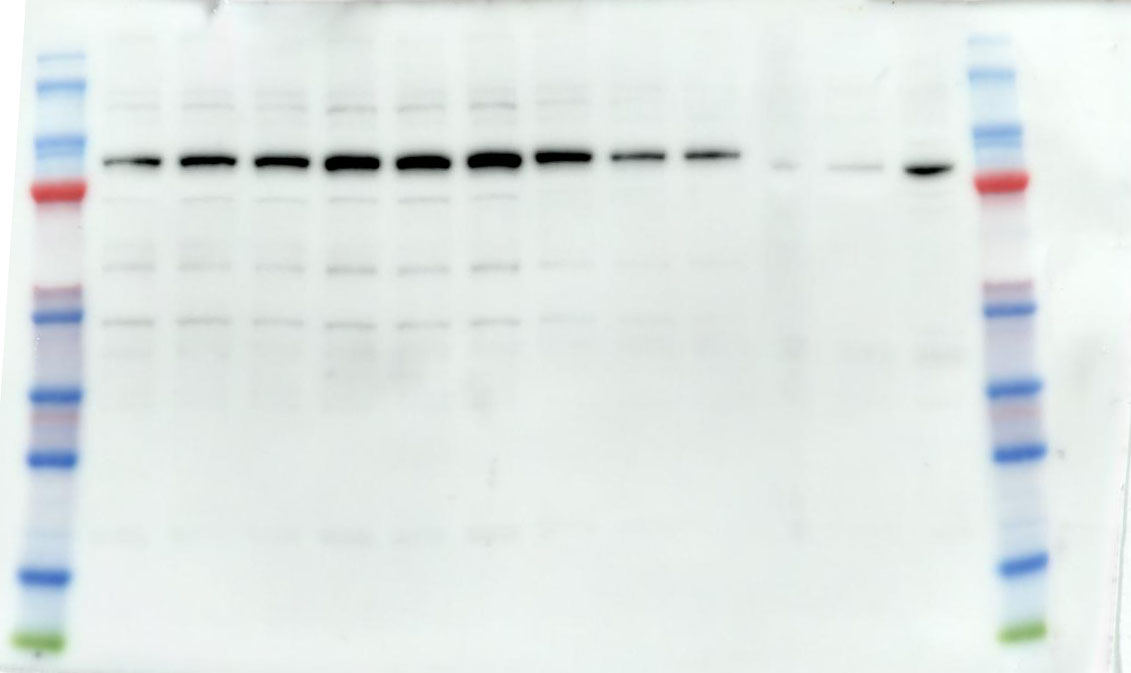
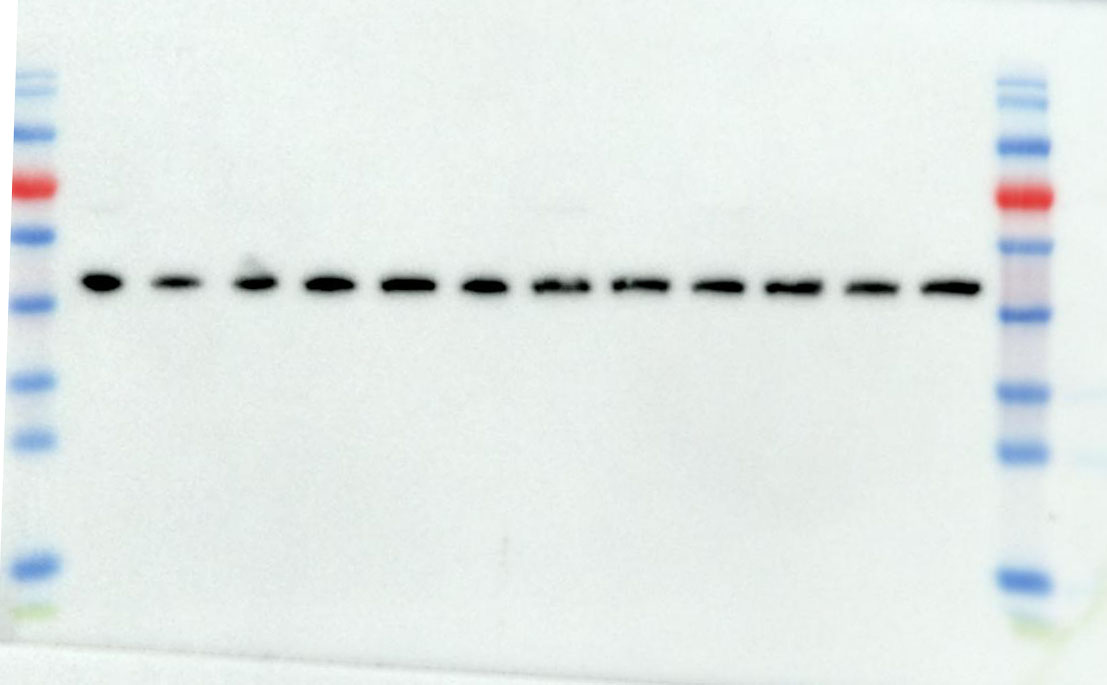
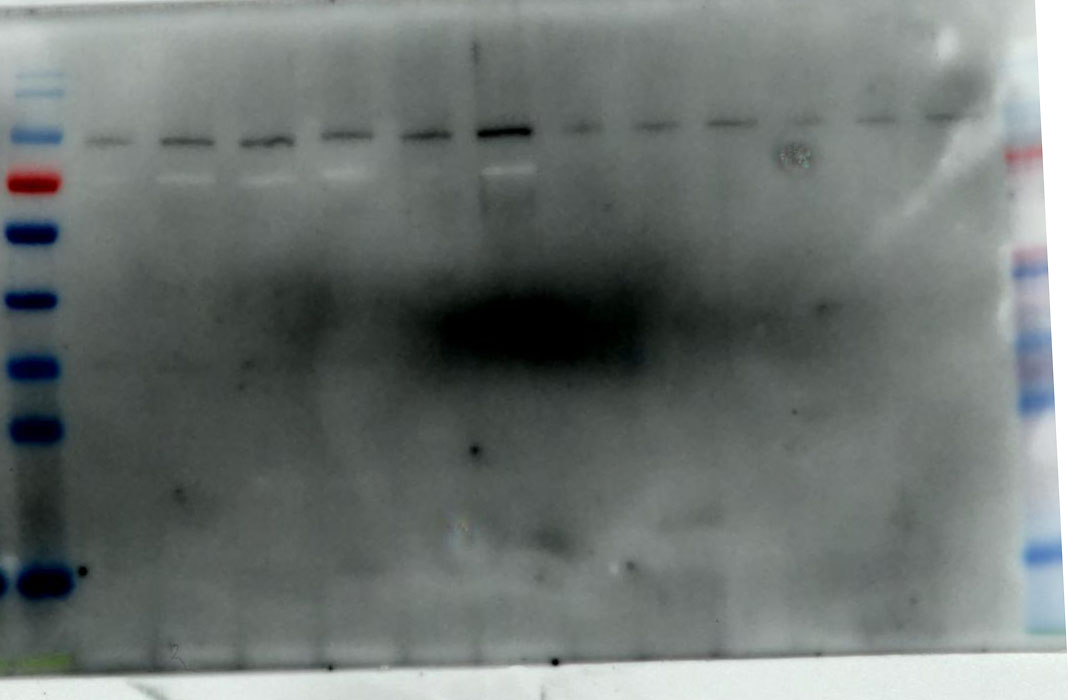
2.10 Western Blotting
We utilize a BCA Protein Assay Kit for protein concentration normalization. After adjusting protein samples to a protein to loading buffer ratio of 4:1, we denature the proteins in a 95°C metal bath for 10 minutes, followed by storage at -20°C for future use. During electrophoresis, samples are loaded into the gel wells. The voltage is set to 90V for the first 30 minutes, then adjusted to 120V until the protein bands are fully separated. Subsequently, PVDF membranes are activated with anhydrous ethanol and carefully placed on the SDS-PAGE gel, ensuring no bubbles are formed. The PVDF membrane and SDS gel are sandwiched between sponges and filter paper and electrotransferred in an ice-water mixture at 300mA for 90 minutes. The PVDF membrane is then blocked with 5% non-fat milk in TBST solution on a shaker for 1.5 hours. Afterward, the membrane is washed three times with TBST, each for 5 minutes. The corresponding bands are cut, and primary antibodies are added for incubation at 4°C overnight. The next day, the primary antibodies are aspirated, and the membrane is washed three times with TBST for 10 minutes each. Corresponding Western blot secondary antibodies are then added and incubated at room temperature on a shaker for 1 hour. After aspiration of the secondary antibodies, the membrane is washed three times with TBST for 10 minutes each. Finally, using the chemiluminescence reagent (ShareBio, SB-WB001), the immunoreactive bands were visualized with a ChemiDoc XRS Plus luminescent image analyzer (Bio Rad, England). The image analysis was performed using ImageJ software, and the relative expression levels of the target proteins to β-actin were used for statistical comparison.
2.11 Electrophysiology
Capture the mice to be tested and anesthetize with 0.3% sodium pentobarbital. Shave, disinfect the animal, and securely fixate it in a stereotaxic apparatus, maintaining body temperature with a heating pad. Perform a craniotomy to expose the M1 area of the motor cortex. Insert stimulation electrodes, guided by the stereotaxic device, to a depth of 700–1000 mm from the brain surface, targeting corticospinal neurons in the sensorimotor cortex. Position recording electrodes to penetrate the contralateral thigh’s sciatic nerve distal end to record muscle action potentials induced by electrical stimulation. Amplify and record bioelectrical signals using the BL-420F Biological Function Experiment System. Stimulation parameters are as follows: stimulation type: micro-voltage, mode: single pulse; delay 100 ms; frequency 100 Hz, stimulation intensity: 14V.
2.12 BMS score evaluation, LSS swimming
The recovery of hindlimb motor function in SCI (Spinal Cord Injury) mice is evaluated using the Basso Mouse Scale (BMS) scoring system (24). Assessments are conducted pre-injury and on days 1, 3, 7, 14, and 28 post-injury. The BMS score ranges from 0 to 9, with 0 indicating complete paralysis and 9 indicating normal hindlimb motor function. Before each scoring session, mice are placed on the testing platform in advance to acclimate to the environment. Each mouse is observed for a duration of 4 minutes.
Mice underwent three consecutive days of swimming training in a 5 x 15 cm water tank, moving from one side to the other. Surgery was performed after the completion of training. On postoperative day 28, mice were placed in the same water tank and observed for 30 seconds. The Louisville Swim Scale (LSS) was used to evaluate the swimming abilities of the mice, including assessments of hindlimb movement, hindlimb alternation, forelimb reliance, trunk stability, and body angle (25).
All experiments were conducted with the mice being randomly assigned by two trained observers blinded to the group allocations. Both observers simultaneously observed and recorded the mice's BMS scores, LSS scores. The final score was determined as the average of the scores given by the two observers.
2.13 Cell Lateral Migration Assay
Firstly, use Mark pen to draw lines on the backside of a six-well plate to determine the scratch positions. Seed bEnd.3 cells in the six-well plate, with approximately 200,000 cells per well. Allow the cells to grow and fully cover the surface of the six-well plate, then replace the medium with serum-free culture medium for 6 hours to induce starvation. Use a 200µl pipette tip, held perpendicular to the cell surface, to draw lines according to the positions marked by the marker pen. Subsequently, wash away the detached cells with PBS, followed by replacing the culture medium with fresh serum-free medium. Incubate the cells in a constant-temperature CO2 incubator at 37°C for 12 hours. Use an optical microscope to observe cell migration at 0 and 24 hours at the scratch site and calculate the migration distance using Image J software.
2.14 Tube formation assay
When bEnd.3 cells reach approximately 85% confluence, the serum-containing medium is replaced with serum-free medium to induce cell starvation for 5 hours. Subsequently, after removing the medium and digesting with trypsin, cells are centrifuged at 1000 rpm for 5 minutes. The experimental and control groups of bEnd.3 cells are adjusted to a concentration of 80,000 cells/ml using serum-containing culture medium based on cell counting. Pre-cooled pipette tips are used to evenly coat a 96-well plate with Matrigel matrix gel at 100 µl per well, and the plate is then incubated in a constant-temperature incubator for 30 minutes. Once the matrix gel solidifies, 500 µl of cell suspension is added to each well of a 24-well plate and incubated in a constant-temperature incubator for 6 hours. The formation of capillary-like structures by the cells is observed using an optical microscope, and Image J software is employed for quantitative analysis of the tube formation.
2.15 Bioinformatic analysis of the single-cell transcriptomic dataset
The single-cell RNA sequencing data of the contusive mouse spinal cord injury (GSE162610) and the information on the corresponding annotation were retrieved from the GEO database [doi: 10.1084/jem.20210040.]. Data processing and analysis were performed using the R package "Seurat" [doi: 10.1038/nbt.3192.]. The genes expressed in less than 10 cells were excluded. The gene expression matrix was normalized and scaled. We selected the top 20 principal components by performing PCA based on 3,000 variable genes. The FindNeighbors and FindClusters functions were used to cluster cells on a shared-nearest-neighbor graph. We visualized the expression level of interested genes using violin plots. The single-nucleus RNA sequencing data of the human adult spinal cord from seven donors (GSE190442) were also obtained and underwent consistent analysis workflow. [doi: 10.1016/j.neuron.2023.01.007.].
2.16 Statistical analysis
The statistical analysis of the results was performed using GraphPad Prism (version 7.0, USA). All data were reported as mean ± standard deviation (SD). Normality was determined using the Shapiro-Wilk test. For group number = 2, the homogeneity of variances was tested using the F-test. When the data followed a normal distribution and homogeneity of variance, an unpaired t test was conducted for the statistical analysis. For group number > 2, the homogeneity of variances was tested using the Brown-Forsythe test. When the data followed a normal distribution and homogeneity of variance, an ordinary one-way ANOVA and Tukey's multiple comparisons test were performed for the statistical analysis. Two-way ANOVA was utilized for data with two variables, grouping and time.
All differences among and between groups were considered statistically significant at p < 0.05. In the figures, ns denotes p ≥ 0.05, ∗ denotes p < 0.05, ∗∗ denotes p < 0.01, ∗∗∗ denotes p < 0.001, and ∗∗∗∗ denotes p < 0.0001.