There has been a notable surge in energy demand within the building sector of developing nations, particularly in the context of space cooling and heating, which constitute significant portions of energy consumption. The thermal performance of a building's roof slab plays a crucial role in determining these heating and cooling requirements. To address this, the utilization of Phase Change Material (PCM) to enhance the building's thermal energy storage capacity has emerged as an innovative strategy for reducing energy demand. This study assesses the thermal behavior of a building envelope integrated with macroencapsulated PCM in a real subtropical environment. Experimental setups include both a conventional slab unit (Ref–SU) devoid of PCM and a PCM (OM37) integrated slab unit (Exp–SU). Analysis entails examining variations in temperature, heat flow, thermal loadings, and maximum heat gain reduction. Economic metrics, such as electricity savings, simple payback periods, and CO2 emissions savings, are also scrutinized. The investigation aims to elucidate the efficacy and underlying parameters governing the PCM's performance in reducing thermal loads in the Indian city of Rupnagar. Findings indicate that the Exp–SU configuration reduces indoor temperatures by 4.0°C during sunny hours, resulting in 33.33% more electricity savings for space cooling compared to heating, with a simple payback period of 5.7 years. Additionally, the heat flux in Exp–SU is reduced by 60.6% compared to Ref–SU and thermal load by up to 49.8%. Furthermore, Exp–SU achieves a 44.24% reduction in CO2 emissions for space cooling compared to heating with a maximum heat gain reduction of 40.3%.
Research Article
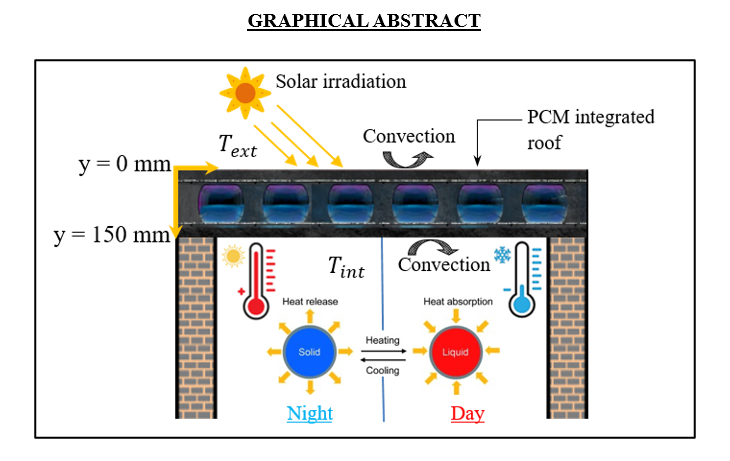
Comprehensive Assessment of PCM Integrated Roof for Passive Building Design: A Study in Energo-Economics
https://doi.org/10.21203/rs.3.rs-4086787/v1
This work is licensed under a CC BY 4.0 License
Version 1
posted
You are reading this latest preprint version
Phase change materials (PCMs)
thermal comfort
energy savings
thermal load
carbon emission savings
space heating/cooling.
The escalating environmental concerns stemming from energy utilization have garnered increasing attention. As per the data furnished by the International Energy Agency (IEA), primary energy production has witnessed a surge of 49%, coupled with a 43% increase in CO2 emissions over the preceding two decades. Presently, buildings consume a substantial portion, ranging between 30–40%, of the global primary energy output, with a significant chunk attributed to Heating, Ventilation, and Air Conditioning (HVAC) systems[1]. Cooling energy use in buildings has doubled since 2000, from 3.6 EJ to 7 EJ, making it the fastest-growing end-use energy in buildings, led by a combination of warmer temperatures and increased activity due to population and economic growth. If this trend goes on, then more than 50% of the total energy consumed in the buildings will be used for space cooling and heating up to 2050 [2]. Hence, there exists a pressing need to curtail HVAC loads within structures. In India's building sector, cooling energy consumption currently stands at 38%, projected to rise to 50% by 2027 [3]. To mitigate this escalating energy demand and conserve fossil fuels, there is a pressing need to reduce building energy demands. Various strategies such as passive building design, integration of renewable energy sources, implementation of thermal insulation, and adoption of energy storage systems offer viable solutions to achieve energy demand reduction[4]. In contemporary building design, phase change materials (PCMs) have emerged as promising solutions for energy storage, owing to their exceptional thermal properties[5]. Thermal energy storage systems play a crucial role in improving building thermal performance and reducing energy consumption. Latent heat storage, in particular, has garnered attention due to its high energy storage density and minimal temperature fluctuations [5–7].
PCMs are typically categorized into three groups based on their material composition: organic, inorganic, and eutectic variants. Organic PCMs are commonly favored due to their extended lifespan, structural integrity, and uniform melting behavior [9]. However, the inherent low thermal conductivity of PCMs, particularly organic PCMs, limits their ability to respond quickly to thermal fluctuations during charge and discharge cycles. This also reduces their storage capacity [10]. Hydrocarbon-based PCMs have relatively low thermal conductivity, typically falling in the range of 0.1 to 0.4 W/m K. For example, N-octadecane has a lower thermal conductivity in its solid state (0.35 W/m K) compared to its liquid state (0.149 W/m K) [11]. The incorporation of nanoparticles, metal foam, and fins into PCMs has been shown to improve their thermal conductivity [12]–[15].PCMs are commonly integrated into building components such as walls, roofs, floors, and ceilings to reduce space cooling and heating demands, mitigate thermal peak loads, regulate local temperatures within building components, or enhance overall system durability [9–11]. Three primary methods of integrating PCMs into building components include direct integration, immersion, and encapsulation. However, direct integration and immersion techniques may lead to interactions between PCMs and building materials, resulting in undesirable changes in the material matrix over time [19]–[20]. Encapsulation of PCM before incorporation is an alternate method to avoid direct exposure of building materials to PCM. There are three primary forms of encapsulation: nano-, micro-, and macro-encapsulation. Studies have used PCMs in building envelope applications. These include the incorporation of PCMs in cement mortar and concrete mixes (e.g. [21]–22]), wallboards for interior and exterior surfaces (e.g. [23], and plaster and board materials (e.g. [24–[25]). Microencapsulated PCMs have been widely studied for their potential applications in building envelopes [26], but their development requires specific techniques and methods (e.g. [27]–[28]). On the other hand, macroencapsulated PCMs offer improved strength and durability, provide a convenient approach for preparing PCMs, and enable a higher quantity of PCM to be incorporated into the building envelope, resulting in an improved encapsulation ratio [29]. Several studies have explored the use of macroencapsulated PCMs in building envelopes, focusing on various applications, including clay brick walls (e.g. [19–20], [16]), wall tiles (e.g. [23], [32]), concrete slabs (e.g. [33]–[35]), and concrete blocks (e.g. [36]).
However, very limited researchers have delved into the heat transfer dynamics of roofs enhanced with PCMs. Pasupathy et al. [37] conducted an investigation into the thermal performance of an existing PCM-integrated roof through experimentation and semi-implicit control volume model simulation in Chennai, India. Their findings suggested that a two-layer PCM configuration was better suited for the region's year-round climate conditions. Alawadhi [38] employed a three-dimensional finite element model to analyze building roofs featuring conical holes containing PCMs. Compared to conventional concrete slabs, these PCM-infused roofs exhibited a 39% reduction in heat flux on the internal surface. Navarro [39] proposed a novel design incorporating prefabricated concrete slabs with PCM macroencapsulated in small tubes and inserted into hollows, resulting in improved thermal inertia and heat storage capacity. Myriam et al. [40] investigated the impact of varying amounts of microencapsulated PCMs on the performance of textile-reinforced concrete panels. Their results indicated a decrease in peak temperature of the internal surface by 1.7°C, with peak shifts of approximately 2 hours for panels containing TRC-15% PCMs. Bhamare et al. [41] investigated the thermal properties of roofs with PCM layers at various inclination angles using a numerical model. They determined that a 2° inclination angle for the PCM layer yielded optimal results, with reductions in ceiling temperature of up to 2.38°C and daily heat gain reduced by up to 16% compared to non-PCM rooms.
Kim et al. [42] used PCMs with carbonised rice husks to lower roof surface and interior temperatures. Compared to roofs without PCMs, the combination reduced surface temperature to 74.6°C, with a maximum difference of 11°C. Meng et al. [43] investigated the thermal characteristics of PCM foamed cement roofs and showed it to be efficient in reducing internal surface temperature and indoor heat gain. In a recent study, Yasiri and Szabó[44] examined the thermal behaviour of roofs and walls integrated with PCM for severe hot summer conditions. The study found that the PCM performed better with the roof, accounting for about 40% of the energy-saving potential.
The abovementioned literature concerns the utilization of PCMs within lightweight building envelopes indicating that PCMs have the potential to augment the thermal capacitance of structures, thereby mitigating the energy consumption associated with heating and cooling systems. Nevertheless, despite existing research endeavors, several unresolved issues necessitate further investigation and deliberation. Particularly, a notable gap persists in the literature concerning empirical investigations conducted under extreme hot climatic conditions. The thermal energy storage performance of an RCC roof slab integrated with macroencapsulated PCM metal void formers has never been explored experimentally or numerically. In this way, PCM integrated biaxial voided roof slab can effectively be employed for the passive cooling of buildings by employing void formers as PCM macroencapsulations. The current study is unique in the following aspects: PCM leakage has been completely prevented using a metal void former; PCM macroencapsulations are embedded in two directions within the concrete matrix; and a new PCM encapsulation typology has been introduced. In This study thermal energy storage performance of the roof slab is evaluated under ambient conditions and compared with a normal RCC roof slab. The PCM-integrated voided roof functions as an envelope system aimed at bolstering thermal efficiency by mitigating heat influx into indoor spaces. Investigation into the thermal behavior of the PCM slab element was conducted amidst peak summer conditions in Rupnagar, India. the thermal storage performance measures including temperature profiles, heat flux, thermal loads, electricity cost reductions, payback periods, and CO2 emissions reductions were evaluated. This research serves to advocate for the adoption of such roofing structures in practical settings, thus facilitating the design of low-carbon building envelopes, which hold significant importance in sustainable architectural endeavors.
2.1. Selection of PCM
The working of PCM is influenced by temperature fluctuations in the surrounding environment. In general, a PCM functions by absorbing heat during sunny hours as the material changes from solid to liquid and releasing it during non-sunny hours when the material changes from liquid to solid. Thus, regular charging (solid–liquid transition) and discharging (liquid–solid transition) of PCM is essential for the effective thermal performance of the building envelope where PCM is employed. Selecting a suitable PCM is critical to ensure the daily charging and discharging of PCMs. This is accomplished by a procedure referred to as PCM mapping and benchmarking. The procedure considers the characteristics of PCMs, including their thermophysical properties, thermal cycle stability, environmental conditions, and heat transfer capabilities [45]–[46]. The daily charging and discharging of PCMs are influenced by two factors: the inherent thermophysical properties of the PCM and the localized temperature variations. Local temperature variations are influenced by multiple climatic factors, such as temperature, wind velocity, air humidity, sky condition, precipitation, and solar radiation [47]. Considering the significant variations in local climatic conditions and the limited operating temperature range of PCM, it is necessary to determine the desired melting point of a PCM based on the specific local climate. Rupnagar in India has been selected as the study area in this work. Rupnagar is situated at coordinates 30.9661°N and 76.5231°E, with an average elevation of 260 m above mean sea level. Rupnagar is known to have a humid subtropical climate with dry winters. The mean daily maximum and minimum temperatures were obtained from meteorological data [48] and are presented in Fig. 1. May and June are considered the warmest, while December and January are the coldest. The temperature range in the city can vary, with summer temperatures reaching a maximum of 47°C and winter temperatures dropping to a minimum of 0°C. Particularly during summer, the building experiences a significant variation in temperature. The average temperature ranges from 43°C during the day to 27°C at night. Moreover, the annual average solar radiation for Rupnagar city is 5.22 kWh/m2/day.
Note that Fig. 1 indicates having a PCM with a melting temperature close to the thermal comfort temperature of 26°C may not be appropriate. This is because Rupnagar experiences a mean temperature well above the comfort temperature during summer. Moreover, to maximize daily charging and discharging potential, it is essential to ensure that its phase change temperature falls within the maximum and minimum temperatures range. The PCM may not function as a latent heat thermal energy storage system if this condition is not ensured. It is worth pointing out that passive techniques primarily focus on managing temperature variation up to a specific threshold. Active cooling or heating is required if the interior temperature exceeds this level. In this study, a commercially available organic PCM, namely OM37, is selected. This PCM is non-paraffin based and has a transition temperature of 37°C. Table 1 lists the thermophysical characteristics of OM37, as provided by the supplier. A numerical study [45] also indicated a PCM melting temperature of around 34°C for a study area with similar climatic conditions. The absence of established PCM characterization standards has led to inconsistent reporting of PCM properties in literature [49]. Hence, PCM characterization was conducted to estimate its thermophysical properties at room temperature.
| PCM | Melting/ Freezing Temp (°C) | Latent heat (kJ/kg) | Liquid/Solid Density (kg/m3) | Liquid/Solid Specific Heat (kJ/kgK) | Thermal Conductivity, liquid/solid (W/mK) |
|---|---|---|---|---|---|
| OM37 | 37/36 | 179 | 860/973 | 2.63/2.55 | 0.13/0.16 |
2.2. Thermal behaviour
Thermal behavior analysis of OM37, encompassing its melting, crystallization, and heat storage properties, was conducted using Differential Scanning Calorimetry (DSC). A DSC NETZSCH (Model: STA 449 F1 Jupiter), boasting ± 2% precision and 0.001°C temperature resolution, is employed for analysis. Three PCM samples weighing 5 mg each are subjected to DSC testing. The experimentation entails a ramp rate of 1°C/min, covering a temperature span from 25°C to 60°C. A consistent flow of pure nitrogen at a rate of 50 ml/min is maintained throughout the experiment. Melted PCM is put inside Tzero pans with lids. They were weighed on a semi-micro balance with a 0.1 mg precision (GR-202, A&D, Japan). The DSC thermograms of OM37 is presented in Fig. 2, respectively. Samples 1, 2, and 3 initiated solidifications at 35.99°C, 35.29°C, and 36.16°C, reaching peak temperatures at 33.99°C, 33.29°C, and 34.16°C, and completing solidification at 30.16°C, 30.29°C, and 30.16°C, respectively. Conversely, the samples exhibit melting onset temperatures of 36.08°C, 37.07°C, and 36.03°C, respectively, with corresponding peak temperatures at 40.08°C, 40.07°C, and 40.03°C. The completion of melting occurred at 44.08°C, 44.07°C, and 44.03°C, respectively. The average melting temperature of OM37 deviated by approximately 10% from the manufacturer's specified value, falling within acceptable limits. The average super-cooling temperature observed is 6.2°C. Additionally, the phase change enthalpy, indicative of PCM efficiency, is quantified, with Table 2 presenting the melting and solidification enthalpies. The mean enthalpies for melting and solidification are 189.2 kJ/kg and 158.62 kJ/kg, respectively, resulting in an average latent heat capacity of 173.91 kJ/kg. Notably, the measured latent heat capacity in this study varies approximately 2.8% corresponding to the manufacturer's reported value of 179 kJ/kg. It is important to highlight the significance of the long-term thermal stability of PCM, which can be affected by factors such as moisture absorption and chemical degradation. In this study, OM37 is macroencapsulated within an aluminum container, a measure intended to mitigate thermal stability degradation potentially caused by moisture intervention. Furthermore, it has been reported that OM37 exhibits minimal changes in its melting, solidification, and associated enthalpies even after undergoing 2000 cycles [50].
| OM37 | Melting cycle | Solidification cycle | ||
|---|---|---|---|---|
| Melting temperature (oC) | Melting enthalpy (Jg− 1) | Solidification temperature (oC) | Solidification enthalpy (Jg− 1) | |
| Sample 1 | 40.08 | 190.2 | 33.99 | 150.06 |
| Sample 2 | 40.07 | 188.4 | 33.29 | 180.0 |
| Sample 3 | 40.03 | 189.0 | 34.64 | 145.8 |
| Avg. | 40.06 | 189.2 | 33.81 | 158.62 |
2.3. PCM Encapsulation
Aluminium is selected as the void former material in this study because of its higher thermal conductivity and easy availability. An aluminum alloy, Al 1100, conforming to ASTM-B-209, is used. This alloy has a density of 2710 kg/m3, melting temperature range of 643–657.2°C, yield strength of 70 MPa, ultimate strength of 110 MPa, modulus of elasticity of 68.9 GPa, and 12% elongation at break. Note that the thermal and mechanical properties of Al 1100 are listed in Table 3. Aluminium containers are widely used to encapsulate PCM in building envelopes because of their high thermal conductivity and compatibility with various PCMs (e.g. [51]–[55]). Some studies (e.g., [56–57]) suggest that aluminum may corrode when embedded in concrete during the initial days when the concrete is highly alkaline. However, under favourable conditions, aluminium is compatible with alkaline building materials in concrete [58]. Nevertheless, research on aluminum corrosion in concrete is ongoing, and there are still significant knowledge gaps in this area [59]. It is important to note that phase transition in PCM can cause a volume change, which, if it occurs rapidly, may deform the void former. The chosen material fulfilled this requirement due to its higher strength.
| Thermal Conductivity(W/mK) | Thermal Expansion (K-1) | Specific heat capacity (J/kg K) | Coefficient of thermal expansion (µm/m K) | Modulus of Elasticity (GPa) | Fatigue strength (MPa) |
|---|---|---|---|---|---|
| 222 | 24×10− 6 | 904 | 23.6 | 68.9 | 34.5 |
The void former developed in this study using Al 1100 is shown in Fig. 3(a) to 3(c). It has a symmetrical geometry and features a truncated spherical segment at either end and a cylindrical section in the middle. The cylindrical part is 150 mm in diameter and 60 mm high. The spherical section has a radius of 75 mm, while the flat section has a diameter of 50 mm. The void former's two parts (Ref. Figure 3(a)) are manufactured through cold forging using a 1.3 mm thick Al 1100 sheet. Then the parts are joined to form a single unit. The void former design includes a hybrid structure of shell and cylinder geometries, thus can enhance the melting and solidification process of PCM.
2.4. Experimental procedure
The structural configuration of a biaxial voided slab can be perceived as a series of repeated single voided segments arranged both longitudinally and transversely. The term "unit cell" is commonly used to refer to a single segment. A unit cell can be employed to investigate the thermal performance of the biaxial voided slab. In this study, experiments are conducted using a unit cell. Figure 4 shows a unit cell schematic. As considered here, the unit cell is a voided slab segment of 300 mm length, 300 mm width, and 150 mm depth, with one OM37-filledaluminum void former. The unit cell has two square mesh reinforcements of 10 mm diameter steel bars. Thus, notionally, the core region of a biaxial voided slab comprises horizontally stacked unit cells in both directions. The unit cell emulates the thermal behavior of a voided slab during one-dimensional heat transfer. The unit cell models have achieved widespread success due to economic considerations. Nevertheless, it is imperative to acknowledge that the unit cell does not accurately represent the mechanical loading conditions. Since the primary objective of this study is to investigate the thermal performance rather than the impact of mechanical loading conditions, it is reasonable to adopt the unit cell approach. The following content explains the unit cell casting procedure.
A schematic of the unit cell casting procedure is shown in Fig. 5(a) to 5(f). Two wooden moulds, each measuring 300×300×150 mm, are fabricated to cast two distinct testing specimens: a normal RCC (Ref–SU) and an RCC integrated with a PCM macroencapsulated void former (Exp–SU). The conventional procedure is adopted for casting the normal RCC specimen. The procedure involves mixing various ingredients, namely cement, fine aggregate, coarse aggregate, and water, following M20 proportions (1:1.8:3.1:0.5). Subsequently, the freshly prepared concrete mixture is incrementally poured into the wooden mould, ensuring appropriate compaction at each stage. Regarding the casting of the PCM integrated specimen, the concrete mix is poured up to the level of the bottom reinforcement mesh. Then, a macroencapsulated PCM void former is secured horizontally using a spirit level, followed by concreting to its full depth. The next step involves the placement of the top reinforcement mesh, followed by additional concreting up to the top of wooden mould. Finally, the specimens are removed from the wooden moulds after 24 hr and then moisture cured for 28 days.
After 28 days of curing, the specimens are transferred to another wooden mould measuring 1380×540×175 mm. Here, the specimens are carefully packed in the mould using layers of extruded polystyrene and glass wool fibers to prevent heat transfer from all sides except the top. To measure temperature profiles, nine K-type thermocouples are attached to the specimens. Three are placed in a triangle formation at the bottom surface of the biaxial voided slab unit, directly below the void former. Two thermocouples are placed one each on the top and bottom surfaces outside the void former region. Further, one thermocouple each is placed on the normal RCC unit's top and bottom surfaces. The thermocouples used in the experiment have been previously calibrated in the lab using ice and boiling water, with a temperature accuracy of ± 0.1°C. The experiment assumes heat transfer in a one-dimensional direction: starting from the top layer of concrete and reinforcement mesh, then through the void former material, air gap, PCM, bottom void former material, reinforcement mesh, and bottom concrete layer. The one-dimensional heat transfer assumption is reasonable because the unit cell is insulated on all sides except the top using extruded polystyrene layers and glass wool fibers. A 16-channel data logger with automatic recording capability is utilized to store temperature data at one-minute intervals. Figure 6 displays the experimental setup and schematic. The entire setup is directly and continuously exposed to the outdoor environment on all days.
2.5. Parameter estimation
2.5.1. Heat transfer
Heat transfer to the interior is an important factor in determining a building's resistance 10 to thermal energy transfer from the exterior environment. It is imperative to underscore that a thorough analysis of heat transfer is pivotal for precisely estimating cooling energy needs and appropriately sizing cooling systems within buildings. The examination of heat transmission through unit cells, including conventional concrete and concrete integrated with PCM, is conducted using the Fourier law. The heat transfer computation is expressed by Eq. (1):
$$Q = {K_{eff}}A\left( {{T_{ext}} - {T_{\operatorname{int} }}} \right)$$
1
Where A is the area over which heat flow occurs (m2), \({T_{ext}}\) and \({T_{\operatorname{int} }}\) is are the respective inner and exterior temperatures of the surfaces (oC). The K values of all the layers are then combined to obtain the effective thermal conductivity \({K_{eff}}\). The thermal resistance network for the concrete with PCM inclusion is computed using the following equation, Eq. (2):
$$\frac{1}{{{K_{eff}}}} = \frac{1}{{{h_{ext}}}}+2 \times \frac{{{\delta _{cc}}}}{{{k_{cc}}}}+2 \times \frac{{{\delta _{Al}}}}{{{k_{Al}}}}+\frac{{{\delta _{Air}}}}{{{k_{Air}}}}+\frac{{{\delta _{PCM}}}}{{{k_{PCM}}}}+\frac{1}{{{h_{\operatorname{int} }}}}$$
2
where \({k_{cc}}\), \({k_{Al}}\), \({k_{Air}}\), and \({k_{PCM}}\)denote the thermal conductivities of concrete, aluminium (= 222W/mK), air (= 0.275 W/mK), and PCM (= 0.2 W/mK), respectively, while \({\delta _{cc}}\), \({\delta _{Al}}\), \({\delta _{Air}}\), \({\delta _{PCM}}\)represent their corresponding thicknesses. \({h_{ext}}\)and \({h_{\operatorname{int} }}\) denote the outer and inner convective surface coefficients (W/m2.oC).
2.5.2. Electricity cost savings
The integration of PCM into biaxial voided slabs has the potential to reduce electricity usage and provide cost savings for residential customers. Additionally, it allows for peak load shifting, energy conservation, and a decrease in peak demand for network line companies. Moreover, evaluating the potential cost savings in electricity is an important economic indicator to determine the viability of the proposed technology. This study estimates electricity cost savings by considering the reduction in peak heat flux resulting from the integration of PCM into the voided slab. Heat flux refers to the rate of heat transfer per unit area of a surface. The thermal performance of a building envelope is affected by heat flux, which has an impact on heating and cooling demands. The difference in peak heat fluxes between the Ref–SU and the Exp–SU represents a reduction in peak heat flux. Daily cost savings during peak loads can be approximated using the formula given in Eq. (2) [51]:
$${E_{cs}} = HG{R_{\hbox{max} }} \times {U_{PE}} \times 24hrs$$
3
Note that Eq. (3) is derived under the assumption that radiation losses can be considered negligible. Further, the peak heat flux value indicates the peak cooling load for both slabs. The unit price of electricity (\({U_{PE}}\))varies based on the region. Cost savings can be estimated by substituting the values of peak heat flux evaluated in Section 2.5.1 and the unit price of electricity into Eq. (3).
2.5.3. CO2 Emission Savings
The predominant source of global electricity generation is dependent on the combustion of fossil fuels such as coal, natural gas, and oil. It can be posited that the conservation of electricity is intricately connected to the preservation of fossil fuels. Consequently, the anticipated reductions in electricity consumption achieved through the utilization of biaxial voided slabs can be directly correlated with diminished utilization of fossil fuels. This leads to a reduction in carbon emissions released into the atmosphere during the electricity production phase. Such conservation efforts have the potential to mitigate the risks associated with global warming and climate change. A conventional approach for estimating the reduction in carbon dioxide (CO2) emissions resulting from electricity consumption is outlined in reference [60]. CO2 emissions savings from electricity consumption can be evaluated as:
$${C_s} = {E_f}+{E_{cs}}$$
4
Where \({C_s}\) is CO2 emissions savings (KgCO2), \({E_f}\)represents CO2 emission factor (KgCO2/kWh), and \({E_{cs}}\) represents electricity power savings (kWh).
In Eq. 4, \({E}_{f}\) serves as a crucial metric for quantifying the carbon released into the atmosphere per unit of electricity delivered. In the context of an individual power generation plant, this factor can be directly derived by analyzing the plant's fuel consumption and power output. However, in a multiplant generation system supplying electricity through a shared grid, the carbon emissions are dependent on the operational status of various generation plants at any given time [60]–[61]. Consequently, a 'weighted average' emission factor is commonly utilized to estimate \({E}_{f}\). This factor represents the average CO2 emitted per unit of electricity generated in the grid, calculated by dividing the total CO2 emissions from all power stations by the total net generation. Notably, the net generation includes contributions from low-cost/must-run sources, such as hydroelectric and nuclear power stations in the Indian context. The estimated weighted average \({E}_{f}\) values for fossil fuel-fired power stations in the fiscal year 2021–22 are as follows: 1.19 for coal, 1.32 for lignite, 0.42 for natural gas, 0.59 for diesel, and 0.61 for naphtha. It is important to consider only those gas-fired power stations relying exclusively on natural gas when estimating \({E}_{f}\) for such stations [62]. By substituting the electricity unit savings into Eq. 4 and using the appropriate weighted average values of \({E}_{f}\) for different fuel types, the potential CO2 emissions savings resulting from the utilization of biaxial voided slabs can be calculated.
The outdoor experiments are conducted from June 01 to June 10. The temperature data is recorded using J-type thermocouples. Note that \({T}_{amb}\) represents the ambient temperature (°C).\({T}_{ext}\) refers to the temperature at the exterior surface of the specimen (°C), \({T}_{int, Ref}\) indicates the interior temperature of the normal RCC unit (°C), \({T}_{int, Exp}\) represents the interior surface temperature of the PCM integrated biaxial void slab unit (°C), respectively.
3.1. Temperature Reduction
Figure 7 compares temperature profiles of \({T_{ext}}\), \({T_{\operatorname{int} , \operatorname{Re} f}}\), \({T_{\operatorname{int} , Exp}}\), \({T_{amb}}\)and from June 01 to June10. The figure also includes the corresponding variation in solar radiation. As observed, on several days, \({T_{ext}}\)tends to be higher than \({T_{\operatorname{int} , Exp}}\) during the peak sunny hours, whereas it falls below \({T_{\operatorname{int} , Exp}}\)during non-sunny hours. This suggests a decrease in temperature during sunny hours, which can be attributed to the absorption of heat by PCM. On the contrary, it is observed that during non-sunny hours, there is an increase in temperature as the PCM releases the stored heat. Thus, macroencapsulated PCM offers valuable thermal regulation to the roof, which is an essential consideration in ensuring the thermal comfort of the occupants. It is worth mentioning that, on several days, PCM transitions from a solid to a liquid phase during the daytime and from a liquid to a solid phase during the nighttime. Therefore, it is evident that the biaxial voided slab unit can absorb thermal energy during the daytime and then release it during the nighttime.
During the testing period, a maximum temperature difference of 4°C is observed between \({T_{ext}}\) and \({T_{\operatorname{int} , Exp}}\)during the sunny hours specifically on June 07. Additionally, the mean temperature difference is observed to be 2.9°C. These observations indicate that deploying the biaxial voided slab unit reduced the interior temperature by a maximum of 4°C and an average reduction of 2.9°C. The reduction in temperature is caused by the PCM absorbing thermal energy as latent heat during its transition from a solid to a liquid state. The latent heat storage in PCM is intricately connected to its phase change characteristics. During melting, PCM endures a semi-transient state in regions undergoing the initial phase change. In this state, the PCM is neither fully solid nor liquid but rather mushy. As the heat influx rises, the liquid fraction within the mushy zone gradually increases until it transitions into a fully liquid state. According to Fig. 7, \({T_{\operatorname{int} , Exp}}\)consistently exceeds \({T_{\operatorname{int} , \operatorname{Re} f}}\)during non-sunny hours on multiple days. Although it indicates latent heat release into the interior, it is undesirable if the temperature exceeds the thermal comfort threshold. In such adverse situations, measures must be taken to discharge this heat into the atmosphere. \({T}_{int, Exp}\)is observed to be higher than \({T_{\operatorname{int} , \operatorname{Re} f}}\)by upto 1.7°C. This implies interior temperature rises by upto 1.7°C, which can be attributed to the release of stored heat by the Exp–SU.
A comparison of temperature differences between Exp–SU and Ref–SU testing units can also be observed in Fig. 8. During sunny hours, the temperature difference between \({T_{\operatorname{int} , Exp}}\) and \({T_{\operatorname{int} , \operatorname{Re} f}}\)can be noted to reach a maximum of 3.8°C. This implies that the Exp–SU results in a 3.8°C reduction in interior temperature compared to the Ref–SU. One notable thermal characteristic observed is the sustained increase in temperature in the Exp–SU compared to the Ref–SU. As shown in Fig. 8, the temperature in the Ref–SU rises relatively faster, typically peaking during the late afternoon hours. The temperature increases in the Exp–SU occurs over a more extended period, typically peaking well into the evening hours. This indicates that the Exp–SU also provides sustained thermal regulation and insulation to the interior throughout the phase transition. Note that sustained thermal energy changes are generally more favorable for thermal comfort than rapid changes, which the Exp–SU could provide. During the non-sunny hours, \({T_{\operatorname{int} , Exp}}\)is observed to be higher than \({T_{\operatorname{int} , \operatorname{Re} f}}\)by up to2.3°C. This implies interior temperature rises by up to2.3°C, which can be attributed to the release of stored heat by the Exp–SU. The increase in thermal energy within the interior generally provides thermal comfort to occupants and reduces the energy required for space heating.
3.2. Heat transfer
Figure 9 depicts the temporal distribution of heat flux(W/m2), for all specimens during the test period. Negative heat flux values in the plot indicate that the specimens are releasing heat, while positive heat flux values indicate heat absorption. All values in the early morning and late evening hours are almost temporally synchronous. This observation suggests that the thermal heat flux remains consistent during the specified hours of the day. However, heat flux profiles of Exp–SU(\({q_{Exp}}\)) deviate from the Ref–SU (\({q_{\operatorname{Re} f}}\))when they gain heat. This transition signifies enhanced heat storage capabilities of PCM specimen. The standard Ref–SU exhibits a significantly higher heat gain, up to 60.6%, compared to the Exp–SU, which experiences a corresponding 60.6% reduction in heat gain. This discrepancy in heat flux is ascribed to the thermal inertia of the PCM contained within the void former.
A daily heat flux profile reveals two distinct transition points. The first transition occurs as the ascending \({q_{Exp}}\) profile transitions from \({q_{\operatorname{Re} f}}\)during the early morning hours, with a transition heat flux value averaging about 1.8 W/m^2. The second transition occurs in the late afternoon hours as the descending \({q_{\operatorname{Re} f}}\)profile transitions from\({q_{Exp}}\), also within the same range of heat flux values. These transition points and their corresponding values signify the heat flux levels that trigger the phase change of the PCM, either from solid to liquid or from liquid to solid. Furthermore, it is noted that the \({q_{\operatorname{Re} f}}\)profile maintains a consistent slope at transition points, indicating a steady heat flux rate within the Ref–SU.
During periods of non-sunny, the heat flux within the Ref–SU (\({q_{\operatorname{Re} f}}\)) experiences a three-fold increase compared to\({q_{Exp}}\). Furthermore, during nighttime hours, \({q_{\operatorname{Re} f}}\) rises by up to 2.5 times more than \({q_{Exp}}\). It is also observed that \({q_{Exp}}\) maintains a daily average of -2.1 W/m2, while \({q_{\operatorname{Re} f}}\) exhibits a daily average of -6.7 W/m2, indicating a substantial 3.2-fold increase. Consequently, the utilization of macroencapsulated PCM within the Exp–SU leads to a notable reduction in heat release to the interior in comparison to the Ref–SU. Moreover, the Exp–SU demonstrates superior heat storage capacity relative to the Ref–SU, thereby mitigating cooling demands and discharge rates.
3.3. Maximum heat gain reduction
The calculation of the maximum heat gain reduction (\(HG{R_{\hbox{max} }}\)) involves assessing the maximum heat gain in each element of the PCM room and its corresponding element in the reference room. This is carried out according to Eq. (5) [63], as expressed below:
$$HG{R_{\hbox{max} }} = \frac{{H{G_{\operatorname{Re} f - SU}} - H{G_{Exp - SU}}}}{{H{G_{\operatorname{Re} f - SU}}}} \times 100\%$$
5
Figure 10 shows the \(HG{R_{\hbox{max} }}\) in each unit considering the heat gain of PCM and conventional slab units. In the context of \(HG{R_{\hbox{max} }}\)analysis, the PCM slab unit exhibited \(HG{R_{\hbox{max} }}\)values of 37.56% and 62.87%, respectively, during space cooling and space heating periods. However, in general, space cooling reductions are lower than space heating reductions. There is a reduction of approximately 40.3%. These observations are attributed to the enhanced latent heat storage capacity of the PCM favored by the local climactic conditions. The data indicates both units reduce the transfer of thermal energy from solar radiation on the roof's outer surface to the interior environment. Thus, using macroencapsulated PCM in the slab unit resulted in a notable reduction in heat gain to the interior compared to the conventional slab unit. Lower \(HG{R_{\hbox{max} }}\)values during space cooling indicate the release of significant heat to the interior, which is unfavorable. This percentage aligns realistically with findings from various locations worldwide. For example, a study conducted in the United States reported \({HGR}_{max}\) ranging from 3.5–47.2%, while under the climate conditions of Saudi Arabia, \(HG{R_{\hbox{max} }}\)reached up to 35%. Additionally, an optimization study for buildings incorporating insulation and PCM demonstrated a 33.5% \(HG{R_{\hbox{max} }}\) under the hot climate conditions of India.
3.4. Thermal loading
Based on heat flux estimates, cooling and heating thermal load through the testing units during the two testing periods can be calculated. To calculate thermal loads, the heat flux values are integrated over time:
$${q_d} = \int {\dot {q} dt}$$
6
where \(\dot {q}\)represents heat flux (W/m2) and \({q_d}\)represents thermal load (Wh/m2). Figure 11 illustrates the cooling and heating thermal load distribution between the two units. As observed, thermal inertia causes an increase in thermal load during sunny hours and decreases during non-sunny hours. The data indicates both units reduce the transfer of thermal energy from solar radiation on the roof's outer surface to the interior environment. The cooling load of the Exp–SU is approximately 49.8% lower than that of the Ref–SU. According to the data presented in Fig. 19, it is evident that the heating loads for the Exp–SU are considerably lower compared to the Ref–SU. Specifically, the heating loads for the Exp–SU are approximately 2.9 times lower. Additionally, for a given test period, the total thermal load in the Exp–SU is about 59.4% lower than that of the normal Ref–SU. These findings indicate using the macroencapsulated PCM integrated slab unit significantly improves comfort by reducing operative temperature and enhancing thermal load management. Further, Fig. 11 illustrates an apparent difference in cooling and heating loads in the same testing unit during a specific testing period. The thermal load difference in the Exp–SU is significantly smaller, with factor of 1.08 compared to 1.57 in the normal Ref–SU, during the testing period. The Exp–SU has lower factors than the Ref–SU, suggesting it experiences significantly reduced temperature fluctuations.
3.5. Electricity cost savings
Figure 12 shows the distribution of electricity cost savings for peak cooling and heating purposes during the test periods. Note that the cost savings estimates are based on the assumption that comparable electrical energy meets the energy needs for space cooling through air conditioning and space heating through heating systems. According to Fig. 12, the savings in space cooling are greater than in space heating. This is due to the ability of the PCM-integrated voided slab unit to store latent heat, thereby reducing indoor space cooling needs. The cost savings associated with using voided slab units for space heating appear to be smaller, possibly due to the impact of local climatic conditions. Passive houses are designed to have minimal heating requirements and a shorter heating period, so space heating may not be required. Therefore, their ability to adjust their space heating energy is limited to the coldest hours of the day rather than during transition period.
Table 4 summarizes the electricity cost savings over the test periods. The \({U_{PE}}\)is taken as USD 0.09/kWh. Daily savings on space cooling are significant, with a maximum of 0.04 USD/kWh/m2 and an average of 0.03. Space heating savings are slightly better, averaging 0.02 USD/kWh/m2, compared to 0.03 USD/kWh/m2. It is worth noting that significant peaks in space cooling savings (e.g. 0.0368 USD/kWh/m2) are observed on June2, especially on the day after less sunlight. Therefore, it is emphasized that weather conditions allowing complete discharge of PCM in the voided slab unit are beneficial for charging and result in improved cost savings.
| Testing period | Thermal cycle | Cost savings per day (USD/kWh/m2) | ||
| Maximum | Average | Minimum | ||
| 01–10 June | Cooling | 0.0368 | 0.0356 | 0.0338 |
| Heating | 0.0220 | 0.0190 | 0.0133 | |
3.6. Payback period
The cost payback period is another criterion commonly employed to assess the viability of an investment. Payback period is a metric used to determine the time it takes to recover the initial investment cost. Payback period in this study refers to the time required to recoup the initial investment cost of integrating macroencapsulated PCM in a roof. Recovery depends on the annual energy savings from reducing cooling and heating loads. The simple payback period is a commonly used method of calculating the time it takes to recover the initial investment cost through annual cost recovery. However, it is essential to note that this method fails to consider factors such as inflation, the time value of money, and uneven cash flows over time [77]. In the current study, the initial investment cost includes the aluminium void former and PCM costs. The price for one unit of void former is 170 Rupees/2 USD. Nine units are required to cover an area of one square meter, resulting in a total cost of 1530 Rupees/18 USD. OM37 costs 450 Rupees/Kg or 5.4 USD/Kg. Each void former is integrated with 600 g of PCM. Thus, the PCM cost per square meter is 2430 Rupees/29 USD. Hence, the total Annual cost recovery is affected by the amount of electricity saved, which depends on the thermal performance of the PCM throughout the year. Note that the daily average savings, including space heating and cooling, from April 15 to June 9 was 4.7 Rupees/day, as given in Table 6. The potential PCM working days can be estimated using the temperature profile of the study area, city of Rupnagar, as test results for an entire year are not available. According to the temperature profile (Ref. Figure 1), there are about 148 days with temperatures above 35°C, which suggests these days are suitable for PCM functioning. These days are 23 between March and April, 28 between April and May, 30 between May and June, 21 between June and July, 18 between July and August, 22 between August and September, and 6 between September and October. It is noteworthy that these 148 days are not in need of day space heating. To estimate the payback period, PCM is assumed to function for 148 days resulting in a daily average electricity savings of 4.7 Rupees. Thus, the simple payback period per square meter of roof area is estimated at 3960 Rupees/4.7×148 days, which is 5.7 years. This means initial investment cost in employing macroencapsulated PCM-integrated void formers in the roof can be recouped in about 5.7 years. Thus, it can be stated that the proposed PCM integrated biaxial voided roof is promising and commercially viable.
3.7. Carbon emissions savings
Figure 13 illustrates the fluctuation in CO2 emissions savings for space cooling throughout the testing period. It is evident that electricity generation from lignite results in the highest savings, whereas natural gas exhibits the lowest. This implies that utilizing PCM integrated voided slab technology can lead to CO2 emissions savings of up to 4.8 kgCO2/kWh for lignite-powered electricity generation plants and 1.5 kgCO2/kWh for those fuelled by natural gas. Coal-powered electricity generation plants demonstrate similar savings of 4.3 kgCO2/kWh, respectively.
Figure 13 also depicts the variation in CO2 emissions savings for space heating during the testing period. The trends in savings for space heating align with those observed for space cooling. However, in general, space heating savings are comparatively lower than space cooling savings. Notably, there is a reduction of approximately 44.24% during the period. In the Indian context, space heating demands are relatively minor compared to space cooling, and with the increasing effects of global warming, it is expected that space heating requirements will further diminish. The implications of CO2 emissions savings include the reduction of direct emissions from fossil fuel combustion or consumption, indirect emissions from electricity generation, and the mitigation of global warming and climate change by controlling carbon emission intensity.
The cumulative carbon emissions (\({C_s}\)) for space cooling utilizing various fuels are calculated to be 14.94 kgCO2/kWh, respectively. Correspondingly, the calculated values for space heating are 8.33 kgCO2/kWh. It is discernible that under the prevailing weather conditions, space heating offers a notably higher total CO2 emissions savings compared to space cooling. The regulation of carbon emissions plays a critical role in mitigating global warming and climate change by curbing emissions stemming from fossil fuel combustion and power generation. Consequently, the utilization of HRS macroencapsulated with PCM facilitates increased CO2 emission savings.
This study assesses the energy utilization and thermal comfort within a building and its slab units. PCM, a contemporary material designed as a substitute for traditional thermal mass, is utilized in this investigation. The building envelope is recognized for its significant impact on energy consumption and indoor comfort levels. Two slab units, one incorporating PCM and the other serving as a reference, were constructed and subjected to testing during peak temperature periods. PCM integration into the voided roof slab is achieved through macroencapsulation within a metal void former. Various performance metrics related to thermal energy storage, including temperature profiles, heat flux, thermal loads, electricity cost savings, payback periods, and CO2 emissions reductions, are assessed. The study yields several notable conclusions, outlined as follows:
-
The incorporation of PCM significantly augmented the thermal performance of the PCM room in contrast to the reference room during periods of high temperatures.
-
PCM integrated biaxial voided roof slab unit reduced interior temperatures by up to 4°C in sunny conditions, but showed a moderate increase of up to 1.7°Cduring non-sunny hours.
-
Comparative analysis revealed a remarkable reduction of up to 60.6% in heat transfer to the interior for the PCM integrated biaxial voided roof slab unit compared to the conventional RCC unit.
-
Throughout the test duration, the thermal load in the PCM integrated voided slab unit was approximately 54% lower than in the conventional RCC unit.
-
The maximum daily savings in cooling electricity costs were 3.98 Rupees/kWh/m2, with an average daily saving of 4.70 Rupees/kWh/m2 considering both heating and cooling. The projected payback period is around 5.7 years.
-
The PCM integrated voided slab unit also reduces CO2 emissions by up to 13.7, 12.3, and 4.3 kgCO2/kWh for lignite, coal, and natural gas-powered plants, respectively.
HVAC Heating, ventilation, and air conditioning
DSC Differential Scanning Calorimetry
PCM Phase change material
Ref–SU Conventional slab unit
Exp–SU PCM slab unit
Greek symbols
δ Thickness, mm
ρ Density, kg/m3
Nomenclature

Author Contribution
Peerzada Jaffar Abass: Methodology, Software, Formal analysis, Investigation, Visualization, Writing - original draft preparation, Writing - Review & EditingS. Muthulingam: Methodology, Conceptualization, Supervision, Funding acquisition
Credit authorship contribution statement
Peerzada Jaffar Abass: Methodology, Software, Formal analysis, Investigation, Visualization, Writing - original draft preparation, Writing - Review & Editing
S. Muthulingam: Methodology, Conceptualization, Supervision, Funding acquisition
- Pérez-Lombard L, Ortiz J, Pout C (2008) A review on buildings energy consumption information. Energy Build 40(3):394–398. https://doi.org/10.1016/j.enbuild.2007.03.007
- International Energy Agency (IEA) (2018) The Future of Cooling: Opportunities for Energy-Efficient Air Conditioning. International Energy Agency, Paris, France, p 92
- Kumar S, Kachhawa S, Goenka A, Kasamsetty S, George G (2018) Demand analysis for cooling by sector in India in 2027, Bur. Energy Effic. Minist. Power, Govt. India, no. June, p. Alliance for an Energy Efficient Economy
- Liu L, Hammami N, Trovalet L, Bigot D, Habas J-P, Malet-Damour B (2022) Description of phase change materials (PCMs) used in buildings under various climates: A review. J Energy Storage 56:105760. https://doi.org/10.1016/j.est.2022.105760
- Chen X, Guo X, Lin X, Fan M, Sun W (2022) pH-responsive wood-based phase change material for thermal energy storage building material application. J Mater Sci 57(28):13515–13526. 10.1007/s10853-022-07474-4
- Sun X, Zhang Y, Xie K, Medina MA (2022) A parametric study on the thermal response of a building wall with a phase change material (PCM) layer for passive space cooling. J Energy Storage 47:103548. https://doi.org/10.1016/j.est.2021.103548
- Sun Z, Zhou J, Ahuja R (Feb. 2006) Structure of Phase Change Materials for Data Storage. Phys Rev Lett 96(5):55507. 10.1103/PhysRevLett.96.055507
- Kant K, Shukla A, Sharma A, Henry Biwole P (2017) Heat transfer study of phase change materials with graphene nano particle for thermal energy storage. Sol Energy 146:453–463. https://doi.org/10.1016/j.solener.2017.03.013
- Singh Rathore PK, Shukla SK, Gupta NK (2020) Potential of microencapsulated PCM for energy savings in buildings: A critical review. Sustain Cities Soc 53:101884. https://doi.org/10.1016/j.scs.2019.101884
- Khodadadi JM, Fan L, Babaei H (2013) Thermal conductivity enhancement of nanostructure-based colloidal suspensions utilized as phase change materials for thermal energy storage: A review. Renew Sustain Energy Rev 24:418–444. 10.1016/j.rser.2013.03.031
- Al-Shannaq R, Kurdi J, Al-Muhtaseb S, Farid M (May 2016) Innovative method of metal coating of microcapsules containing phase change materials. Sol Energy 129:54–64. 10.1016/j.solener.2016.01.043
- Motahar S, Alemrajabi AA, Khodabandeh R (2016) Enhanced thermal conductivity of n-octadecane containing carbon-based nanomaterials, Heat Mass Transf., vol. 52, no. 8, pp. 1621–1631, 10.1007/s00231-015-1678-0
- Mandal SK, Kumar S, Singh PK, Mishra SK, Singh DK (2020) Performance investigation of nanocomposite based solar water heater. Energy 198:117295. 10.1016/j.energy.2020.117295
- Quenel J, Atakan B (2022) Heat flux in latent thermal energy storage systems: the influence of fins, thermal conductivity and driving temperature difference. Heat Mass Transf 58(12):2085–2096. 10.1007/s00231-022-03220-3
- Uniyal A, Prajapati YK (2024) Impact of Fin Arrangement on Heat Transfer and Melting Characteristics of Phase Change Material. J Therm Sci. 10.1007/s11630-024-1925-0
- Gao Y, Meng X (2023) A comprehensive review of integrating phase change materials in building bricks: Methods, performance and applications. J Energy Storage 62:106913. https://doi.org/10.1016/j.est.2023.106913
- Akeiber H et al (2016) A review on phase change material (PCM) for sustainable passive cooling in building envelopes. Renew Sustain Energy Rev 60:1470–1497. 10.1016/j.rser.2016.03.036
- Kosny J (2015) PCM-Enhanced Building Components - An Application of Phase Change Materials in Building Envelopes and Internal Structures
- Schossig P, Henning H-M, Gschwander S, Haussmann T (2005) Micro-encapsulated phase-change materials integrated into construction materials, Sol. Energy Mater. Sol. Cells, vol. 89, no. 2, pp. 297–306, https://doi.org/10.1016/j.solmat.2005.01.017
- Zhou D, Zhao CY, Tian Y (2012) Review on thermal energy storage with phase change materials (PCMs) in building applications. Appl Energy 92:593–605. 10.1016/j.apenergy.2011.08.025
- Lucas SS, Barroso de Aguiar JL (2019) Evaluation of latent heat storage in mortars containing microencapsulated paraffin waxes – a selection of optimal composition and binders. Heat Mass Transf 55(9):2429–2435. 10.1007/s00231-019-02594-1
- Das R, Gandhi ISR, Muthukumar P (2024) Mechanical and thermal properties of building mortars incorporating bio based phase change material. Sādhanā 49(1):70. 10.1007/s12046-023-02370-2
- Refahi A, Rostami A, Amani M (2023) Energy analysis of the building integrated with a double PCM wallboard system in various climate regions of Iran. J Therm Anal Calorim 148(16):7981–7993. 10.1007/s10973-023-11999-4
- Baccega E (2024) Thermo-physical Characterisation of Plasters Containing Phase Change Materials (PCMs). Int J Thermophys 45(3):33. 10.1007/s10765-023-03327-7
- Arfi O, Mezaache EH, Teggar M, Laouer A (2023) Thermal analysis of a dynamic double-layer phase change material building envelope. Energy Ecol Environ 8(5):485–502. 10.1007/s40974-023-00289-2
- Sun N, Xiao Z (2016) Paraffin wax-based phase change microencapsulation embedded with silicon nitride nanoparticles for thermal energy storage. J Mater Sci 51:8550–8561. 10.1007/s10853-016-0116-0
- Zayed ME et al Recent progress in phase change materials storage containers: Geometries, design considerations and heat transfer improvement methods, Journal of Energy Storage, vol. 30. Elsevier Ltd, 01-Aug-2020, 10.1016/j.est.2020.101341
- Stritih U, Tyagi VV, Stropnik R, Paksoy H, Haghighat F, Joybari MM (2018) Integration of passive PCM technologies for net-zero energy buildings, Sustain. Cities Soc., vol. 41, no. April pp. 286–295, 2018, 10.1016/j.scs.2018.04.036
- Parameshwaran R, Kalaiselvam S, Harikrishnan S, Elayaperumal A (2012) Sustainable thermal energy storage technologies for buildings: A review. Renew Sustain Energy Rev 16(5):2394–2433. https://doi.org/10.1016/j.rser.2012.01.058
- Sravani K, Parameshwaran R, Vinayaka Ram V (2020) Experimental Study on PCM-Based External Wall Cladding for Energy Efficient Buildings BT - Recent Advances in Mechanical Engineering, pp. 513–526
- Jiang D, Xu Y, Chen C, Liu J, Chen P (2022) Preparation and properties of phase change energy storage building materials based on capric acid–octadecanol/fly ash–diatomite. J Mater Sci 57(46):21432–21445. 10.1007/s10853-022-07968-1
- Liu P-F, Lin Y-P, Tzeng C-T, Lai C-M (2016) Heat Transfer and Energy Performance of a PVA Wall Tile Containing Macro-Encapsulated PCM. Energies 9(8). 10.3390/en9080652
- Simon F, Ruiz-Valero L, Girard A, Galleguillos H (2024) Experimental and Numerical Analysis of a PCM-Integrated Roof for Higher Thermal Performance of Buildings. J Therm Sci 33(2):522–536. 10.1007/s11630-023-1909-5
- Al-Yasiri Q, Szabó M (2023) Hourly analysis of temperature and heat gain reduction for building envelope-compacted phase change material in extremely hot conditions. J Energy Storage 68:107838. https://doi.org/10.1016/j.est.2023.107838
- Shukla PK, Kishan PA (2022) Effect of input parameters on energy requirements of phase change material integrated local heating system: a case study. Heat Mass Transf. 10.1007/s00231-022-03321-z
- Erlbeck L et al (2018) Adjustment of thermal behavior by changing the shape of PCM inclusions in concrete blocks. Energy Convers Manag 158:256–265. https://doi.org/10.1016/j.enconman.2017.12.073
- Pasupathy A, Velraj R (2008) Effect of double layer phase change material in building roof for year round thermal management. Energy Build 40(3):193–203. https://doi.org/10.1016/j.enbuild.2007.02.016
- Alawadhi EM, Alqallaf HJ (2011) Building roof with conical holes containing PCM to reduce the cooling load: Numerical study. Energy Convers Manag 52:8–9. 10.1016/j.enconman.2011.04.004
- Navarro L, De Gracia A, Castell A, Álvarez S, Cabeza LF (2014) Design of a prefabricated concrete slab with PCM inside the hollows. Energy Procedia 57:2324–2332. 10.1016/j.egypro.2014.10.240
- Bahrar M, Djamai ZI, Mankibi MEL, Si Larbi A, Salvia M (2018) Numerical and experimental study on the use of microencapsulated phase change materials (PCMs) in textile reinforced concrete panels for energy storage, Sustain. Cities Soc., vol. 41, no. June, pp. 455–468, 10.1016/j.scs.2018.06.014
- Bhamare DK, Rathod MK, Banerjee J (2020) Numerical model for evaluating thermal performance of residential building roof integrated with inclined phase change material (PCM) layer. J Build Eng 28. 10.1016/j.jobe.2019.101018
- Kim HG, Kim Y, Kwac LK, Park M, Shin HK (2020) Role of Phase Change Materials Containing Carbonized Rice husks on the Roof-Surface and Indoor Temperatures. for Cool Roof System Application
- Meng E, Yang J, Zhou B, Wang C, Li J (2022) Preparation and thermal performance of phase change material (PCM) foamed cement used for the roof. J Build Eng 53:104579. 10.1016/j.jobe.2022.104579
- Al-Yasiri Q, Szabó M (2023) Experimental study of PCM-enhanced building envelope towards energy-saving and decarbonisation in a severe hot climate. Energy Build 279:112680. 10.1016/j.enbuild.2022.112680
- Saxena R, Agarwal N, Rakshit D, Kaushik SC (2019) Suitability Assessment and Experimental Characterization of Phase Change Materials for Energy Conservation in Indian Buildings, J. Sol. Energy Eng., vol. 142, no. 1, Sep. 10.1115/1.4044568
- Bhamare DK, Rathod MK, Banerjee J (2020) Selection of phase change material and establishment of thermophysical properties of phase change material integrated with roof of a building using Measure of Key Response index: Proposal of a new parameter. J Energy Storage 32:101812. https://doi.org/10.1016/j.est.2020.101812
- Saxena R, Rakshit D, Kaushik SC (2020) Experimental assessment of Phase Change Material (PCM) embedded bricks for passive conditioning in buildings. Renew Energy 149:587–599. https://doi.org/10.1016/j.renene.2019.12.081
- Simulated historical climate & weather data for Ropar - meteoblue. [Online]. Available: https://www.meteoblue.com/en/weather/historyclimate/climatemodelled/ropar_india_1257951. [Accessed: 20-May-2022]
- Singh RP, Xu H, Kaushik SC, Rakshit D, Romagnoli A (2018) Charging performance evaluation of finned conical thermal storage system encapsulated with nano-enhanced phase change material, Appl. Therm. Eng., vol. 151, no. September pp. 176–190, 2019, 10.1016/j.applthermaleng.2019.01.072
- Patel B et al (2023) Location optimization of phase change material for thermal energy storage in concrete block for development of energy efficient buildings. Renew Energy 218:119306. https://doi.org/10.1016/j.renene.2023.119306
- Rathore PKS, Shukla SK, Gupta NK (2020) Yearly analysis of peak temperature, thermal amplitude, time lag and decrement factor of a building envelope in tropical climate. J Build Eng 31:101459. 10.1016/j.jobe.2020.101459
- Al-Yasiri Q, Szabó M (May, 2021) Thermal performance of concrete bricks based phase change material encapsulated by various aluminium containers: An experimental study under Iraqi hot climate conditions. J Energy Storage 40. 10.1016/j.est.2021.102710
- Soares N et al (2020) July., Validation of different numerical models with benchmark experiments for modelling microencapsulated-PCM-based applications for buildings, Int. J. Therm. Sci., vol. 159, no. 2021, 10.1016/j.ijthermalsci.2020.106565
- Fukai J, Kanou M, Kodama Y, Miyatake O (2000) Thermal conductivity enhancement of energy storage media using carbon fibers. Energy Convers Manag 41:1543–1556. https://doi.org/10.1016/S0196-8904(99)00166-1
- Ferrer G, Solé A, Barreneche C, Martorell I, Cabeza LF (Apr. 2015) Corrosion of metal containers for use in PCM energy storage. Renew Energy 76:465–469. 10.1016/j.renene.2014.11.036
- Kinoshita H et al (2013) Corrosion of aluminium metal in OPC- and CAC-based cement matrices. Cem Concr Res 50:11–18. 10.1016/j.cemconres.2013.03.016
- Caes S, Gurning AC, Li X, de Souza V, Kursten B (Jan. 2023) Corrosion of aluminium in ordinary Portland cement paste: Influence of matrix porosity and the presence of LiNO3 corrosion inhibitor. Mater Corros 74(1):125–137. https://doi.org/10.1002/maco.202213296
- Pitts JW (1967) Corrosion of Aluminum Embedded in Concrete
- Herting G, Odnevall I (2021) Corrosion of Aluminium and Zinc in Concrete at Simulated Conditions of the Repository of Low Active Waste in Sweden. Corros Mater Degrad 2(2):150–163. 10.3390/cmd2020009
- Psomopoulos CS, Skoula I, Karras C, Chatzimpiros A, Chionidis M (2010) Electricity savings and CO2 emissions reduction in buildings sector: How important the network losses are in the calculation? Energy 35(1):485–490. https://doi.org/10.1016/j.energy.2009.10.016
- Voorspools KR, D’haeseleer WD (2000) The influence of the instantaneous fuel mix for electricity generation on the corresponding emissions. Energy 25(11):1119–1138. https://doi.org/10.1016/S0360-5442(00)00029-3
- Approved_report_emission__2021_22.pdf
- Fateh A, Borelli D, Devia F, Weinläder H (2018) Summer thermal performances of PCM-integrated insulation layers for light-weight building walls: Effect of orientation and melting point temperature. Therm Sci Eng Prog 6:361–369. https://doi.org/10.1016/j.tsep.2017.12.012
No competing interests reported.