5.1 Data Acquisition
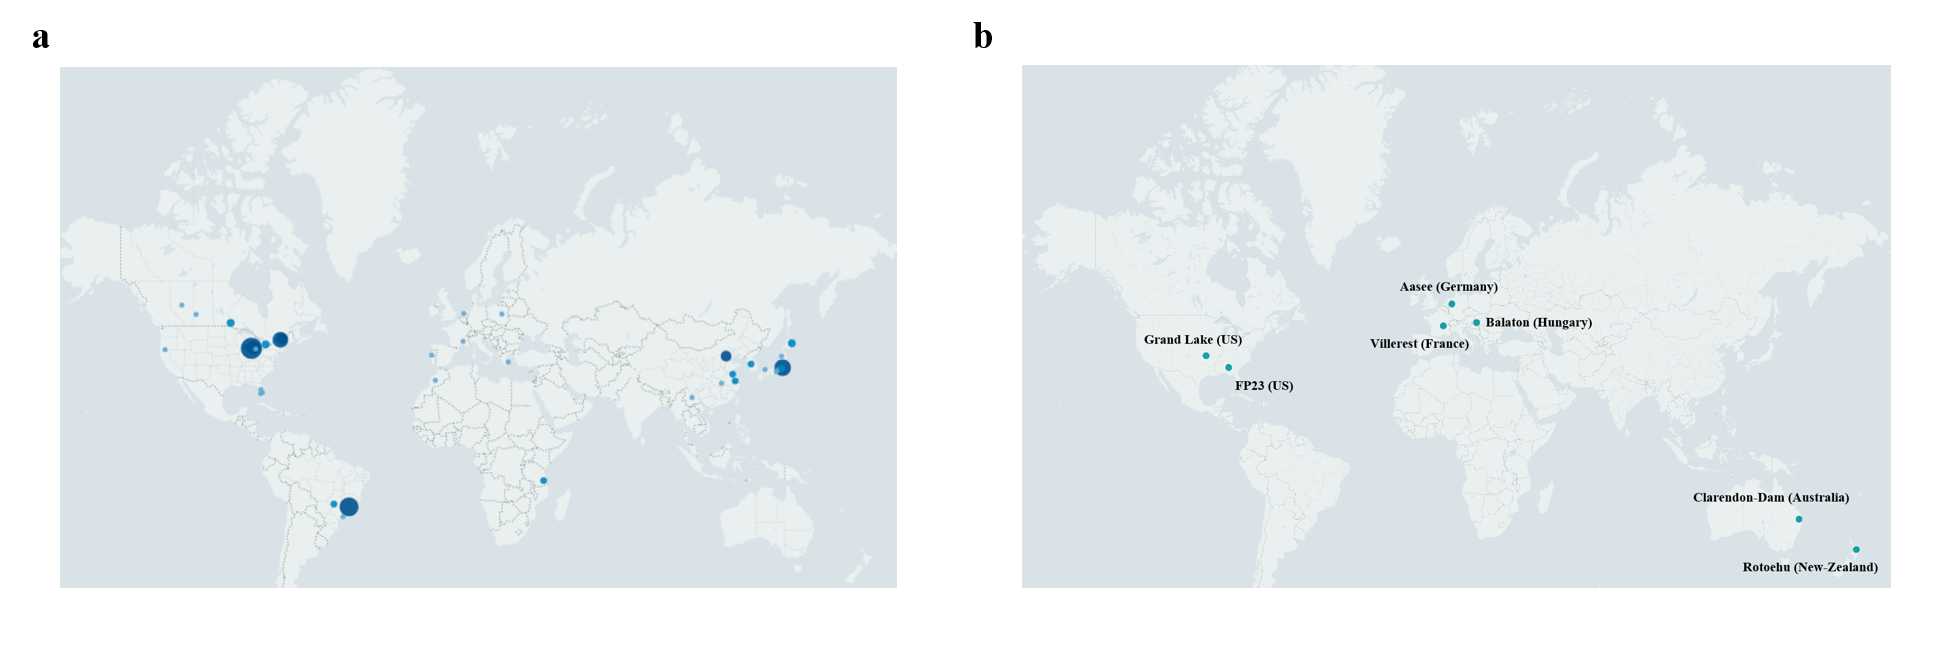
Microcystis genome repository: A total of 162 publicly available Microcystis genomes were sourced from the NCBI database (https://www.ncbi.nlm.nih.gov/). Geospatial data were collected for 151 of these strains, with the majority originating from the United States (51 strains), Canada (26 strains), Japan (25 strains), Brazil (24 strains), and China (13 strains). (Supplementary Fig. 4a)
Functional gene information
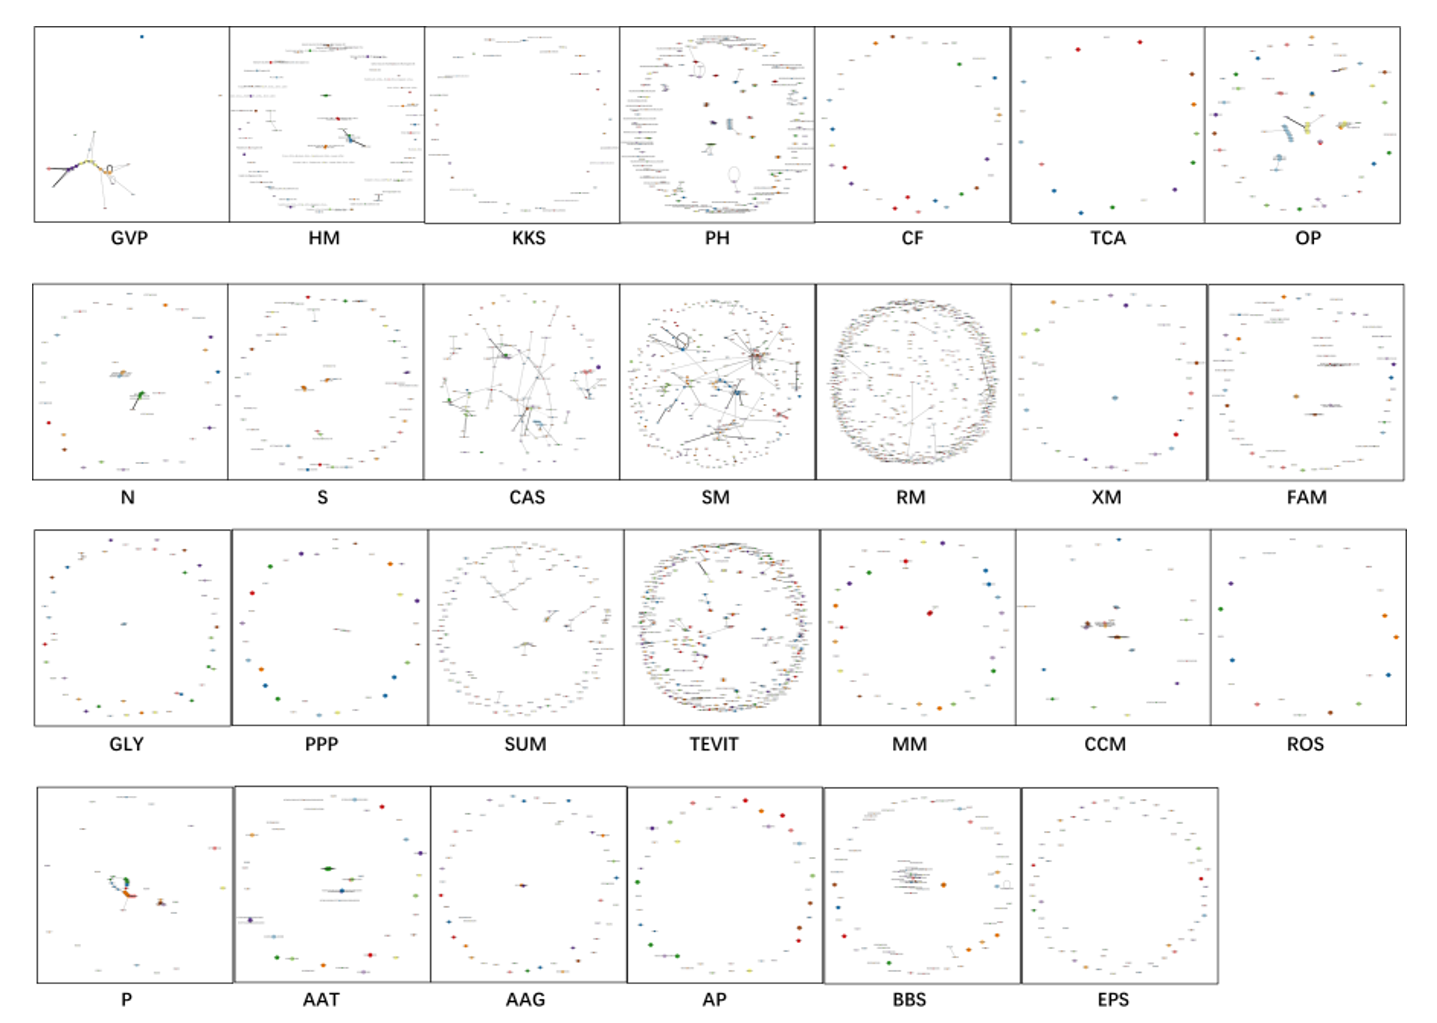
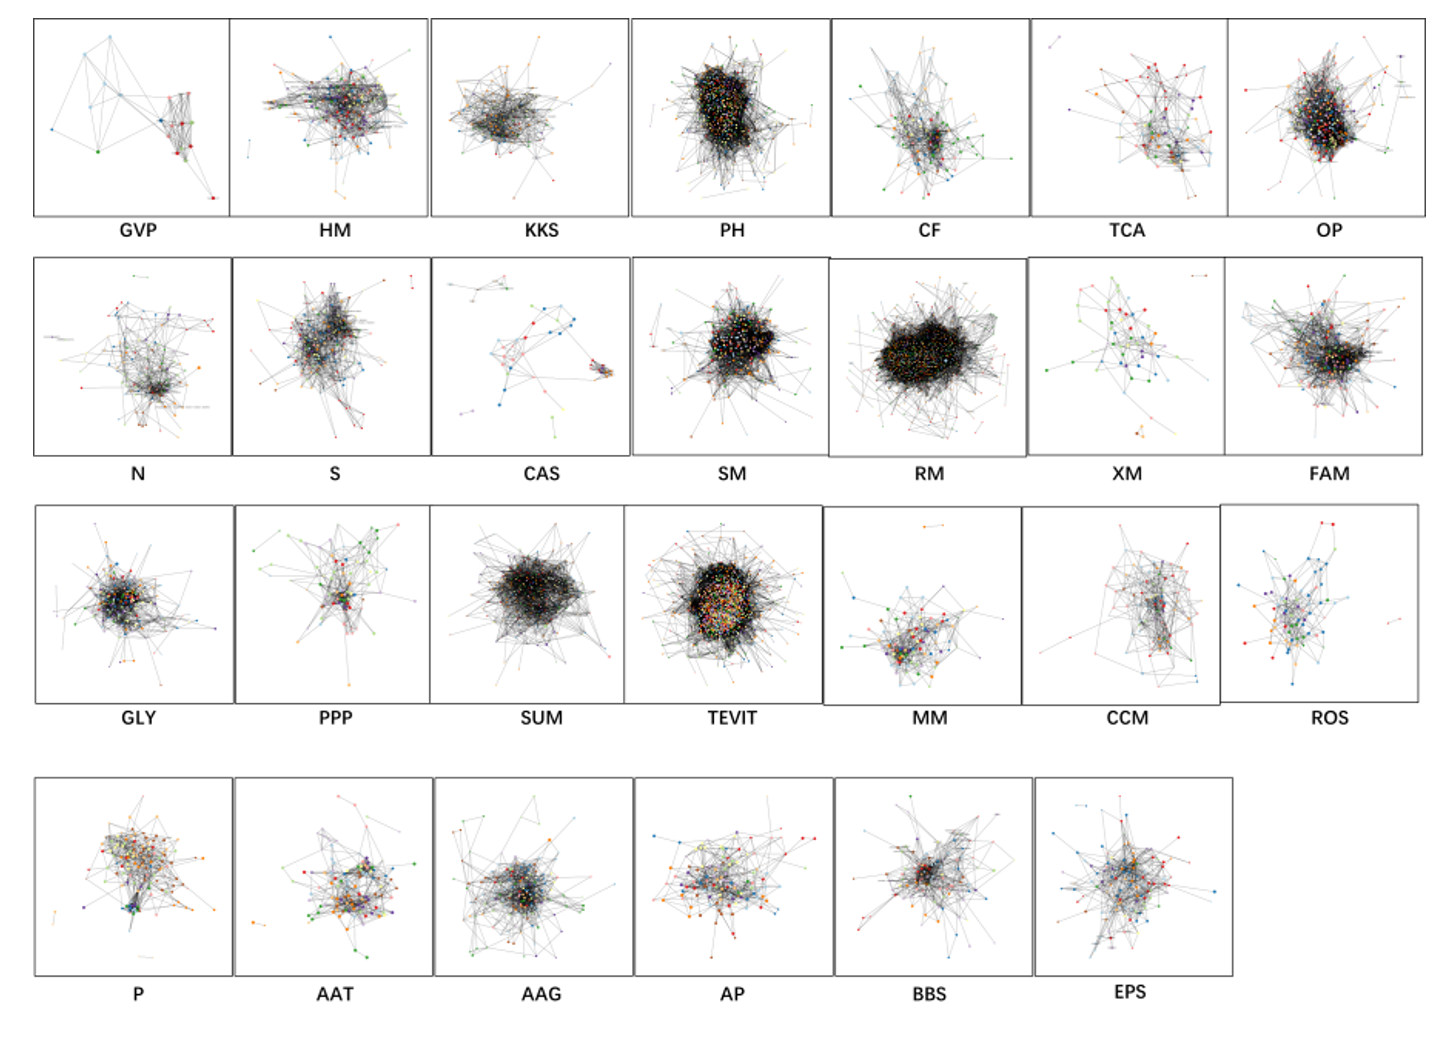
A comprehensive list of abbreviations for the 27 key functions examined in this study is provided in Table 2.
-
Information pertaining to antibiotic-related functions (KKS) was procured from the CARD database (https://card.mcmaster.ca/).
-
Information on heavy metal (HM) related functional genes were sourced from the BacMet database (http://bacmet.biomedicine.gu.se/).
-
Information on restriction modification system-related functional genes was sourced from the REBASE database (http://rebase.neb.com/rebase/rebase.seqs.html).
-
Additional functional genes related to gas vesicle, CRISPR-Cas systems and secondary metabolism were extracted from Microcystis protein FASTA files.
-
All remaining functional gene data were retrieved from the KEGG database through functional annotation (https://www.ncbi.nlm.nih.gov/).
Protein-Protein interaction data: Interaction datasets were obtained from the STRING database (https://string-db.org/).
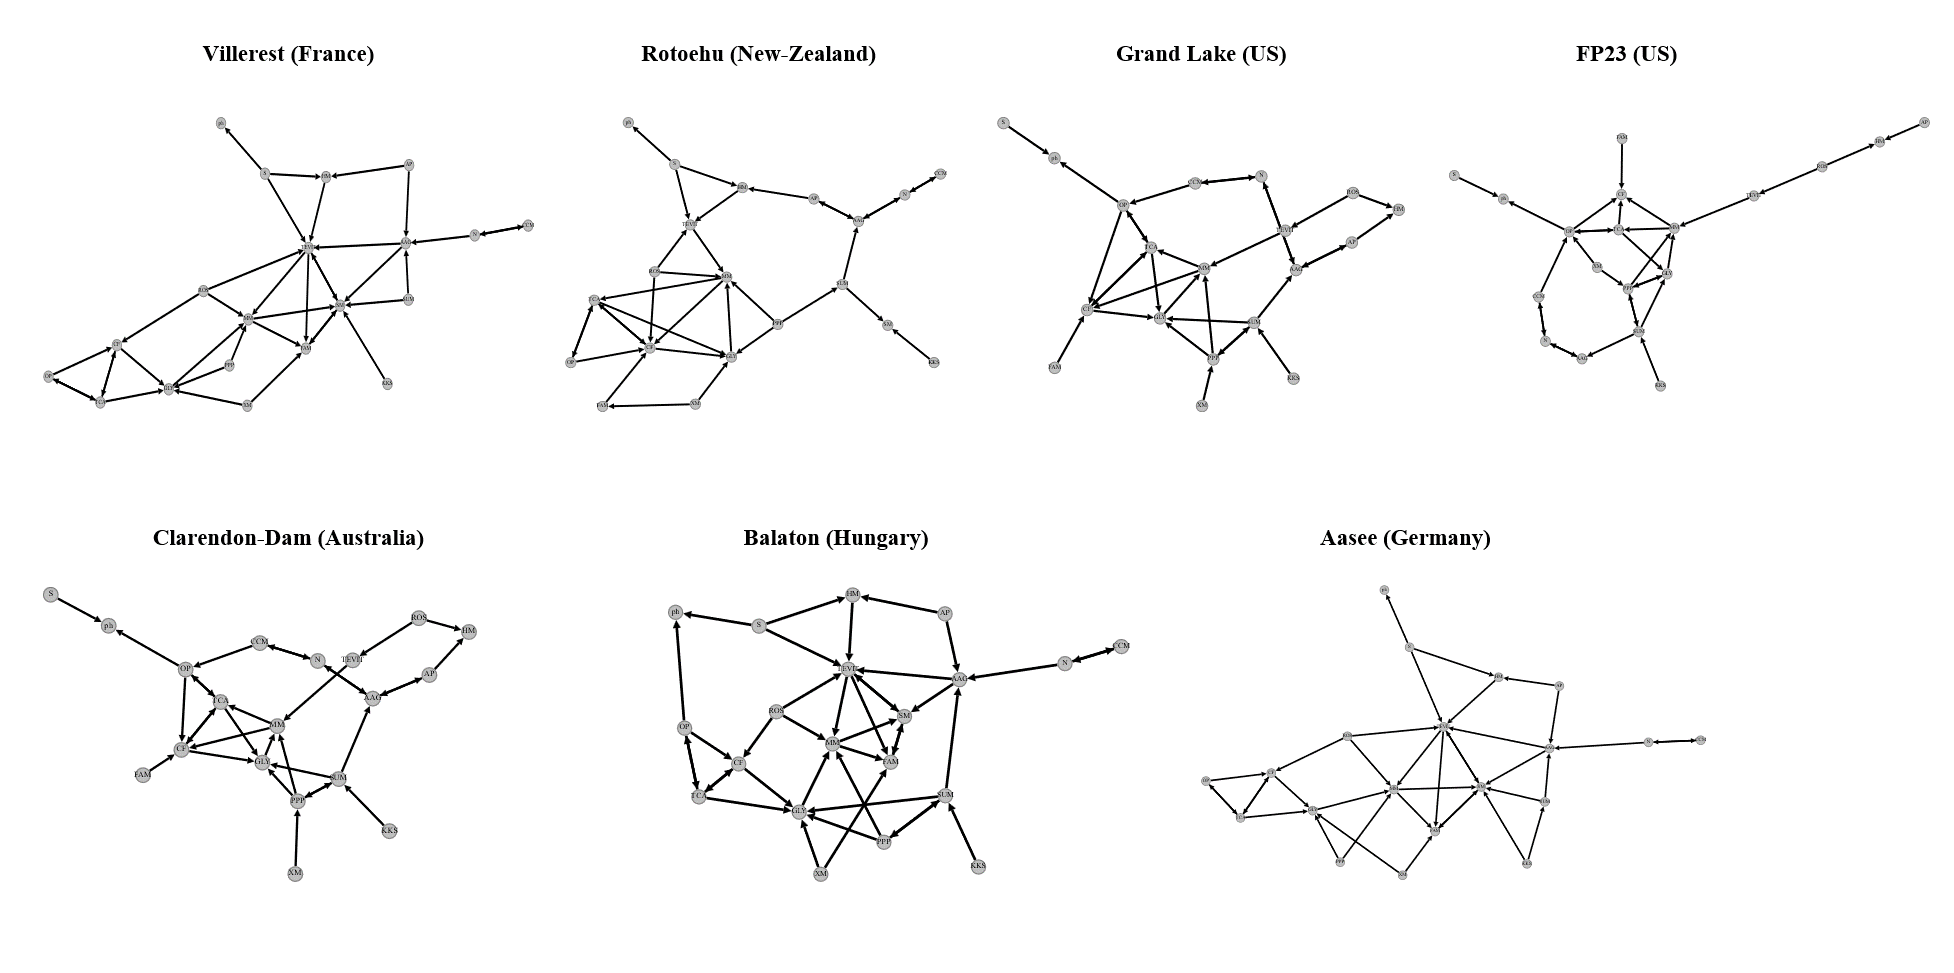
Lake metagenome data
Metagenomic datasets for seven distinct lakes were sourced from the open-access project PRJNA575023. (Supplementary Fig. 4b)
Table 2
the comprehensive list of abbreviations for the 27 key functions
| Abbreviations | Function |
| AAG | Alanine, aspartate and glutamate metabolism |
| AAT | Amino acid transporters |
| AP | Arginine and proline metabolism |
| BBS | Bacterial secretion system |
| CAS | CRISPR-Cas systems |
| CCM | Carbon Dioxide Concentration Mechanism |
| CF | Carbon fixation |
| EPS | Exopolysaccharide synthesis |
| FAM | Fatty acid metabolism |
| GLY | Glycolysis |
| GVP | Gas vesicle |
| HM | Heavy metal |
| KKS | Antibiotic-related functions |
| MM | Methane metabolism |
| N | Nitrogen metabolism |
| OP | Oxidative phosphorylation |
| P | Phosphorus metabolism |
| PH | Photosynthesis |
| PPP | Pentose phosphate pathway |
| RM | Restriction modification system |
| ROS | Respond of oxidative stress |
| S | Sulfur metabolism |
| SM | Secondary metabolism |
| SUM | Amino sugar and nucleotide sugar metabolism |
| TCA | TCA cycle |
| TEVIT | Metabolism of trace elements and vitamins |
| XM | Xenobiotics metabolism |
5.2 Community Detection Scheme
Louvain community detection
The Louvain algorithm serves as an optimized community detection algorithm commonly employed for identifying community structures in large-scale network graphs. The algorithm's fundamental objective is to maximize modularity within the network graph, where modularity is a quantitative index assessing the quality of community structures. A higher value signifies more cohesive intra-community connections and fewer inter-community links. The algorithm operates in a two-phase cycle, iteratively executed until modularity ceases to improve (Fig. 7a). The calculation of modularity is as follows
$$\varDelta M= \left[\frac{\sum in+2{k}_{i,m}}{2W}-{\left(\frac{\sum tot+{k}_{i}}{2W}\right)}^{2}\right]-\left[\frac{\sum in}{2W}-{\left(\frac{\sum tot}{2W}\right)}^{2}-{\left(\frac{{k}_{i}}{2W}\right)}^{2} \right]$$
Where \(\varDelta M\) is the modularity change caused by moving node i into community C, where \(\sum in\)is the sum of edge weights inside community C; \(\sum tot\) is the sum of edge weights of all nodes in C; \({k}_{i}\) is the sum of weights that edges connected to node i; \({k}_{i,\text{i}\text{n}}\) is the sum of the weights that edges connecting node i to the internal nodes of C; W is the sum of the weights of all edges in the network.
Consistency clustering
Given that the Louvain algorithm is a greedy algorithm sensitive to random seeds and initial conditions, it may yield varying community partitions for the same network. To address this, the study employs a robust community consistency clustering approach, outlined as follows (Fig. 7b)
-
Step 1: Execute the Louvain algorithm on the genome structure network n times, yielding n sets of community partitions.
-
Step 2: Aggregate all community detection outcomes. Edge weights are defined as the probability Dij that two nodes are grouped within the same community across all runs.
-
Step 3: Implement a threshold τ to filter edges and derive consistent community partitions.
AGE algorithm
Unlike the Louvain algorithm, which focuses solely on topological node similarity, the Adaptive Graph Encoder (AGE) is a graph embedding framework utilizing graph convolution networks to offer a more nuanced representation of graphs, thereby enriching the community partitioning of attribute-rich graphs [32]. The AGE algorithm employs an efficient graph filter for Laplacian smoothing and uses an adaptive learning strategy for node feature training.
Optimal community detection scheme: By synergistically integrating the consistency and AGE community detection methods, this study introduces a novel community detection combination scheme. Specifically, the node community co-occurrence matrix D obtained through consistency clustering and the community clustering matrix S derived from the AGE algorithm are point-multiplied to generate the combined community clustering matrix C. This matrix is subsequently clustered to yield the final community detection outcome. (Fig. 7c). Two adjustable parameters are involved: τ, the consistency clustering threshold, and n, the number of communities partitioned by the AGE algorithm. The optimal settings were determined to be τ = 0.7, n = 100. (Supplementary Table 6).
Quantitative evaluation metrics for tree consistency
In this research, a species clustering tree was constructed based on the community-species co-occurrence relationships derived from the community detection scheme. Using CVtree as a reference point, we calculated the tree consistency between the CVtree and the species clustering tree generated by each scheme. This approach aimed to evaluate the biological validity and scientific rationale of the community detection scheme. To achieve a comprehensive and quantitative assessment of tree consistency, we employed four distinct metrics
-
Distance between trees: The distance between two nodes on a tree is quantified by the number of root nodes separating them. The difference in distance between two nodes across two trees is calculated as the disparity in their respective distance on each tree. This metric is the cumulative sum of the distance differences for all node pairs across two trees, serving as an index for the divergence in clustering outcomes between the trees.
-
Number of consistent clustering pairs: Node pairs maintaining identical distances across two trees are considered to exhibit a consistent clustering relationship. This metric counts the node pairs that exhibit consistent clustering across two trees, thereby quantifying the degree of clustering consistency.
-
Number of consistent subgraphs and the largest consistent subgraph: This metric involves linking the node pairs with consistent clustering relationships across two trees and enumerating the resultant subgraphs and their maximum sizes, thereby providing a measure of the overall clustering consistency.
5.3 Complex Network Analysis Techniques
Degree distribution
In network theory, a node's degree signifies the count of unique nodes to which it is directly linked. Degree distribution serves as a statistical measure of the degrees across all nodes in a network and is commonly employed to characterize the network's topological properties.
Clustering coefficient
The clustering coefficient of a node quantifies the ratio of actual connections among its neighbors to the maximum potential connections between them. The network overall clustering coefficient is the arithmetic mean of the clustering coefficients of all individual nodes, offering insights into the network's local sub attributes.
Motif counting
A motif represents a recurring local structural configuration within a network, usually comprising a limited set of nodes and their interconnections. Motif counting involves enumerating the occurrences of specific motifs within the network, thereby aiding in the understanding of both its structural and functional dynamics.
SMS inference
The solid motif structure (SMS) is characterized as a tightly interconnected local modules within the functional network, indicative of robust functional correlations. This study employs a Bayesian approach to infer high-order interactions from low-order network configurations, thereby identifying SMS within the network [33].
Node importance: This metric evaluates a node's relative significance within the network based on four primary criteria: degree centrality, closeness centrality, betweenness centrality, and eigenvector centrality.
Node Role discovery
The objective of role discovery is to ascertain and scrutinize the functional or positional roles of nodes within a network, extending beyond mere connectivity patterns [34].
Small world model and scale-free model
The scale-free model is a network generation paradigm where the network's degree distribution adheres to a power-law distribution. This study assesses a network's scale-free nature based on whether the variance of the network's degree distribution exceeds its average degree. The small-world model is another network generation paradigm characterized by a minimal average path length between any pair of nodes and a high clustering coefficient.
5.4 Microcystis Genome Structure Network Construction
Node construction
Sequence similarity among all genes within the Microcystis genome was accessed using BLAST. To efficiently and rigorously identify similar genes, this study employed a bidirectional best hits approach, aggregating sequences that exhibited both a score and coverage rate surpassing 80% into a single node [35].
Edge construction
Edges within the genome structure network symbolize the positional relationship between gene pairs within a given genome. Initially, sequence similarity for all genes was evaluated and identical node IDs were assigned to genes demonstrating high similarity and coverage. Subsequently, positional relationship pairs between genes from each genome were established. Finally, these gene positional relationship pairs were integrated to form a comprehensive genome structure network.
5.5 Metagenome Analysis for Extracting Microcystis Genomes from Lakes
Data acquisition
Raw metagenomic data corresponding to water bloom events were sourced from the publicly accessible project PRJNA575023.
Quality control
Trimmomatic (v0.39) was employed for quality assurance of the raw reads, eliminating adapters sequences, low-quality reads and reads shorter than 50 base pairs(bp).
Assembly and binning
Clean reads were assembled into contigs using MEGAHIT (v1.2.9). Contigs exceeding 1500 bp in length were subjected to binning processes using MaxBin (2.2.6) and MetaBAT (v2.12.1). Bins were refined using MetaWRAP (v1.2.2) and their completeness and contamination levels were evaluated using CheckM (v1.0.12). Bins exhibiting completeness above 85% and contamination below 5% were retained for further analysis.
Functional annotation
Annotation of functional elements within the bins was conducted using KofamKOALA (v2023-04-01).