Cell culture and establishment of radioresistant cells
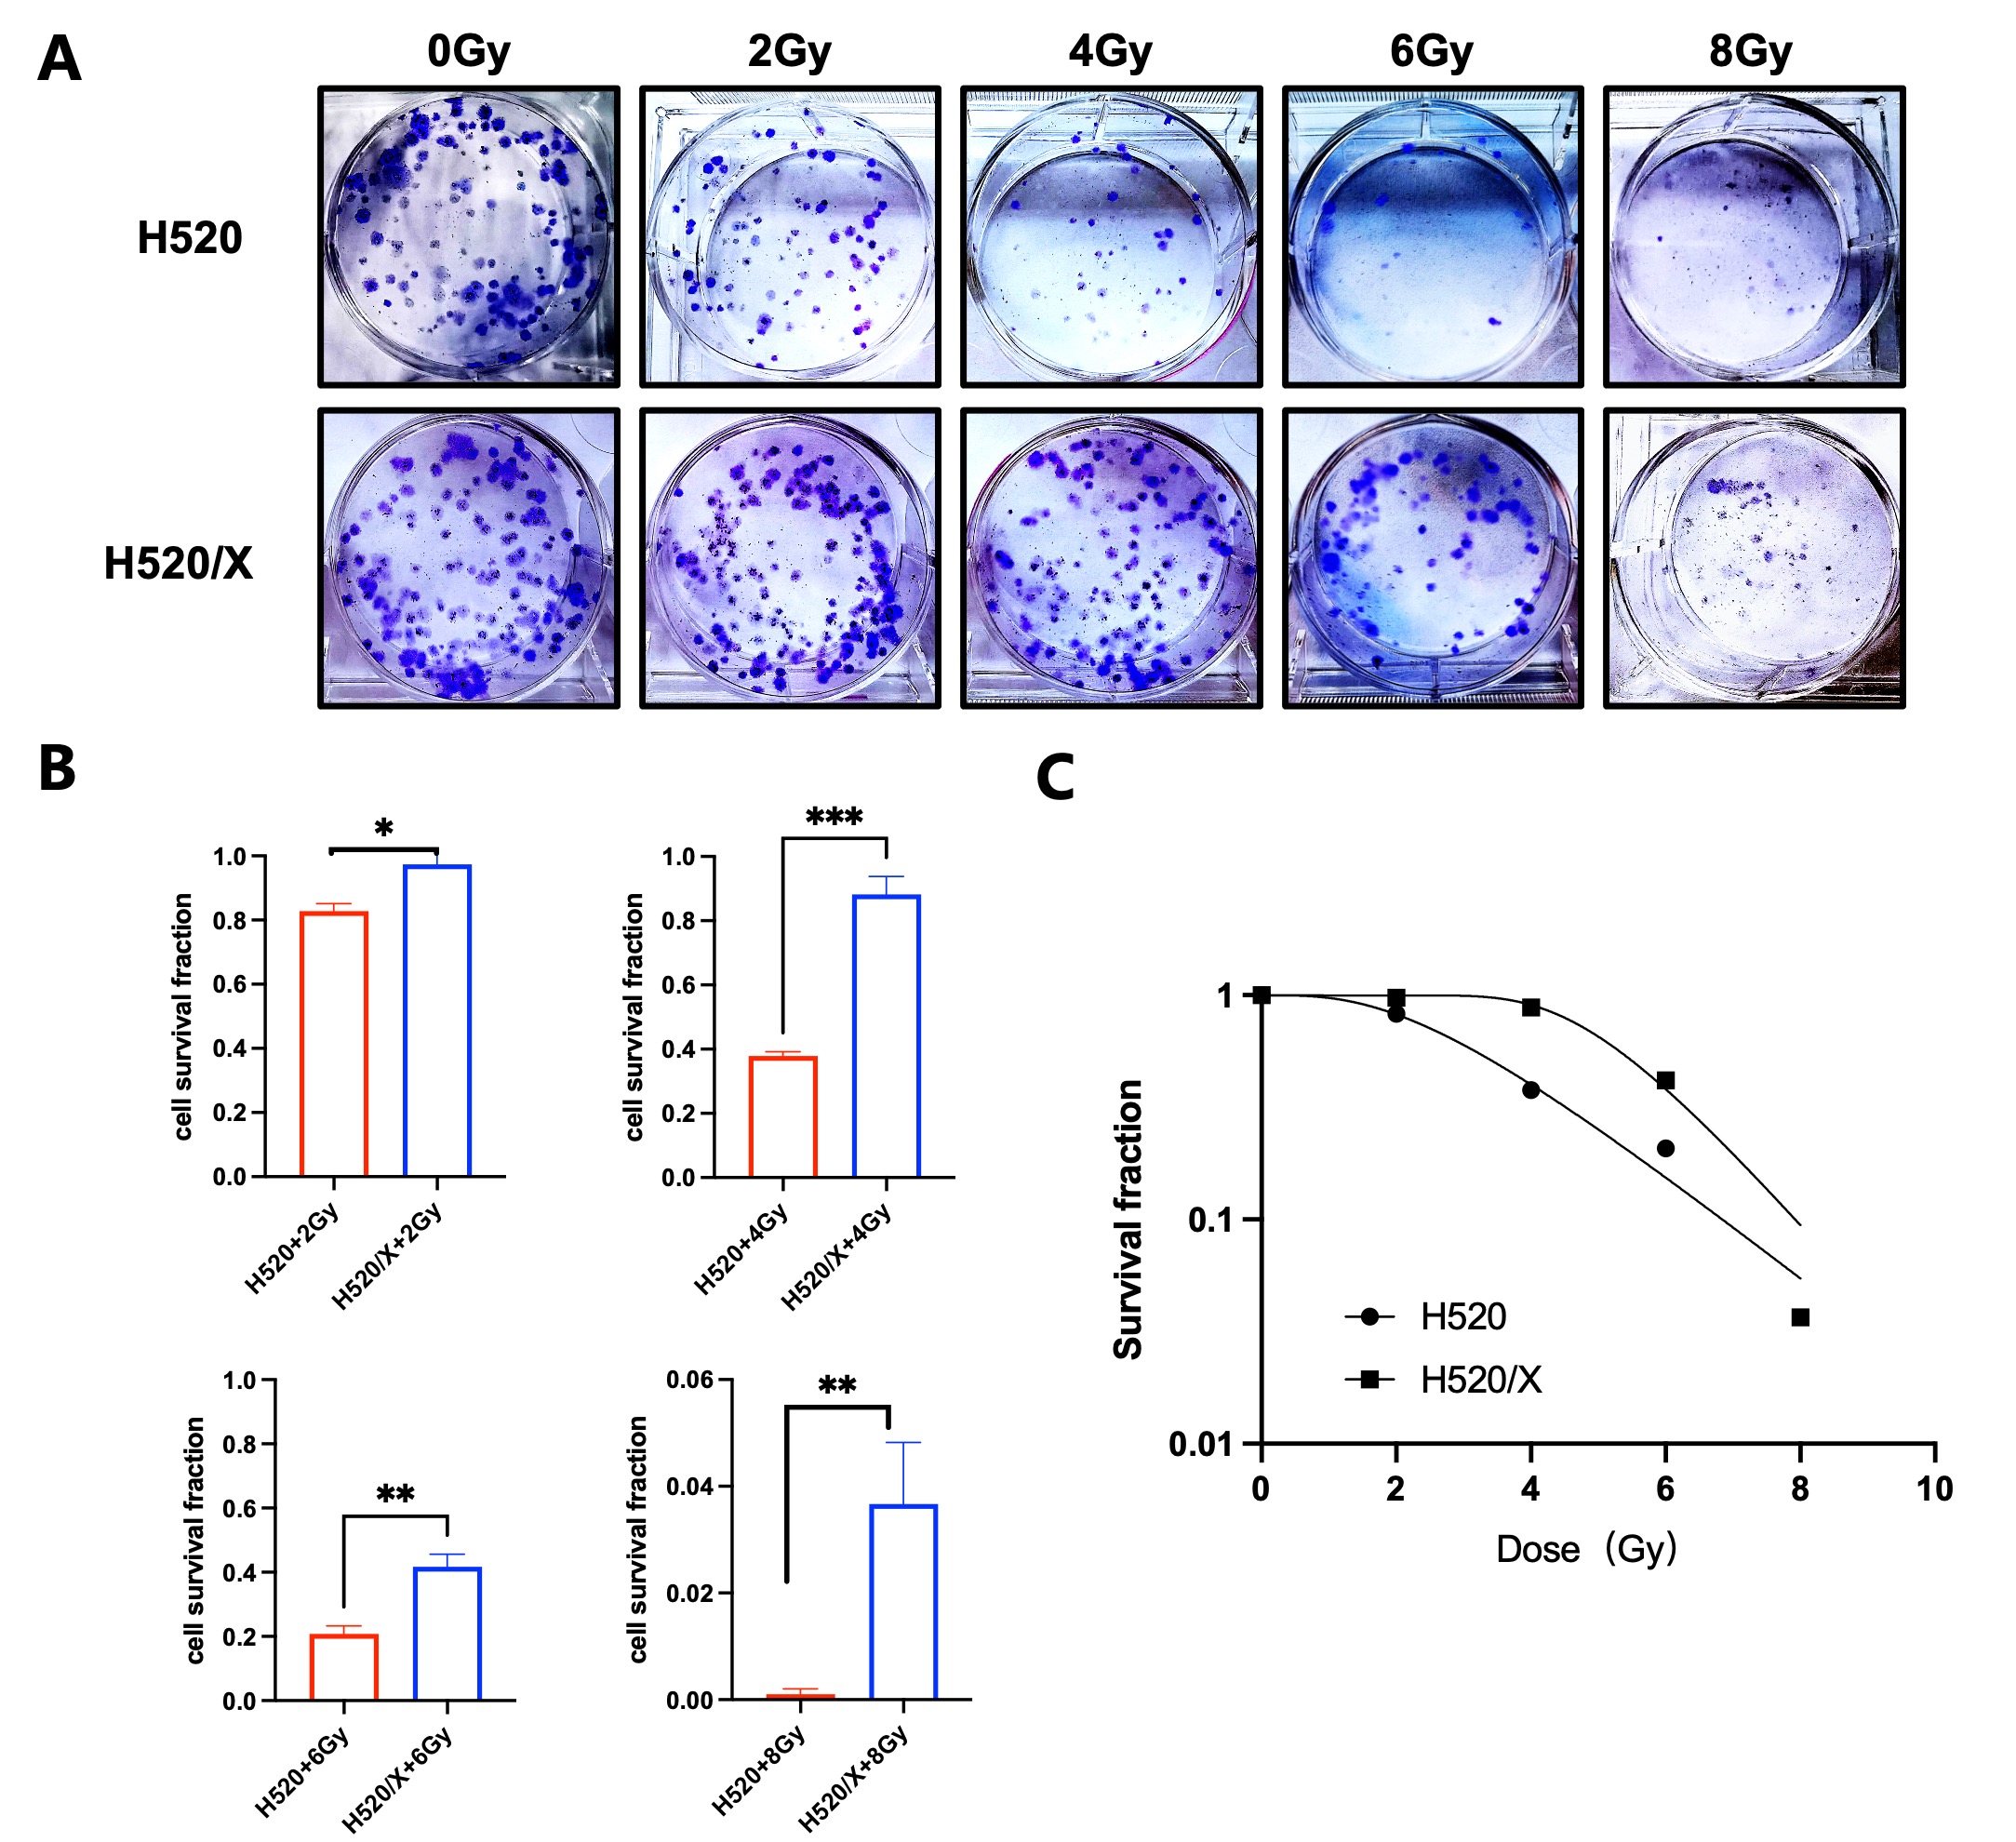
A549, H520, LLC and HEK293T cells were obtained from the American Type Culture Collection (Manassas, VA). In terms of the inducement of Radioresistant cells, A549 and H520 cells in the logarithmic growth phase received conventionally fractionated radiation by a TrueBeam linear accelerator (Varian Medical Systems, Palo Alto, CA, USA). The radiation field was 10×10 cm. The source skin distance was 100 cm. Radiation was delivered in 2Gy per fraction once a day for a total of 25 fractions. After delivering 25 fractions, cells were subcultured cells every 3 days for a maximum of 15 passages. We validated A549 and H520 radioresistant cells through the colony formation assay and named them A549/X and H520/X cell line, respectively.
All cells were cultured in Dulbecco’s modified Eagle medium (Gibco, Carlsbad, CA) containing 10% certified fetal bovine serum (BIOAGRIO SCIENCE) and 100 U/ml Penicillin-Streptomycin (CellorLab) at 37°C with 5% CO2. All research cell lines were cultured for fewer than 20 generations.
Isolation and measurement of exosome
Exosome isolation kits (Invitrogen, USA) were used for exosome isolation. Cells were cultured in a complementary medium with 10% exosome depleted FBS (Gibico, Carlsbad, CA) and 1% penicillin–streptomycin. After 3 days of culture, the cell culture media were harvested and centrifuged at 2000×g for 30 min. The supernatants were collected and incubated with exosome concentration solution overnight at 4°C. Then, we centrifuged the samples at 10000×g for 1 hour at 4°C. The exosomes were harvested from resuspended precipitate with PBS and purified by exosome purification filter (Milipore, Billerica, MA, USA). Exosomes were identified with transmission electron microscopy.
Validation of exosome
Exosome morphology was evaluated by transmission electron microscopy (TEM) (HT-7700, Hitachi High-Technologies Corporation, Minato, Tokyo, Japan). The average hydrodynamic diameter and concentration of exosomes in solution were measured and analyzed by nanoparticle tracking analysis (NTA) using the instrument of NanoFCM with a nano-Analyzer (NanoFCM Inc., Xiamen, China). Three independent samples of exosomes from each target cell line were measured. The expression of the exosome markers (CD63, CD81 and Alix) and Calnexin was assessed by Western blotting.
Vectors, transfection, and retroviral infection
Three shRNA oligonucleotides were synthesized to silence the endogenous PAICS. The pLVX-PAICS vector was constructed by subcloning the PCR-amplified human PAICS coding sequence into the pLVX vector. HEK293T cells were transfected with 2 µg of the retroviral vectors using Lipofectamine 2000 (Invitrogen, USA). The supernatant with lentivirus was collected at 48 and 72 hours after transfection and used to infect the cells with polybrene (8 g/ml, Beyotime). We replaced the supernatant with fresh medium overnight and seeded the infected cells into new dishes containing culture medium with 4µg/ml puromycin after 48 hours. After one week of puromycin selection, we seeded the cells into 96-well plates at the density of 1 to 3 cells per well for continued selection. After two weeks, numerous isolated colonies were observed and transferred to 6-well plates for expansion. Then, we verified the PAICS knockdown and overexpression effect of these cells by Western blotting. Table S1 contains the oligonucleotide sequences of the shRNA against PAICS and PAICS overexpression.
Colony formation assay
The radiation sensitivity of each cell line was assessed by the colony formation assay under the treatment of exosomes derived from different cells and irradiation of 0, 2, 4, 6, 8 Gy. Cells were seeded in the 6-well plates at the density of 1500 cells per well. Each sample involved three duplicate wells and received radiation treatment of different doses. We refreshed the cell culture medium every other day. After 15 days, the colonies were fixed with 4% paraformaldehyde and stained with 1% crystal violet solution. A colony containing more than 50 cells was regarded as surviving. The plating efficiency (PE) and cell survival fraction (SF) of each cell line was calculated as follows: PE = the number of surviving colonies/ the number of seeded cells; SF = PE (irradiated cells)/ PE (unirradiated cells). Survival curves were fitted into the single impact multi-target model (Y = 1 - (1 - exp (-k x))^ N). The radiobiological parameters including the mean lethal dose (D0), the quasi-threshold dose (Dq), the extrapolation number (N), the surviving fraction at 2 Gy and the sensitizer enhancement ratio (SER) were calculate. The SER and Dqwas determined as follows, SER = D0 of combination treatment/D0 of irradiation treatment alone, Dq = In(N) × D0.
CCK8 assay
Cells were seeded in 96-well plates (2 × 10³/well) and delivered with according treatment after incubating in complete cell culture medium for 24 hours. Then, we discard the old solution at different time points after the treatment, added 95 µl of complete cell culture medium and 5ul of CCK-8 (Dojindo Chemical Laboratory, Kumamoto, Japan) to each well and incubated the plates at 37°C for 2 hours. The OD value of each experimental well at 450 nm was detected with a microplate reader (Thermo, Waltham, MA, USA).
Wound healing assay
Wound healing assays were used to assess the cell motility induced by irradiation. The constructed cells and the control cells were inoculated in 6-well plates, respectively (5 × 10⁵/well) and cultured with complete for 24 hours. Then, we scratched the wound using a 10 µl pipette tip, marked it at the bottom of well and washed it gently for twice. We cultured the cells with DMEM containing 1% FBS and captured the images with the 4× objective of a microscope at 0 h and 48h at the same location. At least three sessions were observed in each independent experiment. We calculated the wound area by the Image J software and the percentage wound healing was calculated as follows: Wound healing percentage= [ (Area0h - Area48h) / Area0h] × 100%.
Western blotting
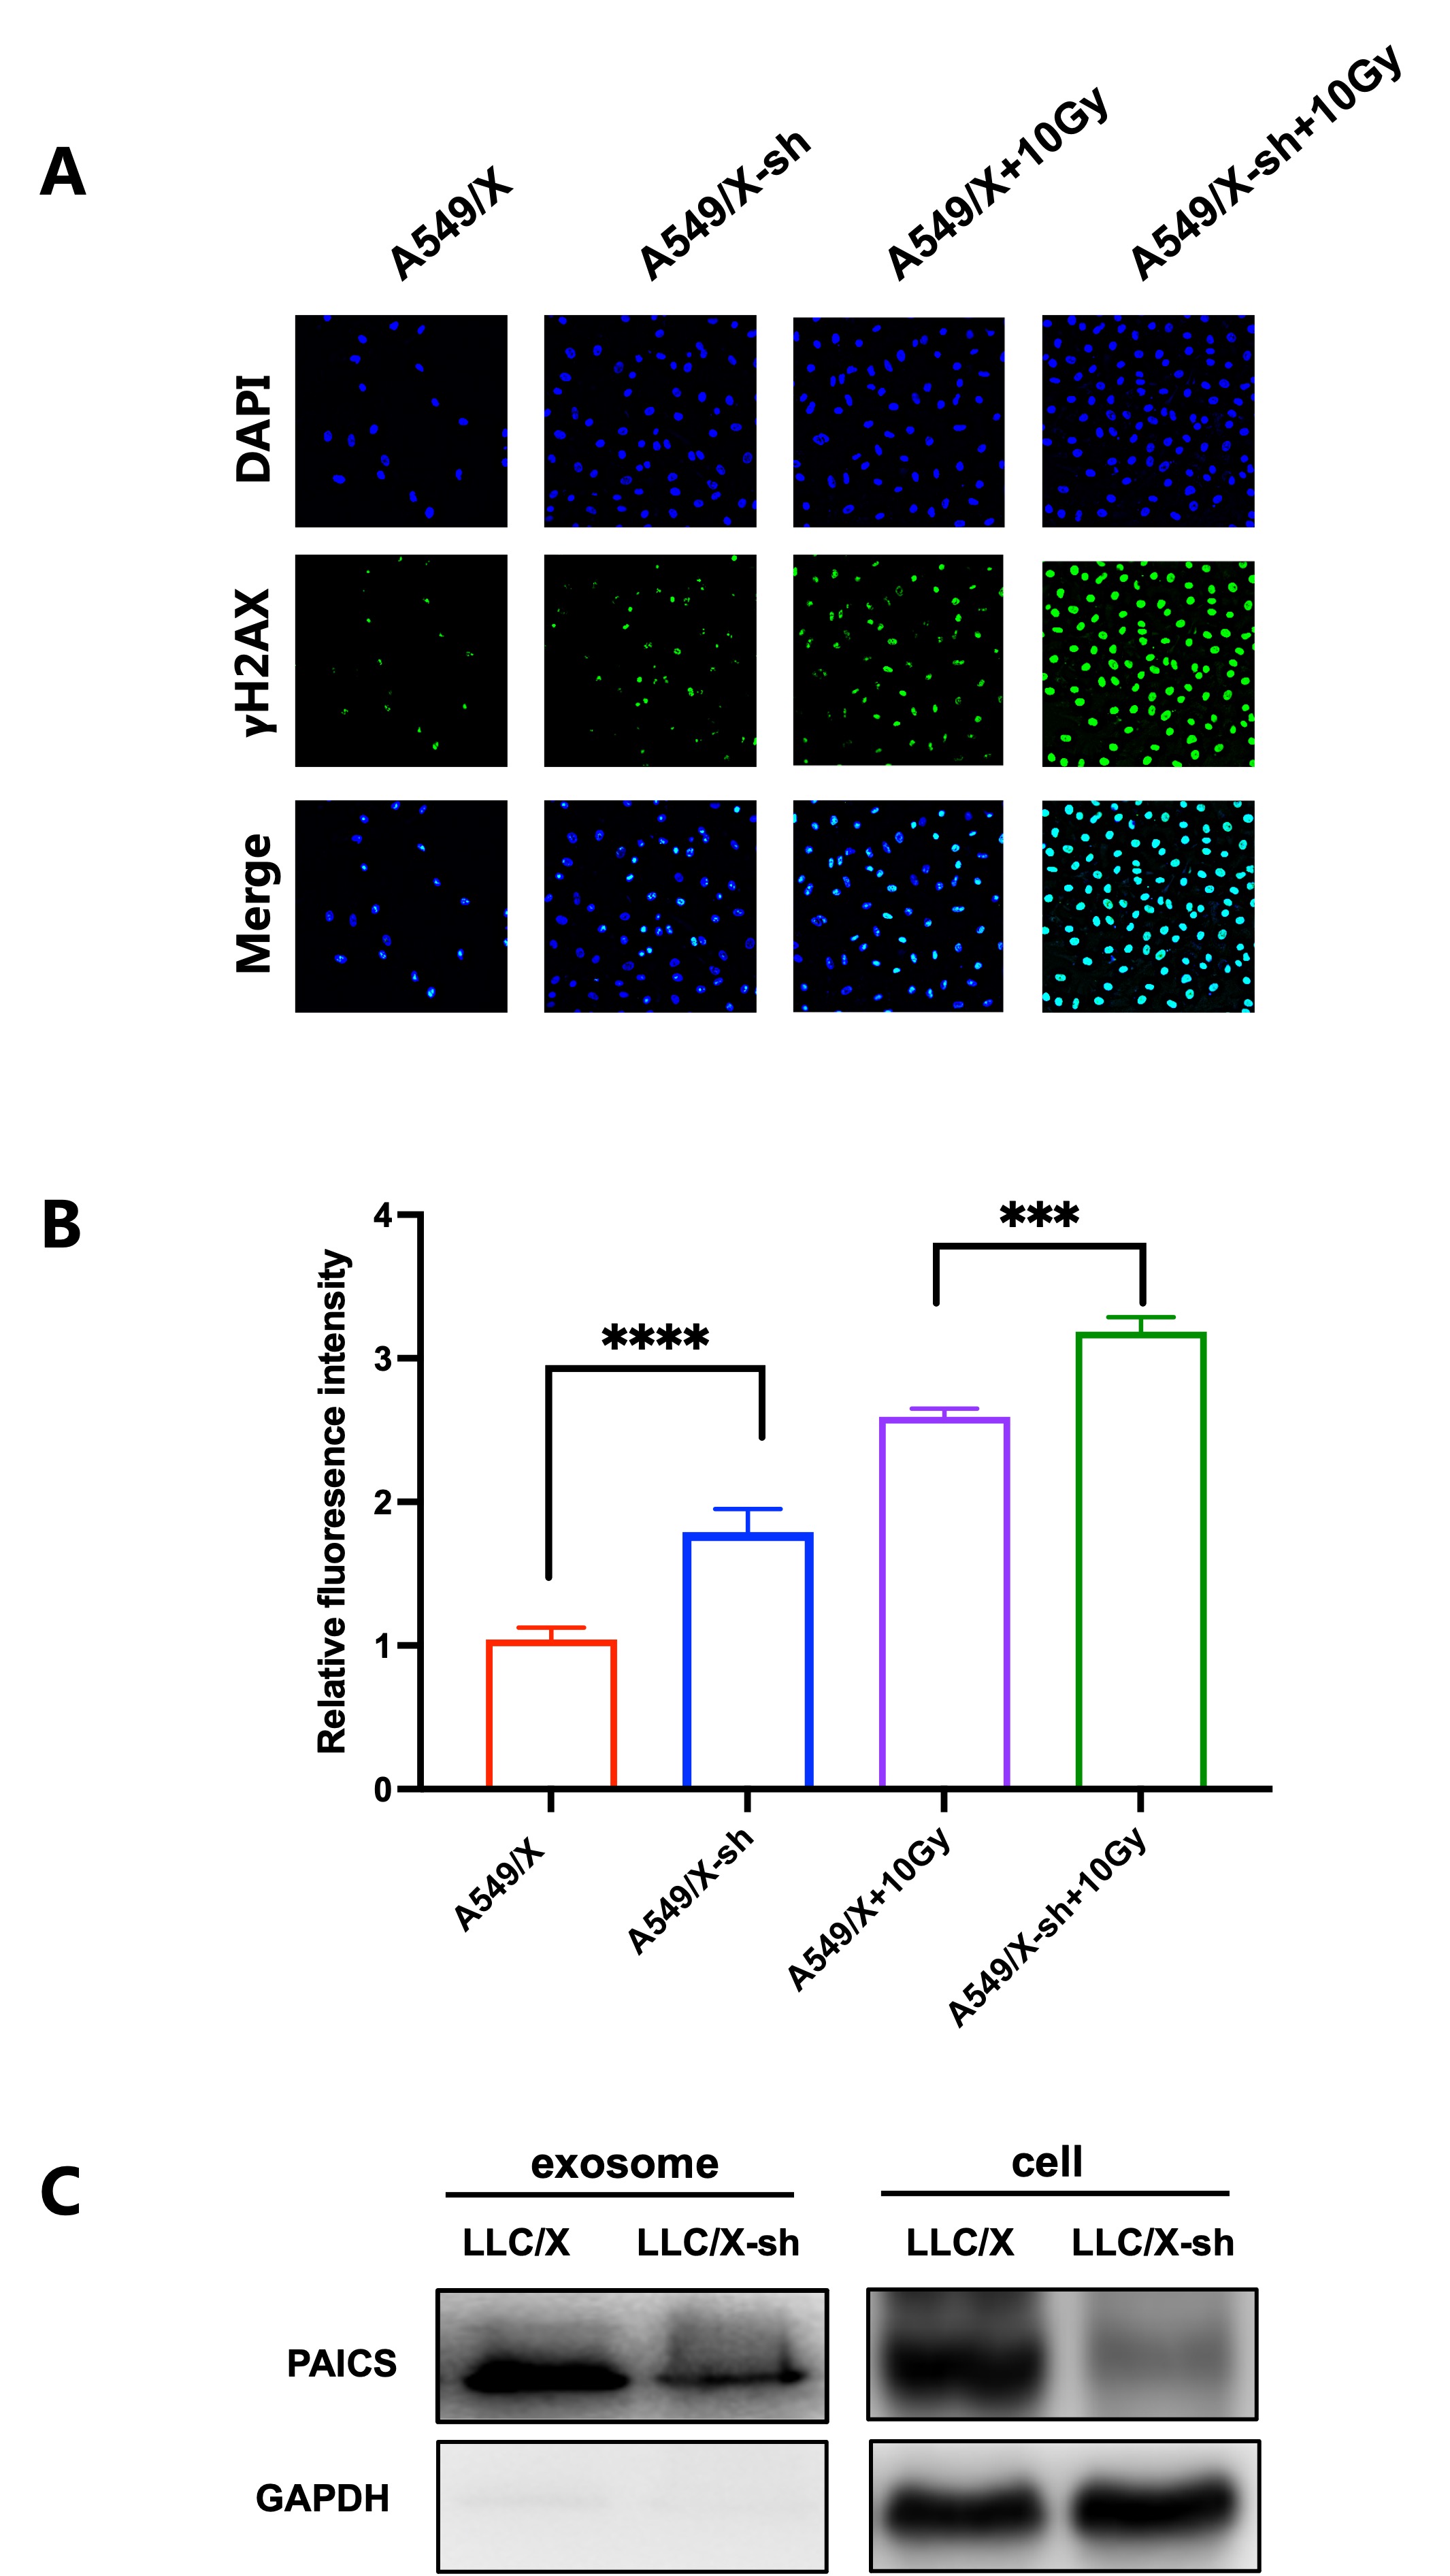
RIPA lysis buffer added with protease inhibitors and phosphatase inhibitors (Beyotime, China) was used to extract total protein from the cells and tumor tissues at the indicated time points. After assessed by BCA Protein Assay kit (Beyotime, China), the protein samples were separated on SDS-PAGE gels and transferred to PVDF membrane. After blocking with 1 x Buffer in TBST with Non-Fat Milk (5%), incubating with the according antibodies at 4°C overnight and incubating with the secondary antibody at room tempreture for 1 hour, the membranes with target proteins were detected with the chemiluminescent (ECL) substrate (Thermo, Waltham, MA, USA) by the Chemiluminescence Imaging System (Bio-Rad, Hercules, CA, USA). We quantified the protein bands in Image J software (NIH, Bethesda, MD, USA).
RNA extraction, Reverse transcription and quantitative real time PCR analysis
RNA was extracted with SteadyPure Quick RNA Extraction Kit (ACCURATE BIOTECHNOLOGY(HUNAN)CO.,LTD, ChangSha, China) and measured with a Nanodrop 1000 (One Drop, USA). 100 ng of total RNA of the target gene was reverse-transcribed into cDNA using Evo M-MLV RT Premix for qPCR (ACCURATE BIOTECHNOLOGY(HUNAN)CO.,LTD, ChangSha, China). The qPCR was then performed by real time detection system through SYBR Green Premix Pro Taq HS qPCR Kit III (ACCURATE BIOTECHNOLOGY(HUNAN) CO.,LTD, ChangSha, China) and Stratagene Mx3000P (Agilent Technologies, USA) systems. Every RNA sample was evaluated in three separate experiments.
Transcriptome RNA sequencing and differential expression analysis
A549 and A549/X cells were seeded overnight in 6-well plates and RNA was isolated with RNAiso Plus as described by the manufacturer. Transcriptome RNA sequencing (RNA-Seq) was performed with Illumina high-throughput RNA sequencing. The quality and integrity of RNA were detected by Agilent 2100. After enrichment, interruption, synthesis of cDNA, end repair, PCR amplification and other processes, the sequencing library was prepared for Illumina sequencing. CleanReads was aligned with the specified reference genome using hisat2 to obtain the location information on the reference genome or gene, as well as the unique sequence feature information of the sequenced sample. Using the known reference gene sequences and annotation files as a database, the expression abundance of each protein-coding gene in each sample was identified by sequence similarity comparison. The number of reads aligned to protein-coding genes in each sample was obtained using htseq-count software. DESeq2 software was used to standardize the counts of each sample gene (BaseMean value was used to estimate the expression level ), calculate the difference multiple, and use NB ( negative binomial distribution test ) to test the difference significance. Finally, the differential protein-coding genes were screened according to the difference multiple and the difference significance test results. DESeq was used for difference analysis by default for non-biological repeated samples.
Immunofluorescence analysis
Cells were seeded on 35 mm glass-bottom cell culture dish (Biosharp, China) and cultured overnight. The samples were then delivered with or without irradiation. Next, cells were washed three times with PBS, fixed with 4% of paraformaldehyde for 10 min, washed three times with PBS, permeabilized with 0.1% Triton X-100 for 20 min, washed three times with PBS, blocked with 1% bovine serum albumin in 1×PBS for 1 hour. To compare the level DNA damage, we incubated the cells with a rabbit anti-𝞬H2AX antibody (1:150, Cell Signaling Technology, Danvers, Massachusetts, USA) overnight at 4°C. The secondary antibody was FITC-conjugated goat anti-rabbit IgG (Absin, Shanghai, China). Cells were restained with Hoechst 33342(Beyotime, China). Images were obtained with Echo revolve fluorescence microscope (Echo-lab Revolve, USA) and analyzed with Image J software. Adjusted 𝞬H2AX fluorescence intensity was calculated according to the following formula: Adjusted fluorescence intensity = the integrated density of the selected region − (area of the selected region × mean fluorescence of background readings)[20, 21].
Animal tumor model
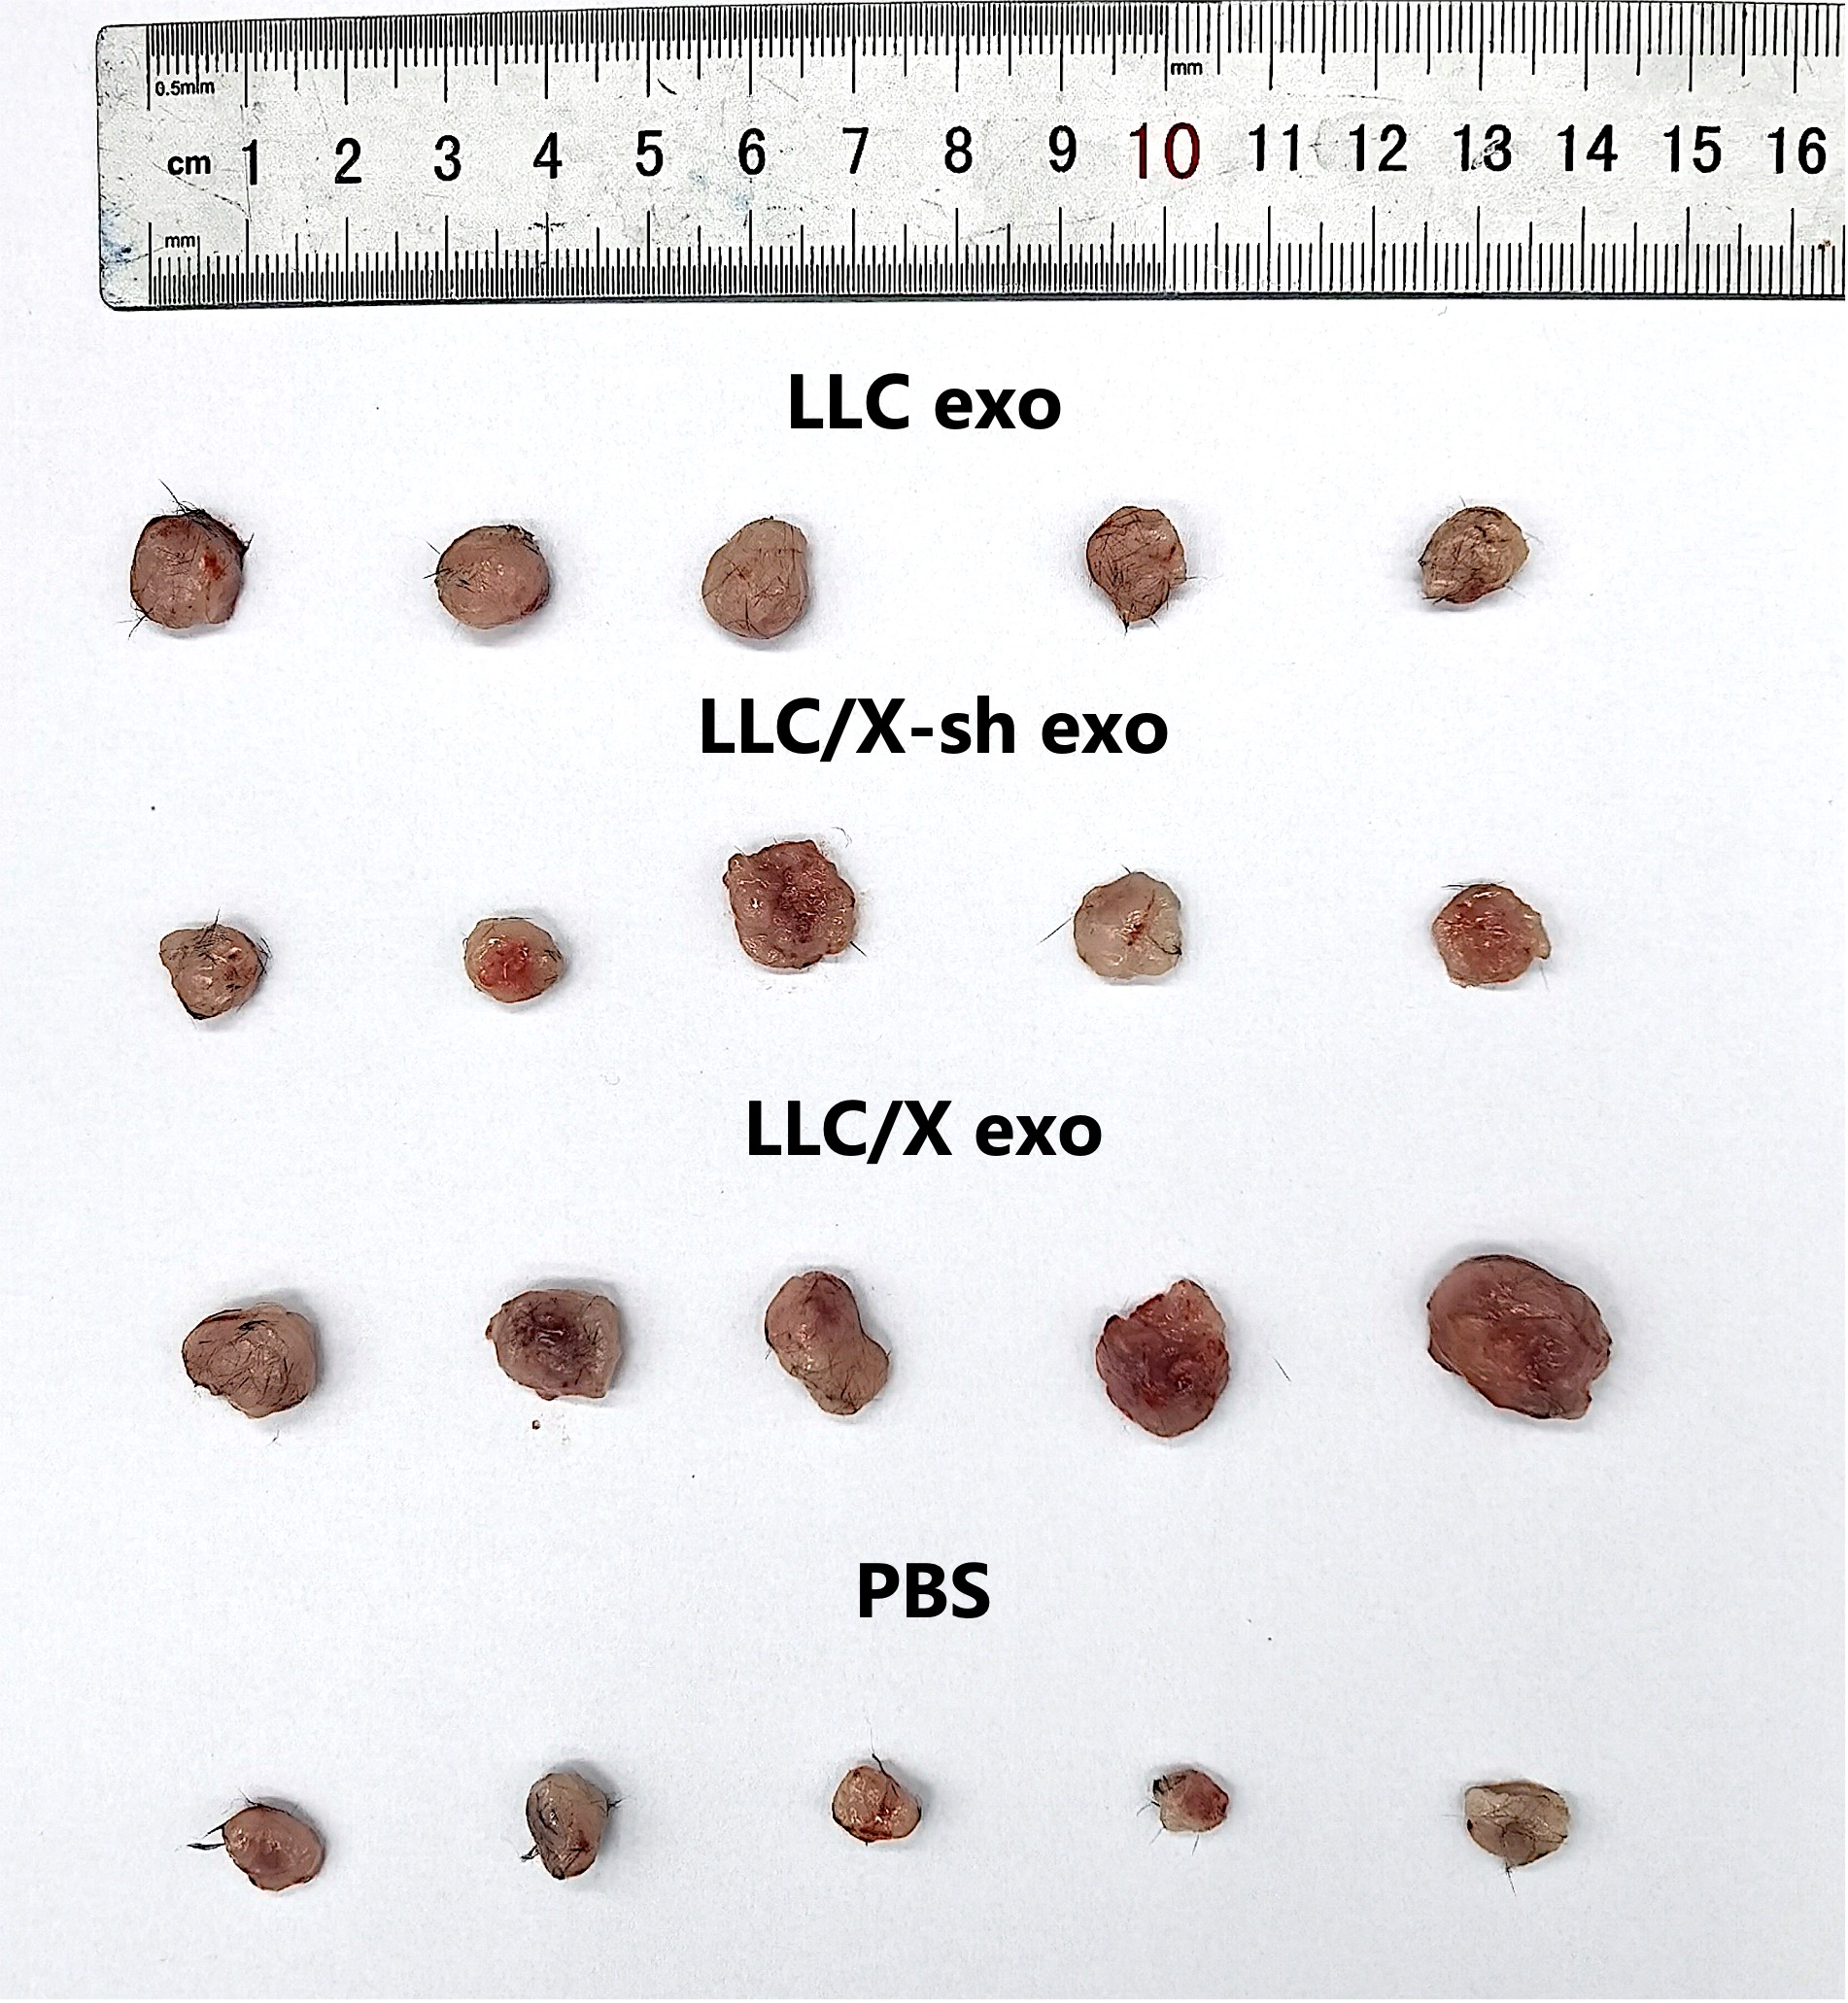
3–4 weeks, 12-15g, female, C57 mice were purchased from Shanghai SLAC Laboratory Animal Co., Ltd (SLAC, Shanghai, China). Animal experiments were conducted under the guidelines approved by the Institutional Animal Care and Use Committee of Tongji University School of Medicine and were performed according to Institutional Guidelines and Protocols First, the subcutaneous Lewis lung carcinoma (LLC) tumor model was constructed through subcutaneously injecting 3×10⁶ LLC cells, suspended in 100 µl PBS, into the right flank of C57 female mice (6–8 weeks of age).
When the tumor increased to 5–10 mm, tumor bearing mice in treatment groups were intravenous injected 20 µg/ml of exosomes derived from LLC, LLC/X, LLC/X-sh cell lines respectively. While, the tumor bearing mice in the control group were injected physiological saline solution. Then, these mice were delivered 2 Gy of irradiation per day for 5 days. We measured the longest dimension (L) and shortest dimension (W) of each tumor and weighed the mice every two days with a digital caliper and an electronic balance The volume of tumor was calculated according to the following formula: Tumor Volume (mm3) = L×W2/2. All C57 mice were sacrificed after 30 days, and tumors were harvested for flow cytometric analysis.
Flow cytometric analysis
First, the tumors were completely removed from mice and transferred to the MACS Tissue Storage Solution (Miltenyi Biotec, German) for use. Then, tumor tissues were cut into tissue blocks of about 2mm3 with scissors and incubated with 3 mL serum-free medium, 30 µl of CollagenaseIV and 30 µl of DNaseI for digestion. After tumor digestion, we transfered all the liquid and tissue blocks into the tube C and placed them on the dissociation instrument for tissue grinding, tumor cells were collected and counted, and post-processing is carried out, including dead cell processing and debris removal until dyeing requirements are met. Then the cells were stained with surface antibodies following the manufacturer’s instruments. The stained cells were detected using flow cytometry (BD Biosciences, Franklin Lakes, NJ, USA). The data were analyzed using FlowJo V10.8.
Statistical analysis
Statistical analysis was performed using GraphPad Prism version 9.0, and all experiments were repeated three times, independently. All quantitative values were expressed as mean ± standard deviation (SD) unless otherwise indicated. For comparisons between two groups, the Student’s t-test was used. While, for multiple comparisons, one-way analysis of variance (ANOVA) with Tukey’s post hoc test was used. The P value of < 0.05 was considered statistically significant. In all analysis, P values were represented as *, *p < 0.05, **p < 0.01, ***p < 0.001, ****p < 0.0001, not significant (n.s).