Various subsets of CD4 T cells express TACR1 expression
The abundance of tachykinin receptors in the gastrointestinal mucosa and submucosa has been linked to a critical role in maintaining gut homeostasis (25, 26). Our results showed that all three TAC receptors (TACR1, TACR2, and TACR3) mRNAs were expressed in the secondary lymphoid organs (spleen, mesenteric lymph nodes, and Peyer’s patches) under homeostatic conditions (Fig. 1A). Further, analysis of purified Th17 cells (CD4+ Foxp3rfp−RORγtgfp+) and natural Tregs (nTregs; CD4+ Foxp3rfp+RORγt-GFP−) in the spleen showed increased TACRs mRNA expression, whereas naïve CD4 T cells (CD4+CD25−Foxp3rfp−CD44−) and memory CD4 T cells (CD4+CD25−Foxp3gfp−CD44+) had minimal expression (Fig. 1B). To understand more details on the expression (mRNA) of TACRs on various subsets of CD4 T cell subsets (Th1, Th2, Th17, and Tregs), naïve CD4+ T cells were in vitro differentiated into various CD4 T subsets (Figure S1). Among them, Th2 cells had the highest expression of TACR mRNA among the various subsets of CD4 T cells (Fig. 1C). However, protein expression of TACR1 was highest in the cultured Th17 cells (Fig. 1D). Furthermore, TACR1 expression was also seen on the naïve CD4 T cells (CD4+CD25−CD44−CD62L+), memory cells (CD4+CD25−CD44+), Th1 (CD4+T-bet+), Th2 (CD4+GATA3+), Th17 cells (CD4+RORγt+), RORγt+Foxp3+ cells and natural Tregs (nTregs; CD4+Foxp3+) in the Peyer’s patch (Fig. 1E), and lamina propria (Figure S1B).
To understand the CD4 T cell-intrinsic metabolism of substance P, we investigated the expression of PPTA, PAM, and ACE genes in the various subsets of CD4 T cells. Among the various subsets, Th2 cells showed the highest PPTA and PAM gene expression (genes responsible for the formation of active substance), whereas Th1 cells showed low ACE expression (SP degrading enzyme) among various subsets of CD4 T cells (Fig. 1F). Together, these results suggest that Th2 cells express the highest expression of TACRs and enzymes required for SP synthesis compared to activated CD4 T cells (Th0), Th1, Th17, and Tregs. Analysis of culture supernatants showed expression of SP under various T cell differentiation conditions (Figure S1C). These findings suggest that CD4 T cells express a tachykinin system in various CD4 T cells in different lymphoid tissues.
Antagonizing the TACR1 reduces the severity and pathology of inflammatory colitis
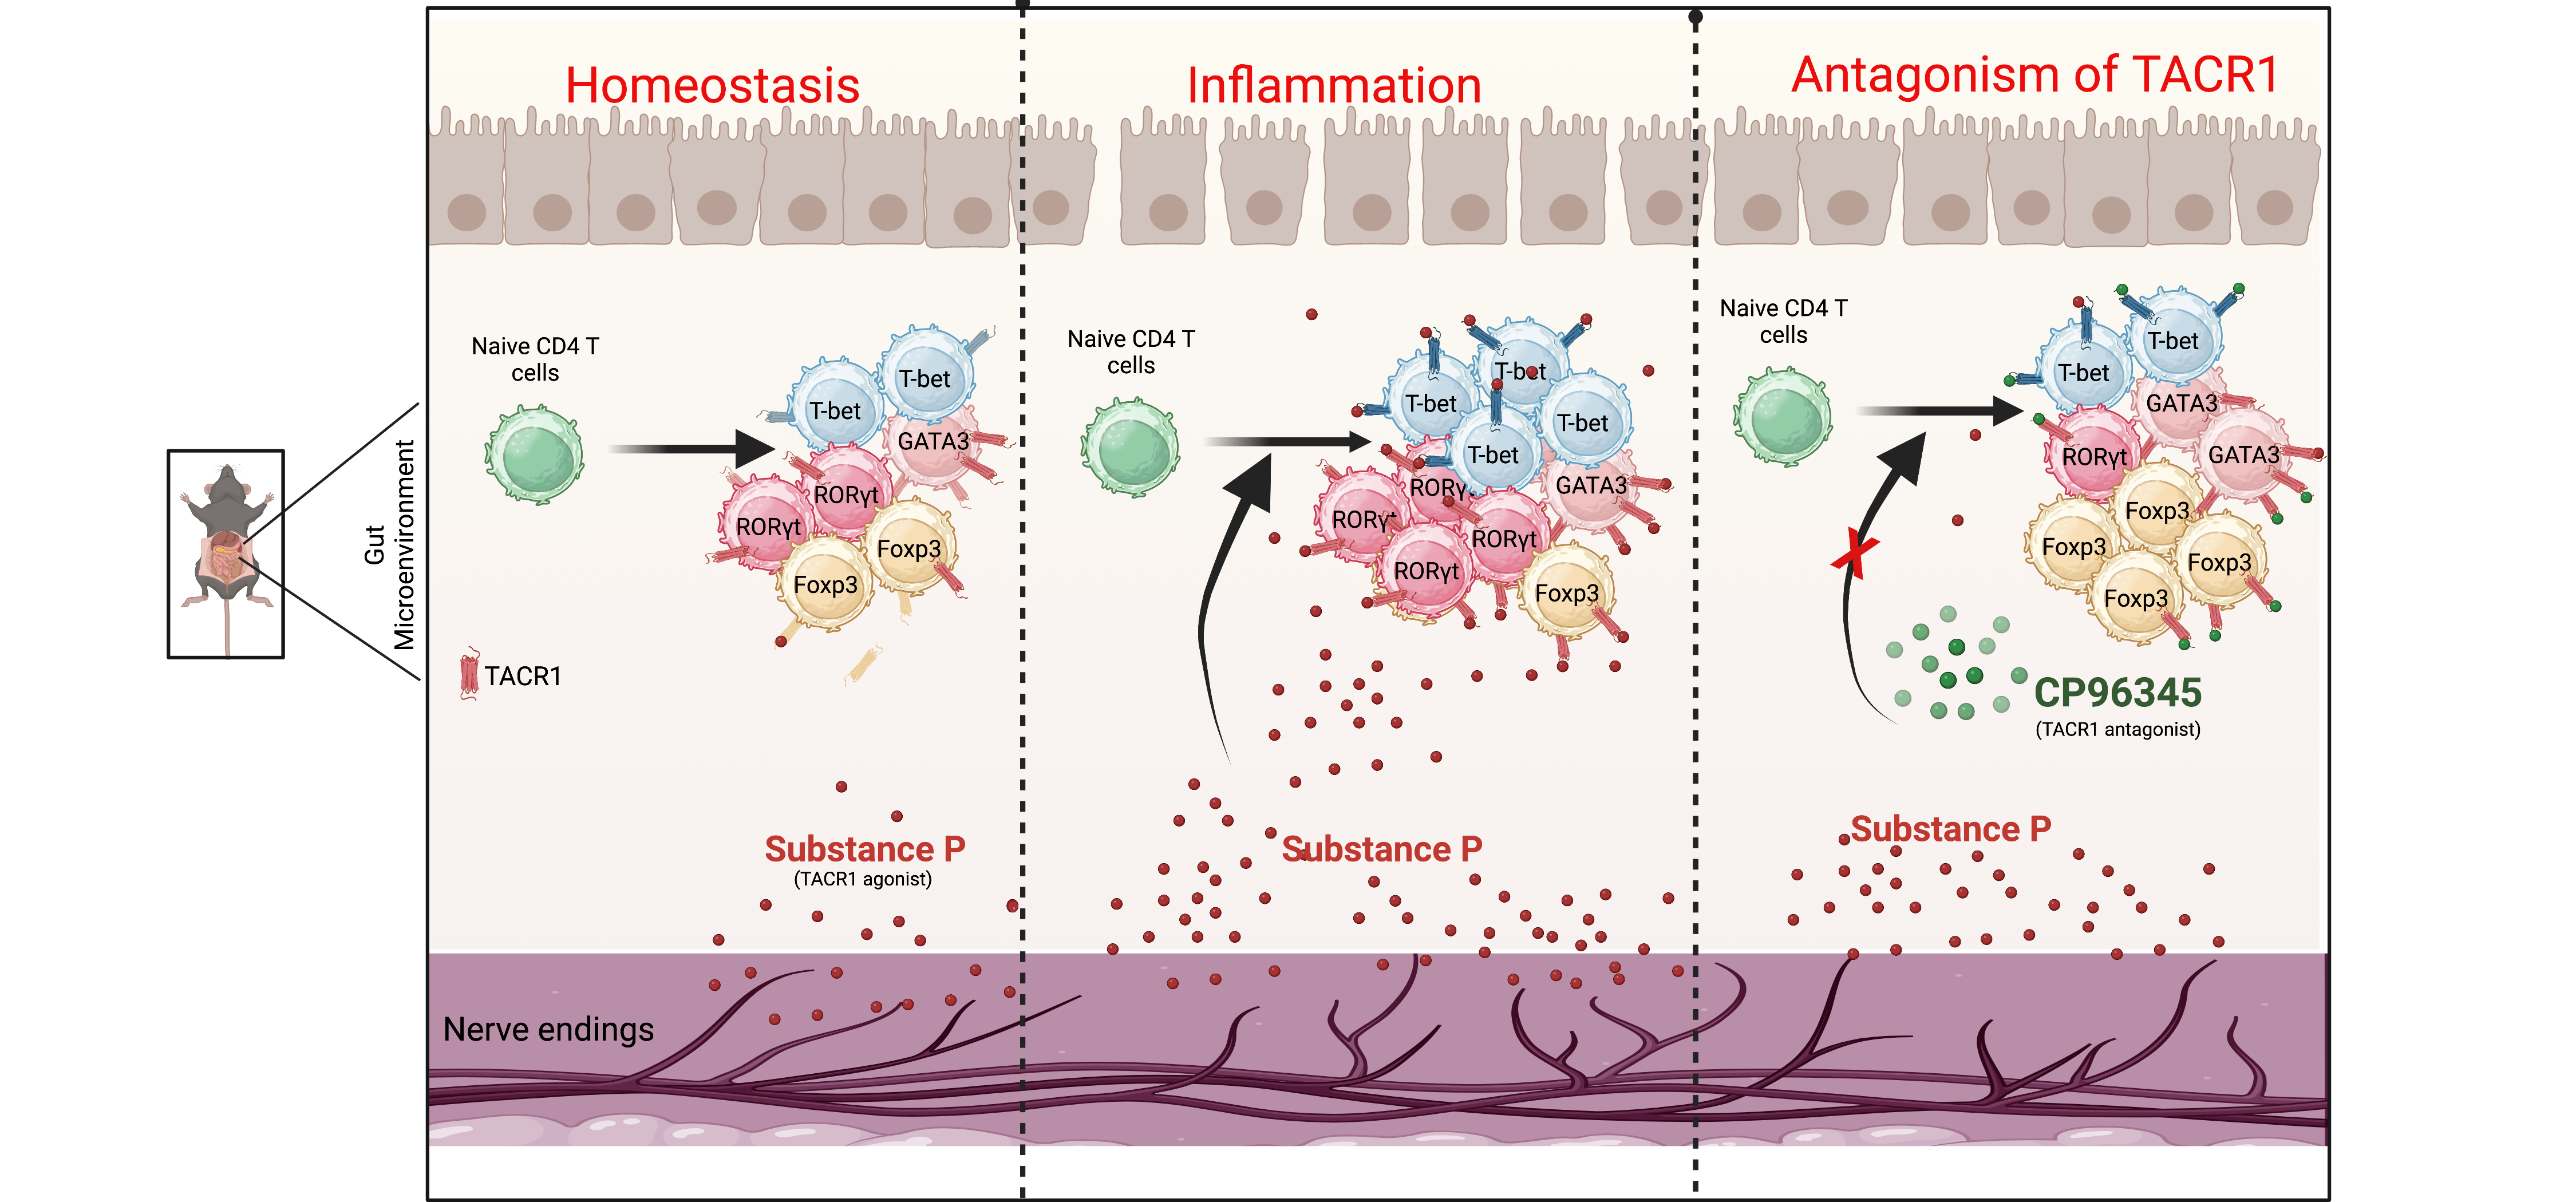
CD4 T cells play an important role in gut inflammation and autoimmunity (23, 24, 27). To understand the importance of SP in gut inflammation, C57BL/6 mice were given dextran-sodium sulfate (DSS; 2% w/v) in drinking water and injected (i.p.) TACR1-specific agonist SP [(Sar9, Met(O2)11)-Substance P (trifluoroacetate salt)] or TACR1 antagonist (CP96345) or vehicle as control, and monitored the body weight loss and disease activity index daily. Our results showed that DSS-treated mice that received SP resulted in severe body weight loss (Fig. 2A) and a significantly increased clinical disease activity index (DAI) (Fig. 2B) compared to the control group. Treatment with SP alone did not show any weight loss (Fig. 2A). To understand the effect of SP on gut inflammation, mice were given an intraperitoneal injection of TACR1-specific, a potent and non-peptide antagonist (CP-96345; 2.5 mg/kg of the mouse, twice daily) and DSS containing drinking water (28). Our results showed that injection of CP-96345 significantly reduced weight loss (Fig. 2A), disease activity index (Fig. 2B), and mortality of mice (Fig. 2C). CP96345 treatment also restored the colon length, which was reduced with DSS treatment (Fig. 2D). Histopathological examination of the colon by H&E staining showed that CP96345 treatment reduced pathology as well as infiltration of mononuclear cells (Fig. 2E). We further investigated the role of other TACRs, TACR2 and TACR3, on gut inflammation. Our results showed that the TACR2 antagonist (MEN10673) is also effective in preventing colitis in the initial stage of the disease but did not show sustained protection (Figure S2A and S2B). However, treatment with a selective TACR3 antagonist, Osanetant, did not prevent the DSS-induced gut inflammation and clinical disease activity index (Figure S2C and S2D). Furthermore, to understand the expression profile of TACRs in the colon of inflammatory bowel disease (IBD) patients, irritable bowel syndrome (IBS) patients, or in non-IBD/IBS control individuals, colonic biopsy were collected, and expression of TACR1, TCAR2 and TACR3 expression was analyzed using qRT-PCR. Our data showed that patients with gut inflammation (IBD and IBS) had higher expression of TACR1 and TACR2 mRNA (Fig. 2F). Expression of TACR3 mRNA was not detected in the colonic biopsies (data not shown). Together, our results showed that TACR1 is the most effective among different tachykinin antagonists, followed by TACR2 antagonists in the early stage of gut inflammation. However, TACR3 antagonism did not show any effect on colitis in mice.
DSS-induced gut inflammation shows increased TACR1 expression on CD4 T cells.
Since TACR1 antagonism significantly controls gut inflammation, we further investigated the expression of TACR1 on various subsets of CD4 T cells. C57BL/6 mice were given DSS in drinking water, and on day 10, expression of TACR1 was monitored on various subsets of CD4 T cells in the spleen, lymph nodes, Peyer’s patch, and colon tissues. DSS-induced inflammation increased the expression of various TACRs mRNA in the spleen and mLN (Fig. 3A). Furthermore, gut inflammation significantly increases the TACR1 expression in Th1, Th2, Th17, and Tregs in the spleen, mesenteric lymph nodes (mLN), and Peyer's patches (Fig. 3B and Figure S3). Interestingly, in Peyer's patch, mice treated with DSS and CP96345 had reduced TACR1 expression in Th1, Th2, and Th17 cells (Fig. 3C). Immunohistological analysis of the spleen showed that TACR1 expression increased significantly with DSS treatment, and its expression was significantly reduced with CP96345 treatment (Fig. 3D, upper panel). In the colon, DSS treatment increased the TACR1 expression (Fig. 3D, middle panel) and SP levels (Fig. 3D, bottom panel). Expression of these molecules was significantly reduced with CP96345 treatment in the tissues (Fig. 3D). Together, these results showed that DSS-induced gut inflammation increases the TACR1 and SP expression in the colon, which is reduced by antagonizing the TACR1, suggesting the importance of SP and TACR1 expression in gut inflammation.
Antagonizing TACR1 reduces subsets of inflammatory Th17 cells and promotes Foxp3 + Tregs in colitis. Since TACRs are expressed on various subsets of CD4 T cells, we investigated how TACR1 antagonist modulates the various phenotypic profiles of the CD4 T cells during gut inflammation. To explore this, mice were given DSS in drinking water with or without TACR1 antagonist and, after ten days, monitoring the alteration in the various subsets of CD4 T cells in the spleen, Peyer’s patches, and lamina propria using multicolor spectral flow cytometry. Uniform manifold approximation and projection of dimensional reduction (UMAP) analysis of 11,657 recovered CD4+T cells from Peyer’s patches showed 15 distinct clusters (Fig. 4A). Cluster 4 (CD44midRORγtmidT-betmidCD4high), cluster 6 (CD44highRORγthighCD4high), cluster 10 (CD44midRORγtmidT-betmidCD4high), and cluster 11 (CD44highRORγthighCD4high) representing the inflammatory Th17 CD4 T cells populations, were significantly increased in DSS-treated mice, whereas these were reduced with TACR1 antagonist treatment (Fig. 4A-4C). Cluster 8 (CD4+CD25highFoxp3midCD73highCD62LmidLAP1midGITRhigh population), representing a unique subset of Tregs, was significantly reduced with DSS treatment compared to the control group (Fig. 4A-4C). The detailed phenotype of various CD4 T cell clusters and their phenotypes are given as a heatmap (Fig. 4C). The frequency of total Th1 (CD4+T-bet+), Th2 (CD4+GATA3+), Th17 (CD4+RORγt+), and Tregs (CD4+Foxp3+) did not show any significant change in the spleen (Figure S4). In contrast, Peyer’s patch showed a significantly increased frequency of CCR7+RORγt+CD4+ T cells in the DSS-treated group, and this was significantly reduced with TACR1 antagonist treatment (Fig. 4D). In DSS-treated mice, the CD4+CD44+ cells exhibited increased expression of RORγt and T-bet expression, and these cells were significantly reduced with TACR1 antagonist treatment (Fig. 4D). There were no significant alterations in the CD4+RORγt+Foxp3+ cells (Figure S5A, upper panel); however, expression of TACR1 was significantly enhanced during DSS-induced inflammation, and it was reduced with TACR1 antagonist (Figure S5A, lower panel). In the Peyer’s patch, DSS treatment significantly decreased the frequency of CD4+Foxp3+ Tregs, which was increased considerably with TACR1 antagonist treatment (Fig. 4D).
Various molecules are known to promote the regulatory function of CD4 T cells (29, 30). Since antagonism of TACR1 promotes Tregs and suppresses gut inflammation, we investigated the expression of various important molecules present on the CD4+Foxp3+ Tregs such as CD73, GITR, PD-1, PDL-1, CTLA4, CD62L, Helios, and LAP-1. Uniform Manifold Approximation and Projection of Dimension Reduction (UMAP) analysis of 2697 Foxp3+CD4+ Tregs showed 15 phenotypic clusters/populations (Fig. 4E left panel and Fig. 4F). Cluster 13 represents LAP1highCD62LhighCD73high expressing Foxp3+CD4+ Tregs and were significantly increased with TACR1 antagonist treated mice (Fig. 4E). A heat map of the expression of each marker in each cell cluster/population was shown (Fig. 4F). Further, our data showed a significantly increased CD73, CD62L, and LAP1 expression with TACR1 antagonist treatment on CD4+Foxp3+ Tregs in the Peyer’s patch (Fig. 4G). At the same time, expression of CD25, CTLA4, GITR, Helios, and PD-L1 molecules did not show any significant change on CD4+Foxp3+ Tregs in the Peyer’s patch in the different treatment groups (Figure S5B). Further, analysis of CD4+Foxp3+ Tregs showed that follicular regulatory T cells (CXCR5+PD-1+CD4+Foxp3+) (31) in the Peyer’s patch were significantly increased with TACR1 antagonist treatment (Figure S6A). CD4 T cells in the lamina propria showed increased expression of IL-17A as well as IL-17A+IFNγ+, and secretion of these inflammatory cytokines was reduced with TACR1 antagonist treatment (Fig. 4H). However, no change was observed in the IL-10+ and TNF-α+ CD4 T cell frequency (Figure S6B). The changes in the frequency of various cytokines (IL-10, IL-17A, IFN-γ and TNF-α)-producing CD4 T cells were not observed in the spleen and mLN between DSS and DSS plus TACR1 antagonist groups (Figure S7). Together, these results suggest that TACR1 antagonist treatment induces a complex set of regulatory CD4 T cells, inhibits the effector/inflammatory CD4 T cells in the Peyer’s patch, and controls gut inflammation.
Antagonizing TACR1 signaling in naïve CD4 T cells promotes Foxp3 + Tregs.
To investigate if TACR1 specifically alters the CD4 T cell differentiation through an intrinsic signaling mechanism, naïve CD4 T cells were in vitro differentiated into Th1, Th2, Th17, and Treg cells in the presence or absence of SP or TACR1 antagonists, and monitored the differentiation of various CD4 T cell lineages. Our results showed that agonizing the TACRs with SP promoted the differentiation of Th1 cells (marked by T-bet expression) and Th17 (characterized by RORγt expression), whereas antagonizing TACR1 receptor promoted the differentiation of Th2 (marked by GATA3 expression) and Treg cells (marked by FoxP3 expression) (Fig. 5A). TACR1 antagonist alone in the absence of TGF-β did show alteration in the expression of Foxp3 (Figure S8A). In the presence of TGF-β, the TACR1 antagonist showed a dose-dependent differentiation of Foxp3+ Tregs (Figure S8B). TACR1 agonist alone or when combined with equal molar concentration of TACR1 antagonist did not show any effect of TACR1-antagonist induced Foxp3+Treg differentiation (Figure S8C). Interestingly, antagonizing TACR1 signaling during CD4 T cell differentiation inhibited the IL-17A secretion in Th17 cells and increased the IL-10 secretion in Foxp3+ Tregs (Fig. 5B and 5C). Further, TACR1-induced increased differentiation of Tregs was not due to increased secretion of IL-10 or TGF-β in the culture, as neutralization of these molecules with anti-IL-10 mAb or anti-TGF-β mAb did not alter the TACR1-induced differentiation of Tregs (data not shown).
To understand the similar effect of TACR1 signaling operating in the differentiation of human Foxp3+Tregs, naïve human CD4 T cells were purified from healthy human PBMCs and in vitro differentiated in Treg lineage in the presence or absence of TACR1 agonist (SP) or antagonist (CP). Our results showed that the TACR1 antagonist also promotes Foxp3+Treg differentiation of human CD4 T cells (Fig. 5D). Together, these results showed that TACR1 signaling in CD4 T cells facilitates the differentiation of Foxp3+Tregs and suppresses the differentiation of pathogenic Th17 cells.
TACR1 antagonism promotes potent suppressive Tregs.
We further investigated if increased differentiation of Treg with TACR1 antagonism is also associated with a more potent suppressive function of Foxp3+ Tregs. To test this, naïve CD4 T cells (CD4+CD44−CD25−Foxp3gfp− T cells) were differentiated into Foxp3gfp+ iTregs in the presence of TACR1 agonist or antagonist. The TACR1 antagonist-treated Tregs showed the significantly increased expression of LAP-1, PDL-1, CD62L, helios, and CD73 molecules compared to control Treg or SP-treated Tregs (Fig. 6A). Further, in vitro-differentiated Foxp3gfp+ iTregs were sorted, and their suppressive function was evaluated by monitoring the proliferation of Cell-Trace violet (CTV)-labeled effector CD4 T cells. Our results showed that Tregs differentiated in the presence of TACR1 antagonist showed a significant and potent suppressive function compared to control Tregs, agonist-treated iTregs, or nTregs (Fig. 6B and Figure S9A). Furthermore, in the co-culture conditions, CP-treated nTreg (Foxp3-eGFP+ cells) induces the differentiation of naïve CD4 T cells (Foxp3-RFP− cells) into Foxp3-RFP+ iTregs in the presence of only α-CD3e and α-CD28 monoclonal antibodies (Figure S9B). Our data strongly suggest that CP-induced iTregs and CP-treated nTreg have strong suppressive potential and convert naïve CD4 T cells into the iTreg, driving better immunosuppressive function.
We further examined the suppressive capacity of TACR1 antagonist-treated iTreg in a mouse inflammation model. Naïve CD4 T cells (CD4+CD44−CD25−Foxp3gfp− cells) were isolated from Foxp3gfp-transgenic mice spleen using flow cytometry, and these cells were in vitro differentiated into iTreg in the presence or absence of TACR1 antagonist or agonist. These iTregs (CD4+CD25+Foxp3gfp+ cells) were sorted using flow cytometry and used for adoptive transfer, as shown in the experimental strategy (Fig. 6C). Splenic naïve CD4 T cells (CD4+CD25−CD44−CD45RBhiFoxp3rfp− cells) were purified from Foxp3rfp transgenic mice using flow cytometry sorting and used for adoptive transfer to induce inflammatory model in mice. NRG mice (RAG1−/−IL-2Rγ−/− mice; lack T cells, B cells, and NK cells) were given an intravenous injection of purified naïve CD4 T cells (CD4+CD25−CD44−CD45RBhiFoxp3rfp− cells) alone or along with cultured iTregs (CD4+CD25+Foxp3gfp+) (Fig. 6C). NRG mice that received naïve CD4 T cell alone showed inflammation in the skin and 20% mortality in 3 weeks (Figs. 6D-6F). NRG mice that received naïve CD4 T cells together with TACR1 agonist-treated (SP-treated) Tregs showed strong skin inflammation and severe weight loss, and all mice died in 4 weeks. Mice who received control iTregs had mild skin inflammation and no mortality. In contrast, mice receiving TACR1-antagonist Tregs did not show skin inflammation or weight loss, and all mice survived (Figs. 6D-6F and S9C). TACR1 agonist treatment also protected IL-23-induced psoriasis in the C57BL/6 mice (data not shown). These data suggest that Foxp3+Treg induced by TACR1 antagonist protects the immunocompromised mice from gut and skin inflammation.
To understand the molecular alteration of adoptively transferred Tregs in the NRG mice, animals were sacrificed on day 28, and splenic CD4 T cells were analyzed using multicolor spectral flow cytometry. UMAP analysis of total splenic CD4 T cells in NRG mice between control iTregs or TACR1-antagonist-iTregs injected groups showed that CD4 T cells form 15 different discrete phenotypic clusters (Figs. 6G and 6H). Some clusters (6, 10, 12, and 14) expressed Foxp3rfp and were significantly reduced in the iTreg group (Fig. 6G, right panel). Cluster 15 represents what is significantly altered in CP-treated iTreg, having a mixer of Foxp3gfp+ iTreg subset (represents transferred iTreg) and Foxp3rfp+ iTreg (differentiated from the naïve CD4 T cells). Since we adoptively transferred naïve CD4 T cells isolated from Foxp3-rfp transgenic mice and transferred iTregs from the Foxp3gfp transgenic mice, we faithfully monitored the differentiation of naïve Foxp3rfp− CD4 T cells into Foxp3rfp+ Tregs in NRG mice that received either control iTregs or TACR1 antagonist-iTregs. Our data showed that not only TACR1-treated Tregs (Foxp3gfp+ cell) frequency in NRG mice were significantly higher, but it also converted a significant proportion of Foxp3rfp− naïve CD4 T cells into Foxp3rfp+ iTregs (Fig. 6I). Compared to control Tregs, TACR1-treated iTregs maintained significantly higher expression of Foxp3gfp, CD25, CD44, CD62L, CD73, CCR6, and CCR7 levels in the NRG mice. (Fig. 6J). Further, NRG mice that received the TACR1-antagonist-treated iTreg had increased infiltration of Foxp3rfp+ cells in the skin compared to only naïve CD4 T cells or Tregs (Fig. 6K). Together, these results suggest that iTregs differentiated in the presence of TACR1-antagonist are more stable, potent suppressive phenotype and protect from the inflammatory response induced by effector CD4 T cells in the skin and gut.