Human immortal keratinocyte cells (HaCaT) are induced with UVB to establish an injury model, which is used as the basis to investigate whether oat bran fermentation broth (OBF) has reparative effect on skin inflammation and damage to the skin barrier due to UVB irradiation. The results show that compared with unfermented oat bran (OB), OBF has higher structural homogeneity, and increased molecular weight size, active substances content and in vitro antioxidant activity. OBF has a scavenging effect on excess ROS and increases the intracellular levels of antioxidant enzymes. In addition, it was found that OBF has a stronger inhibitory effect on the release of inflammatory factors than OB, and increase the synthesis of AQP3 and FLG proteins, and decrease the secretion of KLK-7. OBF can inhibit the transcription level of inflammatory factors by inhibiting the JAK/STAT signaling pathway. Safety experiments show that OBF has a high safety profile.
Research Article
Reparative Effects of Schizophyllum commune Oat Bran Fermentation Broth on UVB-induced Skin Inflammation via the JAK/STAT Pathway
https://doi.org/10.21203/rs.3.rs-4147365/v1
This work is licensed under a CC BY 4.0 License
Journal Publication
published 25 Jul, 2024
Read the published version in Bioresources and Bioprocessing →
You are reading this latest preprint version
oat bran
Schizophyllum commune
skin inflammation
JAK/STAT pathway
Oat (Avena sativa L.) is an ancient crop that is widely grown around the world and has been cultivated for more than 2,000 years (Wang et al. 2022). The processing of oats produces a large number of by-products such as oat bran. Oat bran contains various chemical substances such as dietary fiber, vitamins, proteins, polysaccharides, phenolic compounds and other active ingredients (Khider et al. 2022) which give it many physiological and pharmacological activities including anti-inflammation, antioxidation, liver health protection, cardiovascular disease risk reduction and so on (Zhang et al. 2023). Due to its good nutritional function and high safety, oat bran is currently widely used in the food, medicine and cosmetics industries (Singh et al. 2013).
The polyphenols contained in oats are mainly found in the outer layer of the kernel, usually in a bound state, and it has been shown that the content of polyphenolic compounds in oat bran is closely related to its antioxidant capacity. The high content of polysaccharides in oat bran makes it useful for lowering cholesterol, regulating glucose absorption and preventing cardiovascular diseases, and the in vitro antioxidant capacity and free radical scavenging abilities of oat bran polysaccharides are enhanced after ultrafine milling treatment (Liu et al. 2016). The large amount of inositol hexaphosphate contained in oat bran is one of the main reasons limiting its efficient utilization, and the fermentation process can lead to the degradation of inositol hexaphosphate, which can help to achieve the high value utilization of oat bran (Kumar et al. 2019).
Schizophyllum commune (S. commune) is a fungus of Schizophyllaceae and Schizophyllum, also known as white ginseng, chicken hair fungus and white flower. It is widely distributed, can inhabit dead logs and usually grows abundantly in the rainy season (Almasi et al. 2019). S. commune is a kind of edible and medicinal fungus which contains many bioactive ingredients (Wirth et al. 2021). It is a multifunctional fungal cell factory which can produce various metabolites such as hydrolase, bioethanol and biosurfactant, as well as cellulase, pectinase and other enzymes to carry out the hydrolysis of cellulose, hemicelluloses and lignin (Debnath et al. 2022). The fermented grains of S. commune can effectively reduce cellular oxidative stress damage caused by UVA irradiation and H2O2 induction through the PI3K-AKT signaling pathway (Cheng et al. 2023).
The JAK/STAT pathway is required for intracellular cytokine signaling mediated by Type I and II cytokine receptors (Chapman et al. 2022). It involves two protein families, Janus protein tyrosine kinases (JAKs) and signal transducers and activators of transcription proteins (STATs) (Tu et al. 2011). JAK is an intracellular upstream signaling pathway. When it is activated and phosphorylated, STATs are activated, and STAT monomers dissociate from docking sites, dimerize and translocate to the nucleus where they interact with specific DNA-binding elements to regulate multiple target genes (Masullo et al. 2014). SOCS molecules are a class of endogenous cytokine-dependent signaling inhibitors. In order to limit inflammatory cytokine overstimulation, keratinocytes express SOCS molecules. At the molecular level, SOCS1 and SOCS3 can act as pseudo-substrates exerting an inhibitory effect on JAK1 and JAK2, which in turn prevents the activation of STATs (Morelli et al. 2018). It has been shown that ROS is an effective inducer of JAK-STAT signaling pathway activation, and aloe-emodin can inhibit the activation of the JAK1-STAT1/3 pathway by scavenging excessive ROS, thereby inhibiting the nuclear translocation of STAT1/3 in RAW 264.7 cells and alleviating the inflammatory response caused by LPS induction (Wang et al. 2020).
In general, a dynamic equilibrium is maintained between the production and removal of reactive oxygen species (ROS) in the body, but when exposed to large amounts of UVB irradiation for a long period of time, excessive ROS are generated, which not only leads to the peroxidation of macromolecules in the cells and induces severe oxidative damage, but may also activate apoptosis-related signaling pathways and promote programmed cell death (Liu et al. 2018). In addition, excessive UVB exposure induces the production of inflammatory intermediates which in turn leads to skin inflammation (Martinez et al. 2015). When the skin is in an inflammatory state, its barrier function is disrupted, leading to easier access to harmful substances and further deepening skin inflammation.
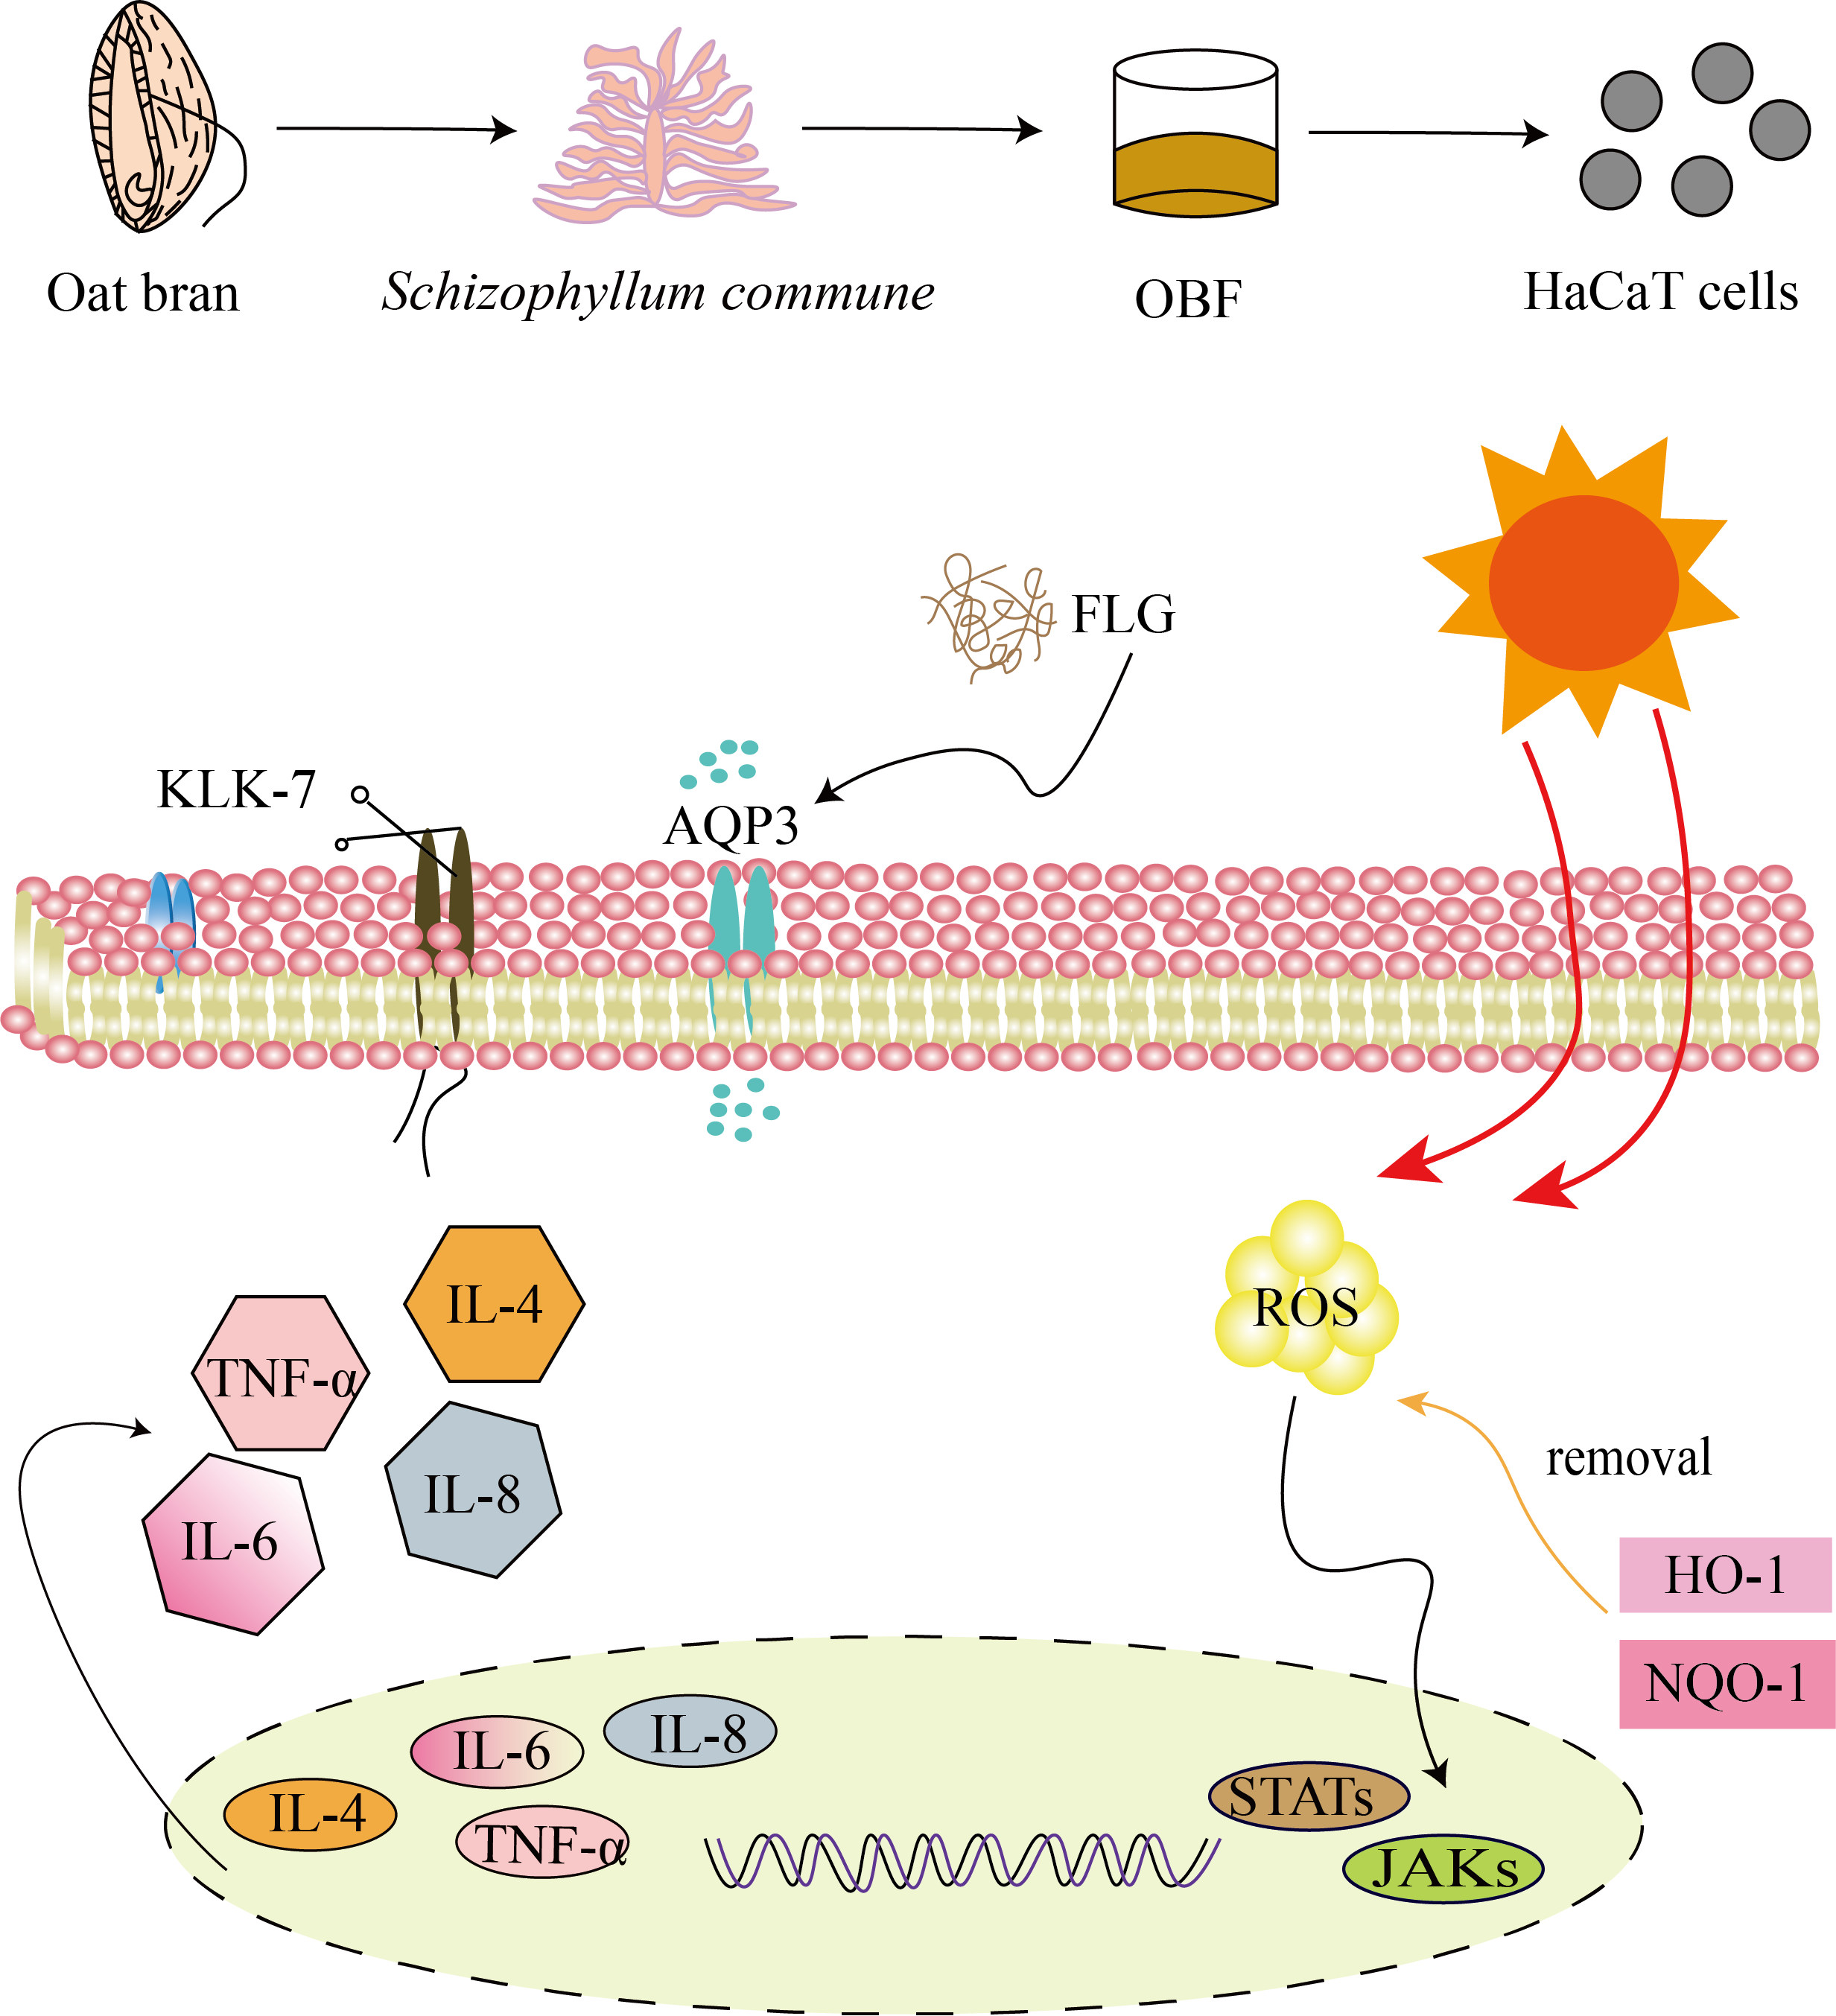
In this study, as shown in Fig. 1. We chose to utilize S. commune to ferment oat bran (OBF). First, the effects of S. commune fermentation on the physical properties, active substance content and in vitro antioxidant capacity of oat bran were investigated. Subsequently, we established a cell injury model using UVB irradiation of HaCaT cells, we measured cell viability using the CCK8 assay, we explored cell migration ability based on selected sample concentrations, and we determined the effects of the samples on the cellular oxidative stress state, inflammatory state, and barrier function, which in turn allowed us to investigate whether OBF has a reparative effect on UVB-induced inflammation and barrier damage. Finally, we performed experiments at the molecular level to investigate the effects of the JAK/STAT pathway on the reparative effects of OBF on UVB-induced skin inflammation, then tested the safety of OBF using the chicken embryo chorioallantoic membrane test and red blood cell hemolysis test.
2.1 Materials
Schizophyllum commune (strain number: CGMCC40388, Center for General Microbiology, China Microbial Strain Preservation and Management Committee, China); Human immortal keratinocyte (HaCaT) cells (Cell Resource Center of Peking Union Medical College); sodium carbonate, rutin standard, sodium nitrite, aluminum nitrate, anhydrous ethanol and copper sulfate (Sinopharm Group); Cell Counting Kit-8 (Biorigin); DMEM medium and pancreatin (GIBCO Life Technologies); ROS detection kits (Beyotime); qRT-PCR instrument (QuanStudio 3, Thermoscientific).
2.2 Preparation of OBF
Oat bran was crushed and passed through a 100 mesh sieve. 300 mL of deionized water and 3 g of oat bran were mixed evenly, sterilized in a 121℃ autoclave for 20 min and cooled to room temperature (rt). S. commune solution was added for fermentation and the mixture was cultivated in a 28℃ constant temperature oscillator for 48 h, rotated on a shaking table at 180 r/min, cooled to rt and centrifuged at 4800 r/min for 25 min. The supernatant was then taken to obtain OBF. Oat bran unfermented broth (OB) was obtained according to the same pretreatment method as OBF without the addition of S. commune.
2.3 GPC and SEM
The molecular weight sizes of OBF and OB were determined by the gel permeation chromatography-laser light scattering in line (GPC-LS-IR) method, and the morphological characteristics of the two samples, OBF and OB, were determined using an FEI Nova Nano SEM 450 instrument.
2.4 Determination of OBF active substance content
2.4.1 Total phenols
The content of total phenolic compounds in OBF was determined by the Folin-Phenol method (Fang et al. 2023).
2.4.2 Total sugars
A Total Sugar Content Detection Kit (Suolaibao Biotech Co., Ltd., BC2710) was used to detect the total sugar content in the samples.
2.4.3 Total proteins
A BCA Protein Content Assay Kit (Biorigin, BN27109) was used to measure the total proteins content in OBF and OB.
2.5 Determination of OBF in vitro antioxidant activity
2.5.1 DPPH free radical scavenging experiment
DPPH was accurately weighed 8 mg and diluted in 100 mL of anhydrous ethanol.
A1: 1 mL of sample solution and 1 mL of DPPH solution
A2: 1 mL of distilled water and 1 mL of DPPH solution
A3: 1 mL of sample solution and 1 mL of distilled water
The solution was mixed well and the OD517 was measured after 30 min of reaction protected from light.
Scavenging capacity of samples for DPPH radicals % = [(A2-A1 + A3)/A2]×100%
2.5.2 Hydroxyl radical scavenging experiment
8.0 mmol/L of FeSO4 solution, 3.0 mmol/L of salicylic acid solution and 0.02 mmol/L of H2O2 solution were prepared.
A1: 0.3 mL of FeSO4 solution, 1 mL of salicylic acid solution, 1.45 mL of deionized water and 0.25 mL of H2O2
A2: 0.3 mL of FeSO4, 1 mL of salicylic acid, 1 mL of sample solution, 0.45 mL of deionized water and 0.25 mL of H2O2
A3: 0.3 mL of FeSO4, 1 mL of sample solution, 1.45 mL of deionized water and 0.25 mL of H2O2
The reaction was carried out in a water bath at a temperature of 37℃ for 1 h, the tubes were determined the OD510.
Scavenging capacity of samples for Hydroxyl radicals % = [A1-(A2-A3)/A1]×100%
2.5.3 Total antioxidant capacity determination
The total antioxidant capacity of OBF was determined using ABTS kit and FRAP kit.
2.6 Cell culture and viability determination
DMEM serum medium was prepared using fetal bovine serum (10%) and penicillin-streptomycin (1%). HaCaT cell suspensions were added in 96-well plates (Thermoscientific) at 100 µL volume per well (8×10³-1.2×10⁴ cells). UVB damage modeling of HaCaT cells was established using UV crosslinker. The 96-well plates were then exposed to UVB irradiation conditions of 20 mJ/cm2 for 40 s. The control group did not undergo UVB irradiation. The CCK8 method was used to study the cytotoxicity of OBF and its role in repairing UVB damage. The OD450 was measured using an enzyme labeling instrument.
Cell viability= (sample group OD-acellular group OD)/(control group OD-acellular group OD)×100%
2.7 Cell migration capacity assay
In a 6-well plate, 7×10⁵-8×10⁵ cells were spread in each well, 2 mL of serum medium was added and the plates were incubated in an incubator for 24 h. HaCaT cells growing adherent to the wall at the bottom of the 6-well plate were scratched with the tip pf the 200 µL pipette gun. After washing the plate, 1 mL of PBS was added and pictures were taken with a fluorescence microscope (Jiangnan Instrument Factory Co.), after which the HaCaT were irradiated with UVB at a dose of 40 mJ/cm2 for 80 s, while no UVB irradiation was performed in group C. Different concentrations of samples were added to the 6-well plates and they were incubated in an incubator for 24 h. After 24 h, the 6-well plates were taken out and washed, 1 mL of PBS was added, and the plates were photographed with a fluorescence microscope.
2.8 ROS content determination
The effects of OBF on the ROS level in cells were verified in this experiment. 6-well plates were spread with 5×10⁵ cells per well. The fluorescent probe DCFH-DA was used for the detection of ROS, and the specific experimental operation was carried out according to the instruction manual.
2.9 Enzyme-linked immunosorbent assay (ELISA)
The 6-well plates were spread with 50×104 cells per well and the supernatant was collected. The plates were washed three times, 200 µL of cell lysate was added to each well, and shaking was performed to encourage the cells to be lysed. The cells at the bottom of the plates were then collected with a cell spatula and centrifuged with the collected supernatant. The precipitate was then discarded and the remaining samples were used for the subsequent assay of the kit.
2.10 qRT-PCR
Total RNA was extracted with Trizol and First Stand cDNA and manipulated for reverse transcription. Primer sequences for the desired genes were designed using PrimerExpress software. The experimental results were observed using a qRT-PCR instrument and analyzed. The reverse transcription system is shown in Table 1. The primer sequence list are shown in Table 2 (F: forward primer, R: reverse primer). The qRT-PCR reaction system is shown in Table 3.
|
Name of reagent |
Volume (µL) |
|---|---|
|
Anchored Oligo (dt) 18 Primer |
1.0 |
|
2×ES reaction Mix |
10.0 |
|
Total RNA |
2.0 |
|
EasyScript RT/RI Enzyme Mix |
1.0 |
|
Gdna Remover |
1.0 |
|
Rnase-free Water |
5.0 |
|
Gene |
Direction |
Primer (5’−3’) |
|---|---|---|
|
Beta-actin |
F |
CTGAAGCCCCACTCAATCCA |
|
R |
GCCAAGTCAAGACGGAGGAT |
|
|
TNF-α |
F |
TCTCCTTCCTGATCGTGGCA |
|
R |
CAGCTTGAGGGTTTGCTACAAC |
|
|
IL−4 |
F |
TCTTTGCTGCCTCCAAGAACA |
|
R |
GTTCCTGTCGAGCCGTTTCA |
|
|
IL−6 |
F |
TTCTCCACAAGCGCCTTC |
|
R |
AGAGGTGAGTGGCTGTCTGT |
|
|
IL−8 |
F |
GGAGAAGTTTTTGAAGAGGGCTG |
|
R |
ACAGACCCACACAATACATGAAG |
|
|
FLG |
F |
TGAGGCATACCCAGAGGACT |
|
R |
CTGTATCGCGGTGAGAGGAT |
|
|
AQP3 |
F |
CTTCTTTGACCAGGACCGGC |
|
R |
GGGCCAGCTTCACATTCTCT |
|
|
KLK−7 |
F |
TCAGATCCTCTCGAGCCCAG |
|
R |
CAGGTGCACGGTGTACTCAT |
|
|
JAK1 |
F |
GCATCGAGCGCACAAAGTTA |
|
R |
GCTACTTCAGAGAAGCGTGTG |
|
|
SOCS1 |
F |
CACTTCCGCACATTCCGTTC |
|
R |
GCATCCCAGTTAATGCTGCG |
|
|
STAT1 |
F |
GGGATACACCAGTGCACAGAA |
|
R |
CGTACCACTGAGACATCCACA |
|
|
STAT3 |
F |
CATCCTGAAGCTGACCCAGG |
|
R |
AGGTGAGGGACTCAAACTGC |
|
Name of reagent |
Volume (µL) |
|---|---|
|
Template |
1.5 |
|
Forward Primer (10 µM) |
0.4 |
|
Reverse Primer (10 µM) |
0.4 |
|
2×TransStart® Top Green qPCR Supermix |
10.0 |
|
Passive Reference Dye (50×) |
0.4 |
|
Nuclease-free Water |
7.3 |
2.11 Safety evaluation of OBF
2.11.1 Chicken embryo chorionic allantoic membrane eye irritation test (HET-CAM)
Fertilized eggs were incubated in a incubator at 37°C and 55% humidity for 9–10 days, and then photographs were taken to determine the location of the air chambers in the fertilized eggs. 0.9% NaCl solution and 0.1 mol/L NaOH was used as negative control and positive control in place of the samples. The egg shell of the air chamber was peeled off with forceps to reveal the white egg membrane. After wetting the membrane with NaCl solution, it was sucked out with a dropper, the inner membrane was peeled off and the corresponding samples were added dropwise to observe the situation of vascular changes and record accordingly. The eye irritation of the samples was categorized according to Table 4.
![]()
secH: average bleeding time
secL: average time to vascular melting
secC: average time to vascular clot formation
|
Scoring range |
Irritation classification |
|---|---|
|
IS<1 |
No irritation |
|
1 ≤ IS<5 |
Mildly irritation |
|
5 ≤ IS<9 |
Moderate irritation |
|
IS ≥ 9 |
Strong irritation |
2.11.2 Rabbit erythrocyte hemolysis assay
Fresh rabbit blood was diluted with PBS solution at a ratio of 4:10 and centrifuged for 10 min at 1,500 g at rt. The supernatant was aspirated and the solution was centrifuged for 2–3 times with added PBS wash.
The prepared cell suspension and diluted samples of different concentrations were mixed well in a ratio of 1:3, and then incubated in a shaker at 28℃ for 60 min. After removal, they were placed in a centrifuge at 10,000 g for 1 min, OD560 was measured, and recorded as A1. Negative control 750 µL of PBS and 250 µL of erythrocyte suspension, ansorbance was recorded as A2. Positive control group 750 µL distilled water and 250µL of erythrocyte suspension, absorbance was recorded as A3.
Hemolytic rate= [(A1-A2)/(A3-A2)]×100%
2.12 Data analysis
All experiments were repeated three times and each result was analyzed in three replicates. conducted three times, and each sample was repeated and analyzed three times. Excel and T-test were used for data processing and significance analysis. Data was expressed in mean ± standard deviation. GraphPad Prism 8 was used for analytical plotting. When p < 0.05, the difference was considered statistically significant.
3.1 Physical properties of OB and OBF
The relative molecular weights of OB and OBF were determined by gel permeation chromatography (GPC), and the elution curves are shown in Fig. 2A. Molecular weight measurements (Table 5) showed that the average molecular weights of OB and OBF were 5.626633×10⁶ and 10.605001×10⁶ Da respectively. The molecular weight of OBF was higher than that of OB, which indicates that the enzymes produced during microbial fermentation help to destroy the plant cell wall, thus promoting the release of active substances.
The structure and morphology of oat bran before and after fermentation were observed using scanning electron microscopy (SEM). Figure 2B shows the morphological characteristics of oat bran under different observation accuracies. From the figure, it can be seen that OBF has better structural homogeneity, and compared with OB, the surface structure of OBF is rougher and has better adhesion.
|
OB |
OBF |
|
|---|---|---|
|
Mn (Da) |
165 |
145 |
|
Mw (Da) |
5.626633×10⁶ |
1.0605001×10⁷ |
|
Mz (Da) |
4.3279738×10⁷ |
4.93026158×10⁸ |
|
Mw/Mn |
3.409657620×10⁴ |
7.300501671×10⁴ |
|
Mz/Mw |
7.69194 |
46.48997 |
3.2 Determination of OBF content
As shown in Fig. 3, total sugars were abundant in OB and OBF, and the content in OBF was more than 1.6 mg/mL. OB and OBF were also rich in total phenols and total proteins, with OBF containing more than 0.39 mg/mL of total phenols, 1.53 times more than OB. The content of proteins compounds in OBF was significantly higher than that of OB, 1.46 times higher than that of OB. Compared with unfermented oat bran, a significant increase in the contents of all three bioactives occurred after S. commune fermentation.
3.3 Determination of OBF in vitro antioxidant activity
When more free radicals are generated in the body than its own scavenging ability can handle, it will cause damage to human health, while antioxidants can protect the body from damage caused by free radicals.
The DPPH radical scavenging effect of OBF is shown in Fig. 4A. When the volume fraction of both OB and OBF samples increased, both samples had stronger DPPH radical scavenging ability. When the volume fraction of OBF was 100%, the best scavenging effect on DPPH radicals was 68.01%.
The hydroxyl radical scavenging effect of OBF is shown in Fig. 4B. It can be seen that both OBF and OB had a good scavenging effect on hydroxyl radicals, with similar scavenging effects. The scavenging effect of OBF at 50% volume fraction could reach more than 90% for hydroxyl radicals and was superior to that of OB at 100% volume fraction.
The smaller the IC50 value, the better the free radical scavenging ability of the sample. From Fig. 4C, it can be seen that OB and OBF were more effective in scavenging hydroxyl radicals and OBF was superior with a volume fraction of 19.17% scavenging 50% of hydroxyl radicals.
As can be seen in Fig. 4D, The scavenging capacity of OBF for ABTS + and the reducing capacity of Fe2+ were significantly higher than those of OB. The results of the ABTS method showed that OBF was 2.66 times more effective than OB in removing ABTS+, reaching 0.41 mM Trolox equivalent. The results of the FRAP method showed that the reduction capacity of OBF for Fe2+ was 1.23 times higher than that of OB, reaching 0.46 mM Trolox equivalent.
3.4 Effects of OBF on cell viability
The results of the experiments without UVB irradiation (Fig. 5A) showed that the cell viability of the OBF group was significantly improved compared with that of the OB, and the cell viability was always greater than 80% when the volume fraction of OBF was in the range of 0.625%-5%, which indicated that the OBF was not toxic to the cells in this volume fraction range. OBF with volume fractions of 1.25% and 2.5% had a proliferative effect on cells with cell survivals rates of 103.48% and 103.89% respectively.
It could be seen from Fig. 5B, a significant decrease in cell survival occurred in the model group after undergoing UVB damage. When the volume fraction of the sample was 2.5%, it had a significant reparative effect on the cells. The reparative effects of OB and OBF on UVB-damaged HaCaT cells decreased when the volume fraction of samples was greater than 2.5%, and the reparative effect of OBF on UVB-damaged model group was significantly better than that of OB.
By analyzing cell viability and status, we selected 2.5% as the volume fraction for both samples for subsequent cellular level and molecular level experiments.
3.5 Effects of OBF on cell migration capacity
Figure 6, shows the results of our measurements of cell migration capacity. After UVB irradiation, a significant decrease in cell migration ability occurred in group M, and the empty area region was significantly larger than that in group C, which was not irradiated by UVB. After UVB irradiation, the OB and OBF samples were added, and the sizes of the empty areas were calculated 24 h later. The sizes of the empty areas in the two sample groups underwent a significant decrease in comparison with that in group M, which suggests that OB and OBF at a volume fraction of 2.5% had a certain proliferative effect on cells and a certain reparative effect on damage caused to the cell migration ability by UVB irradiation.
3.6 Effects of OBF on cellular oxidative stress
Excess ROS cross cell membranes and undergo oxidative reactions with a variety of biomacromolecular substances, which in turn cause a state of oxidative stress in the body (Fernando et al. 2016). When excessive ROS are produced in the body, the ROS production-consumption balance is disrupted, and the excessive ROS promotes the release of inflammation-related factors in the body, leading to inflammation of the skin and further damaging the barrier function of the skin. Removing excess ROS is beneficial to the health of the skin. Heme oxygenase-1 (HO-1) is an enzyme with antioxidant and anti-inflammatory activities, which acts mainly by catalyzing the degradation of heme (Kim et al. 2021). NAD(P)H: quinone oxidoreductase-1 (NQO-1), a homodimeric flavoproteinase, is a representative detoxifying enzyme for phase II carcinogens (Natarajan et al. 2010).
The scavenging effect of 2.5% OBF on ROS contained in the cells is shown in Fig. 7A & D. As can be seen from the figures, the control group without UVB irradiation had less green fluorescence and lower brightness, indicating that the content of ROS in group C was lower. After UVB irradiation, the content of green fluorescence in the model group was significantly higher and brighter, indicating that the cells were damaged and the content of ROS increased after UVB irradiation. 2.5% OB and OBF were added after UVB irradiation to determine the reparative effects of the samples on HaCaT cells after UVB irradiation. The green fluorescence intensity of both the OB and OBF groups were lower than that of the model group, and the content of ROS was also reduced, which indicated that both OB and OBF had a certain reparative effect on cellular damage caused by UVB irradiation, whereas the lower green fluorescence intensity of the OBF group indicated that the effect of OBF in removing ROS was better than that of OB.
As can be seen in Fig. 7B & C, the levels of both antioxidant enzymes decreased after UVB irradiation compared to the non-UVB irradiated control group. An increase in the content of both HO-1 and NQO-1 occurred after the cells were treated with OB and OBF, and the content of both enzymes in OBF was higher than that in OB, 1.54 and 1.23 times higher than that in OB respectively.
3.7 Effects of OBF on UVB-induced inflammatory cytokines
Exposure to excessive UVB irradiation leads to a disruption of the dynamic balance of intracellular ROS production and clearance, further contributing to a state of oxidative stress in the cells and leading to skin inflammation. TNF-α and ILs are important indicators used to evaluate whether or not an inflammatory response is occurring. The effects of OB and OBF on the content of inflammatory chemokines and their expression levels are shown in Figs. 8 and 9.
From Fig. 8, compared with the control group that did not undergo UVB irradiation, a significant increase in the content of all four inflammatory factors can be seen in the model group.
From Fig. 9, after UVB irradiation, the relative mRNA expression of all four inflammatory factors underwent a significant increase, OB and OBF with a volume fraction of 2.5% had an inhibitory effect on the mRNA expression of all four inflammatory factors, and the inhibitory ability of OBF on the release of inflammatory factors was superior to that of OB.
3.8 Effects of OBF on UVB-induced skin barrier-related factor content
With the assistance of FLG monomer in the connection, keratin fibers regularly gather in the outermost layer of the epidermis, forming a strong physical barrier, thus preventing water loss and the entering of external irritants (Hoyer et al. 2022). AQP3 is expressed predominantly in the plasma membrane of epidermal keratinocytes and transports water and glycerol (Schrader et al. 2012). In immature skin, which lacks an effective skin barrier, AQP3 plays a role in epidermal hydration and transdermal water transport (Agren et al. 2010). Initially kallikrein-7 (KLK-7) was thought to be an enzyme involved in the degradation of intercellular cohesive structures in the stratified squamous epithelial stratum corneum that catalyzes the degradation of the skin's outermost bridging granules, resulting in the detachment of cells from the surface of the skin (Kumar et al. 2020).
In Fig. 10, the amount of both FLG and AQP3 proteins in the model group without samples after UVB irradiation was significantly reduced, and the enzyme activity of KLK-7 was significantly increased. After irradiation with UVB and treatment with OB and OBF at a volume fraction of 2.5%, the relative expression of FLG was significantly increased compared with that of the model group, which were 2.55 and 3.32 times higher than that of the model group respectively. After treating the cells with OB and OBF, the relative expression of AQP3 was higher than that of the model group and even higher than that of the control group which was not irradiated by UVB, and the effect of OBF was better than that of OB. After treating the cells with OB and OBF, the relative expression of KLK-7 was significantly reduced compared with that of the model group, which were 0.70 and 0.38 times that of the model group respectively, and the effect of OBF was better than that of OB.
3.9 OBF can act on the JAK/STAT pathway
In Fig. 11, after UVB irradiation, the relative expression of JAK1, STAT1 and STAT3 mRNA were significantly increased, and the relative expression of SOCS1 mRNA was significantly decreased. After treating the cells with OB and OBF at a volume fraction of 2.5%, a significant decrease in the transcript levels of JAK1, STAT1 and STAT3, and a significant increase in the transcript level of SOCS1 occurred, and the effect of OBF was superior to that of OB. This suggests that OBF may be able to exert a reparative effect on UVB-induced skin inflammation by inhibiting the activation of the JAK/STAT pathway in HaCaT cells.
3.10 Safety of OBF
Figure 12A & B show the effects of different concentrations of OB and OBF on the hemolytic capacity of rabbit erythrocytes. The experimental results showed that the effect of different mass concentrations of the samples on the hemolysis of rabbit erythrocytes were relatively small, which indicated that OB and OBF had high safety profiles.
The Fig. 12C shows the stimulating effect on blood vessels. The stimulation score of the positive control group (NaOH) was calculated to be 18.45, with obvious hemolysis and strong stimulation. The negative control group (NaCl) had a stimulation score of 0.03, and there was no hemolysis in the blood vessels. The stimulation scores of OB and OBF were 0.08 and 0.07 respectively, and there was no hemolysis in the blood vessels, indicating that OB and OBF did not stimulate the eyes.
A small amount of UVB radiation is necessary for the body, but excessive exposure will lead to the production of excessive ROS in the human body, which disrupts the dynamic balance of the body’s antioxidant defense system and leads to a state of oxidative stress in the cells, ultimately resulting in skin inflammation, damage to the skin barrier and the destruction of the skin’s defense function. When the skin is in a state of inflammation, the secretion of pro-inflammatory factors associated with skin inflammation such as IL-6, IL-8 and TNF-α increases, and redness, itchiness and flakiness will appear on the surface of the skin.
Scavenging excessive intracellular ROS and inhibiting the release of pro-inflammatory factors are effective in alleviating skin inflammation caused by UVB irradiation. HO-1 and NQO-1 are two enzymes with antioxidant effects, both of which can alleviate the oxidative stress state of the cells by scavenging excessive ROS. ROS is an effective inducer of the JAK/STAT pathway, which is closely related to many immune and allergic diseases. UVB irradiation promotes the activation of JAKs phosphorylation, and STATs are the downstream genes of JAKs. After the phosphorylation of JAKs, the activated STATs are transferred to the nucleus of the cell to regulate multiple target genes.
Oat bran contains a large number of polyphenolic compounds, sugar compounds, proteins and other biologically active substances which have a variety of biologically active effects such as antioxidation and anti-inflammation. Schizophyllum commune is a wild fungus that contains a strong active cellulase enzyme with antioxidant, anti-tumor and anti-aging properties. It has been shown that the oat bran fermented by Schizophyllum commune can repair UVA/H2O2 induced oxidative stress damage through the PI3K-AKT pathway10. However, few studies have been conducted on the reparative effects of oat bran fermentation broth fermented by Schizophyllum commune on skin inflammation caused by UVB irradiation via the JAK/STAT pathway.
We established a HaCaT cell model of UVB-induced injury and explored the reparative effects of oat bran fermented by Schizophyllum commune on UVB-induced skin inflammation at the in vitro, cellular and molecular levels, which provided a theoretical basis and supporting data for the application of oat bran fermentation broth fermented by Schizophyllum commune. The physical properties of OBF were explored using GPC and SEM, and the experimental results showed that the molecular weight of OBF was higher than that of OB, which could be attributed to the fact that the enzymes produced during microbial fermentation destroy the plant cell wall and promote the release of active substances such as macromolecular polysaccharides, and that OBF had better structural homogeneity and a rougher surface with a better adherence effect. Significant increases in total phenols, total sugars and total proteins occurred in oat bran, which could be attributed to a certain degree of enrichment of bioactive substances during the fermentation process. The experimental results of the four in vitro antioxidant assays showed that both OB and OBF possessed better in vitro antioxidant capacity, and OBF had better scavenging capacity for free radicals than OB. The effect of OBF on the viability of HaCaT cells was determined using the CCK8 method, and the effect of OBF on cell migration ability was explored using cell scratch assay, following which OBF at a volume fraction of 2.5% was selected for the subsequent experiments. Compared with OB, OBF had a better ROS scavenging effect, and the relative expression levels of HO-1 and NQO-1 increased after fermentation. After UVB irradiation, the content and transcript levels of four inflammatory factors, TNA-α, IL-4, IL-6 and IL-8, increased in the cells, and could be effectively alleviated with OBF. By measuring the content and transcript levels of genes related to the skin barrier, namely FLG, AQP3 and KLK-7, it was found that treatment with OBF had a reparative effect on barrier damage caused by UVB irradiation. The results at the molecular level suggest that OBF may be able to exert a reparative effect on skin photoinflammation caused by UVB-induced damage through the JAK/STAT pathway. The safety of OBF was determined using chick embryo assay and erythrocyte hemolysis assay, and OBF was found to have a high safety profile.
Although our study initially demonstrated that the content of active substances and antioxidant capacity of oat bran were enhanced after fermentation by Schizophyllum commune, we focused our study on the fermentation broth and did not investigate the specific substances in the fermentation broth. In order to better utilize the oat bran fermentation broth fermented by Schizophyllum commune, more experiments at the molecular level should be carried out to further explore the specific substances and targets of its action.
In this study, we determined the changes in the physical properties of oat bran after fermentation by Schizophyllum commune, and follow-up experiments were conducted at the biochemical, cellular and molecular levels. The results of the physical property measurements showed that the molecular weight of oat bran increased and structural homogeneity was improved after S. commune fermentation. By analyzing the samples for active substance content, free radical scavenging capacity and inflammatory repair capacity, we found that fermented oat bran had higher active substance content, better antioxidant capacity and better inflammatory repair capacity. Molecular level experiments also showed that fermented oat bran had a better reparative capacity on UVB damage related to the JAK/STAT pathway. The experimental results of safety assay showed that OBF had a high safety profile.
Ethics statement for the use of human and animal subjects
Not applicable.
Competing Interest
Not applicable.
Author's Contribution
Zixin Song: Writing - original draft, Writing - Review & Editing, Conceptualization. Jiman Geng: Formal analysis, Investigation, Writing - Review & Editing. Dongdong Wang: Resources, Methodology, Conceptualization. Jiaxuan Fang: Conceptualization, Investigation. Ziwen Wang: Investigation. Changtao Wang: Writing - review & editing. Meng Li: Resources.
Funding
This work was supported by the State Administration for Market Regulation Science and Technology Plan Project under Grant 2022MK192.
Availability of Data and Materials
The data that support the findings of this study are available on request from the corresponding author Dongdong Wang, upon reasonable request.
Acknowledgement
Thanks to everyone involved for their help in writing and revising the article. Thanks to “The State Administration for Market Regulation Science and Technology Plan Project” for financial support.
- Almasi E, Sahu N, Krizslint K, Balint B, Kovacs GM, Kiss B, Cseklye J, Drula E, Henrissat B, Nagy I, Chovatia M, Adam C (2019) Comparative genomics reveals unique wood-decay strategies and fruiting body development in the. Schizophyllaceae New Phytol 224(2):902–915. 10.1111/nph.16032
- Agren J, Zelenin S, Svensson LB, Nejsum LN, Nielsen S, Aperia A, Sedin G (2010) Antenatal Corticosteroids and Postnatal Fluid Restriction Produce Differential Effects on AQP3 Expression, Water Handling, and Barrier Function in Perinatal Rat Epidermis. Dermatology Research and Practice, 2010:1–9. 10.1155/2010/789729
- Chapman S, Kwa M (2022) Janus kinase inhibitors in dermatology: Part I. A comprehensive review. J Am Acad Dermatol 86(2):406–413. 10.1016/j.jaad.2021.07.002
- Cheng WJ, Shi XQ, Zhang JC, Li LY, Di FQ, Li M, Wang CT, An Q, Zhao D (2023) Role of PI3K-AKT Pathway in Ultraviolet Ray and Hydrogen Peroxide-Induced Oxidative Damage and Its Repair by Grain Ferments. Foods 12(4):806. 10.3390/foods12040806
- Debnath S, Hore S, Das P, Saha AK (2022) The evaluation of selected bioactivities of fungal mycelium of a wild Schizophyllum commune Fr. from submerged cultures. Journal of microbiology, biotechnology and food sciences, e3250. 10.55251/jmbfs.3250
- Fernando PMDJ, Piao MJ, Kang KA, Ryu YS, Hewage SRKM, Chae SW, Hyun JW (2016) Rosmarinic Acid Attenuates Cell Damage against UVB Radiation-Induced Oxidative Stress via Enhancing Antioxidant Effects in Human HaCaT Cells. Biomolecules Ther 24(1):75–84. 10.4062/biomolther.2015.069
- Fang JX, Sun QR, Wang ZW, Song ZX, Geng JM, Wang CT, Li M, Wang DD (2023) Enhancement of Human Epidermal Cell Defense against UVB Damage by Fermentation of Passiflora edulis Sims Peel with Saccharomyces cerevisiae. Nutrients 15(3):501. 10.3390/nu15030501
- Hoyer A, Rehbinder EM (2022) Filaggrin mutations in relation to skin barrier and atopic dermatitis in early infancy. Br J Dermatol 186:544–552. 10.1111/bjd.20831
- Khider M, Nasr NM, Atallah KM, Metry Wedad A (2022) Functional UF-low and full-fat Labneh supplemented with Oats (Avena sativa L.) powder and probiotic bacteria[J]. Journal of Umm Al-Qura University for Applied Sciences, 2022,8(1–2):21–32. 10.1007/s43994-022-00003-8
- Kim JY, Choi YM, Leem JC, Song JE (2021) Heme Oxygenase-1 Induction by Cobalt Protoporphyrin Ameliorates Cholestatic Liver Disease in a Xenobiotic-Induced Murine Model. Int J Mol Sci 22(15):8253. 10.3390/ijms22158253
- Kumar DV, Sivaranjani Y, Rao GV (2020) Immunohistochemical expression of kallikrein 7 in oral squamous cell carcinoma. J Oral Maxillofacial Pathol 24(3):580. 10.4103/jomfp.JOMFP_244_19
- Kumar A, Singh B, Raigond P, Sahu C, Mishra UN, Sharma S, Lal MK (2021) Phytic acid: Blessing in disguise, a prime compound required for both plant and human nutrition. Food Res Int 142:110193. 10.1016/j.foodres.2021.110193
- Liu S, You L, Zhao Y (2018) Hawthorn Polyphenol Extract Inhibits UVB-Induced Skin Photoaging by Regulating MMP Expression and Type I Procollagen Production in Mice. J Agric Food Chem 66(32):8537–8546. 10.1021/acs.jafc.8b02785
- Liu R, Zhu TZ, Wu T, Li Q, Meng YQ, Cao Q, Zhang M (2016) Physicochemical and Antioxidative Properties of Superfine-ground Oat Bran Polysaccharides. Food Sci Technol Res 22(1):101–109. 10.3136/fstr.22.101
- Masullo M, Menegazzi M, Di Micco S (2014) Direct Interaction of Garcinol and Related Polyisoprenylated Benzophenones of Garcinia cambogia Fruits with the Transcription Factor STAT-1 as a Likely Mechanism of Their Inhibitory Effect on Cytokine Signaling Pathways. J Nat Prod 77(3):543–549. 10.1021/np400804y
- Martinez RM, Pinho-Ribeiro FA, Steffen VS (2015) Naringenin Inhibits UVB Irradiation-Induced Inflammation and Oxidative Stress in the Skin of Hairless Mice. J Nat Prod 78(7):1647–1655. 10.1021/acs.jnatprod.5b00198
- Morelli M, Scarponi C, Mercurio L, Facchiano F, Pallotta S, Madonna S, Griolomoni G, Albanesi C (2018) Selective Immunomodulation of Inflammatory Pathways in Keratinocytes by the Janus Kinase (JAK) Inhibitor Tofacitinib: Implications for the Employment of JAK-Targeting Drugs in Psoriasis. Journal of Immunology Research, 2018:1–18. 10.1155/2018/7897263
- Natarajan VT, Singh A, Kumar AA, Sharma P, Kar HK, Marrot L, Meunier JR, Natarajan K, Rani R, Gokhale RS (2010) Transcriptional Upregulation of Nrf2-Dependent Phase II Detoxification Genes in the Involved Epidermis of Vitiligo Vulgaris. J Invest Dermatology 130(12):2781–2789. 10.1038/jid.2010.201
- Singh R, De S, Belkheir A (2013) Avena sativa (Oat), a potential neutraceutical and therapeutic agent: an overview. Crit Rev Food Sci Nutr 53(2):126–144. 10.1080/10408398.2010.526725
- Schrader A, Siefken W, Kueper T, Breitenbach U, Gatermann C, Sperling G, Biernoth T, Scherner C, Stab F, Wenck H, Wittern KP, Blatt T (2012) Effects of Glyceryl Glucoside on AQP3 Expression, Barrier Function and Hydration of Human Skin. Skin Pharmacol Physiol 25(4):192–199. 10.1159/000338190
- Tu YY, Zhong YX, Fu JF, Cao YZ, Fu GQ, Tian XX, Wang B (2011) Activation of JAK/STAT signal pathway predicts poor prognosis of patients with gliomas. Med Oncol 28(1):15–23. 10.1007/s12032-010-9435-1
- Wirth S, Freihorst D, Krause K, Kothe E (2021) What Role Might Non-Mating Receptors Play in Schizophyllum commune? J Fungi 7(5):399. 10.3390/jof7050399
- Wang YT, Wang L, Wise JTF, Shi XL, Chen ZM (2020) Verteporfin inhibits lipopolysaccharide-induced inflammation by multiple functions in RAW 264.7 cells. Toxicol Appl Pharmcol 387:114852. 10.1016/j.taap.2019.114852
- Wang RY, Zhang ZF, Alhemaltijlang S, Ye C, Hallmulati M, Huang XJ, Qin HY (2022) Oat β Glucan Ameliorates Renal Function and Gut Microbiota in Diabetic Rats. Front Nutr 9. 10.3389/fnut.2022.875060
- Zhang YK, Zhang ML, Guo XY, Bai X, Zhang J, Huo R (2023) Improving the adsorption characteristics and antioxidant activity of oat bran by superfine grinding. Food Sci Nutr 11(1):216–227. 10.1002/fsn3.3054