The morphologies and microstructures of the as-obtained Nb2O5/PANI-cc materials were observed through SEM, respectively. Figure 2a displays the SEM image of the Nb2O5/PANI-cc obtained; Nb2O5/PANI nanowires are uniformly grown on carbon cloth. The surfaces of the carbon cloth become much rougher and are with several hundreds of nanometers uniformly covered by Nb2O5/PANI nanowires in Fig. 2b. Figure 2c displays the magnified SEM image, in which the Nb2O5/PANI-cc shows the typical nanowires structure of the products with a rough surface.
The morphologies and microstructures of the as-obtained Nb2O5-c, Nb2O5-cc@S, Nb2O5/PANI-cc, and Nb2O5/PANI-cc@S materials were observed through SEM, respectively. The Inset of Fig. 3a shows that the carbon cloth is of one-dimensional (1D) fibered structures with a smooth surface. Figure 3d-3c displays the SEM image of the Nb2O5/PANI-cc@S obtained; Nb2O5 nanowires are uniformly grown on carbon cloth. The surfaces of the carbon cloth become much rougher and are with several hundreds of nanometers uniformly covered by Nb2O5 nanowires in Fig. 3d. Figure 3b displays the magnified SEM image for Nb2O5-cc, in which the typical nanowires structure of the Nb2O5-cc with a rough surface. Each Nb2O5 nanowire has a pointy top, and the diameter of the nanowire ranges from 20–30 nm. By comparing the morphology of Nb2O5/PANI-cc@S with that of the Nb2O5/PANI-cc composite, it is evident that the surface of the Nb2O5/PANI-cc@S is rougher than that of the Nb2O5/PANI-cc because residual sulfur particles are absorbed on its surface. Figure 3e and 3f show that the Nb2O5-cc@S and Nb2O5/PANI-cc@S can still maintain the original morphology after sulfur infiltration, indicating the structural stability of the composite.
Figure 4a and 4b display a transmission electron microscopy (TEM) image of the Nb2O5 and Nb2O5/PANI nanowires. Figure 4a shows the TEM image of the homo-junctions with the wall thickness of ~ 10 nm and the average length of the nanowires of about 100 nm. From the TEM images in Fig. 4b, it can be obvious that many short nanowires with a length of 50–100 nm and a thickness of 20–30 nm have a rough surface. For the Nb2O5/PANI core-shell nanowire, the PANI shell is uniformly and fully covered on the surface of the Nb2O5 nanowire, while the structure of the nanowire is well maintained. Figure 4d presents a high-resolution TEM (HRTEM) image of the Nb2O5/PANI nanowires. The electrodeposited PANI shell has a diameter of 5–10 nm. The crystallographic structures of Nb2O5, Nb2O5/PANI and Nb2O5/PANI-cc@S are confirmed by X-ray diffraction (XRD) spectroscopy in Fig. 4c. Figure 4c shows the XRD patterns of Nb2O5 and Nb2O5/PANI, all diffraction peaks can be well indexed to those of Nb2O5 with orthorhombic phase (JCPDS 30–0873), those peaks marked with “*” corresponding to Nb2O5 [26]. As for Nb2O5/PANI nanowires arrays, indicating that the electrodeposited PANI is amorphous, the diffraction peak of PANI was located between 15° and 30°, And the peak was quite broad “long peak” [27]. The X-ray diffraction (XRD) patterns of Nb2O5/PANI-cc@S were shown in Fig. 4c. Those peaks could be foraged to orthorhombic sulfur (JCPDF no. 78-1189) for Nb2O5/PANI-cc@S.
FTIR spectra of Nb2O5-cc@S and Nb2O5/PANI-cc@S are shown in Fig. 5. The main characteristic peak distribution of polyaniline is as follows:1582 and 1616 cm− 1 are C-C stretches of benzene and quinone rings, as shown in Fig. 5. The absorption bands of 1397 cm− 1 (C-N stretching) and 1124 cm− 1 (C-H bending vibration) further demonstrate other properties of polyaniline. And the peak in the 900–400 cm− 1 range indicates Nb–O vibration: the absorption peaks at 489 cm− 1 and 729 cm− 1 [28]. The IR spectra of Nb2O5-cc and Nb2O5/PANI-cc indicate the existence of PANI shell and Nb2O5 core, consistent with the XRD result.
Thermogravimetric analysis (TGA) curves of the Nb2O5-cc@S and Nb2O5/PANI-cc@S are also conducted to identify the proportion of sulfur in the composite (Fig. 5b). The Nb2O5-cc@S and Nb2O5/PANI-cc@S composite showed a vast weight loss between 200°C and 300°C. The sulfur volatilization temperature of those composites is about 200°C-300°C, the sulfur load of the Nb2O5-cc@S and Nb2O5/PANI-cc@S composites is ~ 75.63 wt % and ~ 77.28 wt %, respectively.
The elemental distribution of the Nb2O5/PANI-cc@S is further investigated using EDS mapping (Fig. 6a-f). The green dots in the S mapping show sulfur element on Nb2O5/PANI-cc@S. And corresponding energy dispersive X-ray spectroscopy (EDX) mappings of C, Nb, and O are shown in Fig. 6c-f, respectively, which reveals that the Nb2O5/PANI are covered on the surface of carbon cloth. The element distributions of Nb2O5/PANI-cc were characterized by the element mapping technique in Fig. 6c-f. It clearly shows that Nb and O evenly distribute in the Nb2O5/PANI-cc, illustrating the formation of Nb2O5 nanowires on the carbon cloth that steadily anchor on the carbon cloth.
To verify that Nb2O5/PANI-cc@S is superior to Nb2O5-cc@S composite materials in terms of morphology and performance, two kinds of composite materials were prepared into electrode plates and then assembled into batteries for electrochemical performance testing. Figure 7a-b shows CV curves of the Nb2O5/PANI-cc@S and Nb2O5-cc@S cells scanned at 0.1 mV s− 1. The reduction peak in the CV curve of those composite materials represents the multi-step reaction process of S→Li2S, and the oxidation peak is the oxidation reaction of Li2S→S during the charging process [29, [30]. In Fig. 7a, the reduction and oxidation peaks of Nb2O5/PANI-cc@S are 2.213 V, 2.01V, and 2.446 V, respectively. Figure 7a The two cathodic peaks appearing in the first scan located at 2.213V and 2.01V correspond to the formation of soluble lithium sulfide (Li2Sx, x ≥ 4) and the conversion of soluble lithium sulfide to insoluble lithium sulfide (Li2S2/Li2S) [31]. The subsequent anodic peak at 2.446 V corresponds to the conversion of insoluble lithium sulfide (Li2S2/Li2S) to soluble lithium sulfide (Li2Sx) and subsequently to sulfur monomers [32].REDOX peaks for Nb2O5/PANI-cc@S were 2.16 V, 2.39 V, and 2.47 V. The difference between the reduction peak and oxidation peak of the electrode is slightly smaller than that of the Nb2O5/PANI-cc@S electrode composite. As shown in Fig. 7a, the CV curves of Nb2O5/PANI-cc@S in three cycles have better coincidence, indicating that the electrode composite has better reversible oxidation-reduction and stability.
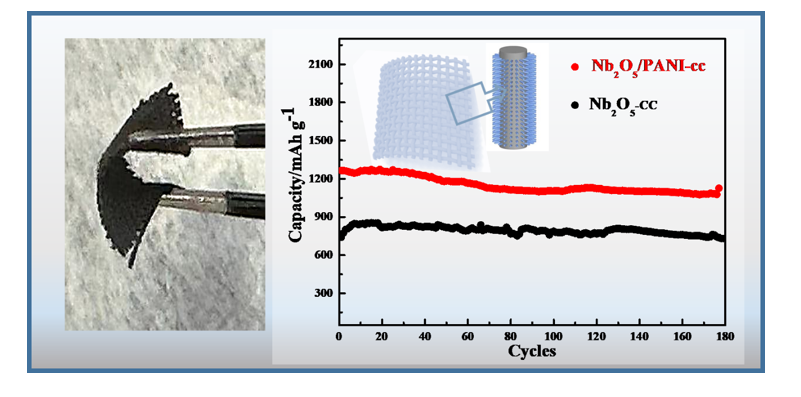
Figure 8a shows the cyclic performance of Nb2O5-cc@S and Nb2O5/PANI-cc@S at 0.1 C. At 0.1 C, the initial discharge capacity of Nb2O5/PANI-cc@S is 1265.7 mAh·g− 1 and 1076.8 mAh·g− 1 after 180 cycles, and the capacity retention rate is 85.07%. The initial discharge capacity of Nb2O5-cc@S is 851.3 mAh·g− 1, the remaining 730.5 mAh·g− 1 after 180 cycles, and the capacity retention rate is 85.8%. Nb2O5/PANI-cc@S electrode exhibits excellent cyclic stability due to the Nb2O5 nanowires array enclosing sulfur, limiting its reaction within those Nb2O5 nanowires and limiting volume expansion. In addition, The Nb2O5/PANI-cc@S electrode has better electrical conductivity, significantly improving the electrochemical performance of the battery.
As can be seen from Fig. 8b, the discharge capacity of the Nb2O5-cc@S and Nb2O5/PANI-cc@S electrode changes with the change of current density, which gradually increases from 0.1 C to 0.5 C and finally returns to 0.1 C. When the current density is 0.1 C, 0.2 C, 0.3 C, 0.5 C, the specific discharge capacity of Nb2O5/PANI-cc@S electrode is 1236.8, 813.9, 540.8 and 391.1 mAh g− 1. The particular discharge capacities of the Nb2O5-cc@S electrode were 856.1, 442.1, 191.5, and 21.5 mAh g− 1, respectively. When the current density changes back to 0.1 C, the specific discharge capacities of the Nb2O5-cc@S and Nb2O5/PANI-cc@S electrodes are 783.3 and 1212.5 mAh·g− 1, respectively. Nb2O5/PANI-cc@S electrode has better recovery ability. The specific discharge capacity of Nb2O5/PANI-cc@S at the first circle is more significant than that of Nb2O5-cc@S at 0.1 C, And the capacity decays rapidly in subsequent cycles for Nb2O5-cc@S, which is related to the shell of PANI in the Nb2O5/PANI-cc@S. Nb2O5/PANI-cc@S effectively inhibits the polysulfide reaction and can better bind polysulfide during the cycle, thus reducing the shuttle effect. Figure 8c shows the constant current charge and discharge curve of the Nb2O5/PANI-cc@S electrode at 0.1 C. There are two discharge platforms in the curves of the Nb2O5/PANI-cc@S electrode. Corresponding to the transformation process of S8 into long-chain polysulfide and short-chain polysulfide, A charging platform represents the conversion process of short-chain polysulfide to S8 molecules. Figure 8d shows the charge and discharge curves of the Nb2O5/PANI-cc@S electrode at different ratios; with the increase of current density, the overpotential between charge and discharge curves also increases gradually. With the rise in current density, the discharge voltage platform of the charge-discharge curve becomes shorter and shorter, which means that the polarization degree of the battery becomes more and more serious. Figure 9 shows the Physical image of Nb2O5/PANI-cc@S. Nb2O5/PANI-cc@S has excellent flexibility. Figure 9b shows Infiltration angle of Nb2O5/PANI-cc@S with electrolyte, the electrolyte in Fig. b is lost instantaneously after dropping. Nb2O5/PANI-cc@S has excellent electrolysate storage properties, which may be due to the introduction of the shell for PANI, which increases the infiltration of the electrolysate. In general, the lower contact Angle helps to promote the transmission of ionizer, thereby improving the cycle performance.
Table 1
Equivalent circuit fitting results for Nb2O5-cc@S and Nb2O5/PANI-cc@S Nyquist curves
| Samples | Nb2O5-cc@S | Nb2O5/PANI-cc@S |
|---|
| Rs (Ω) | 234.4 | 22.03 |
| Rct (Ω) | 359.3 | 345.2 |
To further understand the excellent electrochemical performance of Nb2O5/PANI-cc@S, electrochemical impedance spectroscopy (EIS) measurements of Nb2O5-cc@S and Nb2O5/PANI-cc@S were performed. Figure 10 shows the AC impedance spectra in the frequency range from 100 kHz to 0.01 Hz. These figures clearly show that the semicircle diameter of the Nb2O5/PANI-cc@S electrode is much smaller than that of the Nb2O5-cc@S electrode, indicating that the PANI shell enhances the charge transfer process. The Warburg impedance slope indicates electrolyte ions' diffusion behavior in the low-frequency region. The Nb2O5/PANI-cc@S electrode exhibits a more vertical line than the Nb2O5-cc@S electrode, as the Nb2O5/PANI-cc@S electrode has a lower ion diffusion resistance in the PANI shell structure. As shown in Table 1, the internal resistance (Rs) of the Nb2O5-cc@S and Nb2O5/PANI-cc@S electrodes were 234.4 Ω and 22.03 Ω, respectively, and the interfacial transfer resistance (Rct) was 359.3 Ω and 345.2 Ω, respectively. After loading the electrode with the PANI layer, the conductivity of the Nb2O5/PANI-cc@S electrode was enhanced, and the ohmic resistance was reduced.