Identification and Analysis of the Physical and Chemical Properties of ERF Transcription Factors
A total of 137 tomato ERF genes were confirmed with the SMART (http://smart.emblheidelberg.de/smart/batch.pl) and CDD (https://www.ncbi.nlm.nih.gov/Structure/bwrpsb/bw rpsb.cgi) online tools. Genes without complete AP2/ERF domains were discarded. Finally, 134 transcription factors were screened. As shown in supplementary table 1, the longest sequence and the heaviest molecular weight were observed for Solyc04g071770.2.1, at 452 aa and 49582.81, respectively; the shortest sequence and the lightest molecular weight were observed for Solyc10g080310.1.1, at 73 aa and 8382.60, respectively. The isoelectric point ranged from 4.09 (Solyc10g076380.1.1) to 10.08 (Solyc10g080310.1.1). The instability coefficient ranged from 21.51 (Solyc12g038450.1.1) to 86.25 (Solyc01g090340.2.1). Among the transcription factors, members Solyc03g093530.1.1, Solyc06g050520.1.1, Solyc06g063070.2.1, Solyc10g080310.1.1, Solyc10g080650.1.1, Solyc12g038440.1.1, and Solyc12g038450.1.1 all had instability coefficients below 40, indicating that they were more stable than the others. The total average hydrophilicity ranged from -1.122 (Solyc06g068830.1.1) to -0.303 (Solyc03g006320.1.1), indicating hydrophilic proteins.
Phylogenetic Tree of ERF Transcription Factors
A total of 134 tomato ERF transcription factors and 122 Arabidopsis ERF genes were combined to construct a comprehensive phylogenetic tree. According to the grouping by conserved domain and the grouping of ERF family genes in Arabidopsis, the tomato and Arabidopsis ERF transcription factor genes in this experiment were divided into 12 groups (Figure 1). Among these groups, groups A, B, C and D contained members of the CBF/DRBE ERF subfamily, corresponding to A6, A5, A1/A4 and A2 in the Arabidopsis group, respectively. There were no A3-subfamily genes in the ERF family of tomato, proving that there were no genes with a structure and function similar to those of AT2g40220.1 in tomato. In previous studies, 12 ERF genes were classified into group B6 in Arabidopsis thaliana [16, 17]. Based on motif analysis, B6 genes were divided into three groups. Therefore, in this experiment, B6 was divided into three groups (E, K, and L) as suggested by previous research, and there were no tomato ERF genes in group L. Groups F, G, H, I, and J corresponded to the B5, B2, B1, B3, and B4 groups in Arabidopsis, respectively. A total of 43 genes belonged to the CBF/DRBE subfamily, and 92 genes belonged to the ERF subfamily. Group I contained the most tomato ERF genes, with 35.
Conserved Motif Analysis and Gene Structural Analysis of ERF Transcription Factors
To understand the specific distribution of conserved motifs of tomato ERF genes, 20 conserved motifs were identified by the online MEME analysis tool (http://meme-suite.org/). The logos of the 20 conserved motifs found are shown in the figure, and their position information in each subgroup is shown in Figure 2A-a. On average, each member contained 4 motifs, and Solyc11g006050.1.1 had the largest number of motifs, which was 7 (Figure 2A-b). The results showed that the conserved AP2 domains constituted by motifs 1, 2 and 3 were the most conserved in the sequences of tomato ERF transcription factors, which together with other conserved elements contributed to the diversity and identity of the genes. Among these transcription factors, 18 members of the C, B, D, E and H subgroups lacked motif 2. Similarly, most genes of subgroups B, D, J and I contain motif 15. Motif 5 was detected in groups C and B. Motif 6 appeared in members of subgroups C, D, and I and was conserved at the C-terminus of the protein sequence. In both groups F and K, motif 7 was identified as conserved at the N-terminus of the sequence. Motifs 8/9/12/16/20 were unique to the C/J/D/G/E group. Group I had the most members and, correspondingly, the most characteristic motif, motif 10/11/13/14/17. The results show that the members of the same subgroup are similar in rank and position, and the unique conserved motifs in different subgroups also enhance the support of the phylogenetic tree. The distribution of the conserved structural domain of the tomato ERF family is shown in Figure 2A-c. Most of the ERF members have only AP2, a conserved structural domain with a length of approximately 60-70 amino acids. For example, Solyc05g052410.1.1 and Solyc08g081960.1.1, in addition to having AP2, also contain the H+-ATPase subunit H (NtpH) superfamily and Flavodoxin domain, respectively. The name of the Solyc02g077810.1.1 conserved domain is the same as that in the AP2 superfamily. The more closely related the members of an evolutionary branch are, the more closely related their conserved domains are, and the more similar their biological functions are. The dissimilarity in the arrangement of conserved domains among the members of the same subgroup may be caused by evolutionary or recombination mutations in the progeny.
To further study the gene structure of the ERF transcription factor family, a structural distribution map of introns and exons of 134 members was obtained through the Gene Structure Display Server (GSDS) analysis platform (http://gsds.cbi.pku.edu.cn/) (Figure 2A-d). As shown in the figure, most members of the tomato ERF family contain only exons (107/134, 79.8%). This structural feature is similar to that in the Arabidopsis ERF family. In addition, no intron was found in the B, F, and K subgroups, and only one intron was found in the C, D, and I subgroups. The smaller number of intron-containing members than of non-intron-containing members in the tomato ERF family may be due to an increase in or a loss of introns during evolution.
Distribution of Tomato ERF Transcription Factors on Chromosomes
The 134 ERF transcription factors in tomato showed an uneven distribution on 12 chromosomes (Figure 2B). Chromosome 3 contained the most members, with 22 members. Chromosome 7 contained the fewest, with only five members. A total of 16, 9, 22, 11, 10, 10, 5, 12, 9, 9, 8, and 13 ERF genes were distributed sequentially on chromosomes 1-12 in tomato. A tandem repeat was defined as adjacent genes on the same chromosome within 100 kb. There were 20 pairs of genes in the tomato ERF family that exhibited tandem replication, and the number of tandemly replicated genes on chromosome 3 was the highest, at 4 pairs, including a total of 13 genes. Tandem replication led to the production of multiple gene clusters. The members of the ERF family accounted for 39.5% of the total, and 75% of the chromosomes of the tomato family exhibited tandem duplication.
Expression of the tomato ERF transcription factor family in different organs
To better understand the role of ERF genes in tomato development, we used previously published tomato RNA-seq data to draw a heat map of ERF tissue-specific expression (Figure 3A). The results showed that the expression of most of the genes in the tomato ERF family was low in the bud, flower, leaf, root and fruit of tomato. The expression levels of Solyc06g063070.2.1, Solyc03g123500.2.1, and Solyc07g064890.1.1 in tomato seedlings were similar and higher than those of other genes. Solyc06g063070.2.1 had the highest expression level in flowers. The Solyc12g056590.1.1, Solyc07g064890.1.1, Solyc04g072900.1.1, and Solyc03g123500.2.1 genes were highly expressed in flowers. Solyc07g053740.1.1 had the highest expression in leaves. The Solyc10g006130.1.1, Solyc03g093540.1.1, Solyc03g093550.1.1, Solyc06g063070.2.1, Solyc03g093560.1.1, and Solyc05g052040.1.1 genes also had higher expression levels in leaves. Solyc06g063070.2.1 was also the most highly expressed gene in the root. The Solyc01g065980.2.1, Solyc07g053740.1.1, Solyc07g064890.1.1, Solyc04g054910.2.1, and Solyc09g075420.2.1 genes showed higher expression in the roots. During the fruit expansion period, the expression of some genes decreased with increasing fruit diameter, while that of others showed the opposite trend. The Solyc01g065980.2.1 gene had the highest expression level in fruits with a diameter of 1 cm. As the fruit gradually matured, the expression level of this gene decreased. The expression of the Solyc06g063070.2.1 gene showed an upward trend as the fruit matured, with the highest expression in the fruits with a diameter of 3 cm.
Expression pattern of ERF transcription factors in tomato inoculation with S. lycopersici
In this study, we screened 18 ERF genes based on transcriptome data. These genes were grouped into two groups. The results showed that except for Solyc06g054630 and Solyc01g090340, the expression of 16 ERF genes retrieved in the RNA-seq data increased after inoculation (Figure 3B). It is worth noting that in the first group, the difference was mainly shown in CK2 and SPI, while in the other group, it was shown in CK1 and RPI. This shows that these ERF genes play a positive role in tomato resistance to pathogen infection.
Phylogenetic analysis and sequence alignment of ERF2
The coding sequence of ERF2 has one AP2/ERF domain, and this protein belongs to the ERF TF B-3 family (Figure 4A-a). In addition, ERF2 is closely related to tomato ERF1 and A. thaliana AtERF1. The results indicated that ERF2 may have a similar function to other B-3 family members in plants. Analysis of the conserved protein sequence database revealed that ERF2 shares high similarity with other ERF proteins in terms of their whole putative protein sequences (Figure 4A-b).
ERF2- silenced plants showed impaired disease resistance to S. lycopersici
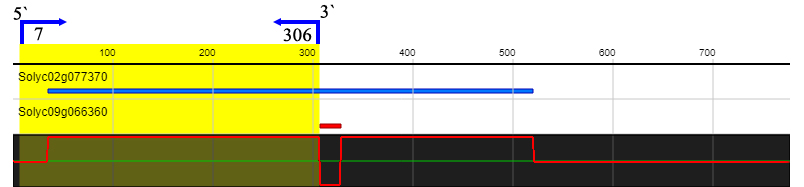
To investigate whether ERF2 influences tomato plant defense against S. lycopersici, we performed VIGS to downregulate ERF2 gene expression. In order to prevent interference with the expression of other ERF genes, the target fragment we selected is shown in supplementary figure 1. The results showed that disease symptoms were observed in the ERF2-silenced plants compared to the TRV2 empty vector plants after inoculation with S. lycopersici. In the ERF2-silenced plants, the lesions were aggravated, and perforations were observed. In contrast, only a hypersensitive reaction (HR) without disease symptoms was observed in the TRV2 empty vector plants (Figure 4B-a). These results indicated that silencing the ERF2 gene in resistant tomato plants could impair resistance to S. lycopersici.
As shown in Figure 4B-a, low levels of mycelial hyphae and a weak HR with necrotic lesions were observed in the ERF2-silenced plants. Nevertheless, strong HR symptoms without hyphal growth were observed in the TRV2::00 empty vector plants. Therefore, these results indicated that the HR was impaired in the ERF2-silenced plants compared to the TRV2::00 empty vector plants at 3 dpi with S. lycopersici.
Accumulation of H2O2 and O2- was impaired in the ERF2-silenced plants
The accumulation of H2O2 and O2- can be used to evaluate the effects of disease resistance in tomato plants. At 3 dpi, H2O2 accumulation was too weak to observe in the TRV::ERF2 plants compared to the TRV::00 empty vector plants. H2O2 was observed earlier and was more abundant in the TRV::00 plants than in the TRV::ERF2 plants (Figure 4B-b). Based on these results, we concluded that the downregulation of ERF2 gene expression could decrease resistance to S. lycopersici in tomato plants.
ROS content and SOD, POD and CAT activity assays
ROS production and enzyme activities were detected over a time course; therefore, leaves at 0, 1, 3 and 5 dpi were collected for determination of the ROS content and the SOD, POD and CAT activities. Inoculation with S. lycopersici caused the ROS content and SOD, POD and CAT activities to sharply increase at 3 dpi (Figure 4C). In particular, in the ERF2-silenced plants, the ROS content and SOD, POD and CAT activities were lower than those in the control plants at 1, 3 and 5 dpi.
ERF2 may enhance disease resistance to S. lycopersici through SA and JA signaling pathways
To analyze the hormonal response to S. lycopersici infection, we performed liquid chromatography-mass spectrometry (LC-MS) to measure the JA and SA contents in the ERF2-silenced and TRV::00 plants. For SA, the content in TRV2::ERF2 and TRV::00 plants peaked at 3 days, and the content of the latter was 4.7 times greater than that of the former. The JA levels of the ERF2-silenced plants were significantly lower than those of the TRV::00 plants after inoculation with S. lycopersici (Figure 5A). These results indicated that ERF2 probably participates in both the SA and JA signaling pathways to improve disease resistance to S. lycopersici in tomato plants.
ERF2-silencing decreased the Pto and PR gene expression levels
Previous studies have shown that Pti4/5/6 interacts with Pto to regulate disease resistance. In addition, many studies have shown that ERF genes regulate the expression of PR genes to enhance plant resistance to disease [18, 19]. Here, qRT-PCR was used to identify the regulatory relationship between ERF2 and the defense genes Pto and PRs. As shown in Figure 5B, the expression levels of the Pto, PR1b1 and PR1-P2 genes were significantly decreased in the ERF2-silenced plants compared to the TRV::00 plants after inoculation with S. lycopersici.
Therefore, we proposed that ERF2 enhances disease resistance to S. lycopersici by directly or indirectly regulating the expression of the Pto and PR genes in tomato plants.
In particular, studies have indicated that the HR and the accumulation of ROS are stronger in resistant cultivars than in susceptible cultivars, leading to improved disease resistance [20]. Consistent with these previous studies, our studies showed that downregulating the gene expression of ERF2 decreased HR-induced cell death, the production of H2O2, and O2- in the ERF2-silenced plants compared to the TRV::00 plants. These results indicated that the accumulation of ROS was positively correlated with the HR in the disease resistance to S. lycopersici.
Many studies have shown that the regulation of PR gene expression by ERF TFs requires the combination of GCC-box or DRE/CRT cis-acting elements [21, 22]. In addition, studies have shown that different sequences on the GCC-box side affect the binding efficiency of ERFs, indicating that various ERFs may regulate different gene sets [23]. PR-P2 and PR1b are representative marker genes of the JA/ET- and SA-mediated defense signaling pathways. In particular, the tomato Pto gene could enhance defense responses after inoculation with P. syringae pv. tabaci [24]. The overexpression of the tomato Pto gene could activate the expression of PR gene resistance to Pseudomonas species, and EREBPs interacted with the Pto protein to regulate disease resistance [16]. Here, our studies showed that downregulation of ERF2 gene expression could decrease the Pto-mediated resistance to S. lycopersici. Furthermore, Pti4/5/6 TFs bind to the PR box to regulate gene expression. Similarly, our studies also showed that silencing the ERF2 gene decreased the gene expression of PR1b1 and PR-P2. Together, these results indicate that ERF2 may directly or indirectly regulate Pto, PR1b1 and PR-P2 expression and enhance tomato resistance to S. lycopersici. However, it remains to be determined whether ERF2 interacts with the Pto protein to regulate PR gene expression and enhance the resistance of tomato to S. lycopersici (Figure 5C).
Furthermore, previous studies have also shown that SA and JA are important signaling molecules involved in PTI and ETI, regulating plant diseases and responses to abiotic stresses [25, 26]. In addition, the SA and JA/ET signaling pathways can induce defense responses, including the expression of most PR proteins [27-29]. Our data were consistent with previous findings that the SA and JA contents were decreased in ERF2-silenced plants compared to TRV::00 plants, suggesting that ERF2 involvement in the resistance of tomato plants to S. lycopersici may be dependent on the SA and JA signaling pathways.