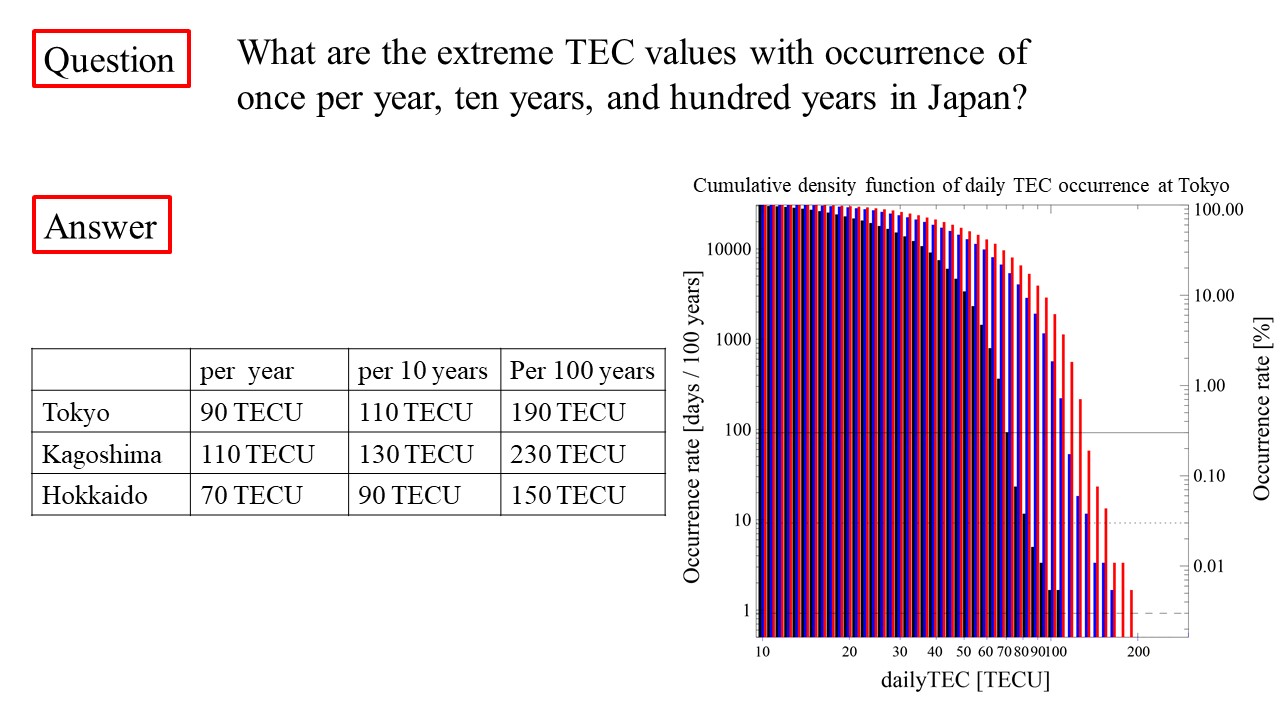
Ionospheric total electron content (TEC) is one of the key parameters for users of radio-based systems, such as the Global Navigation Satellite System, high-frequency communication systems, and space-based remote sensing systems, since total ionospheric delay is proportional to TEC through the propagation path. It is important to know extreme TEC values in readiness for hazardous ionospheric conditions. The purpose of this study is to estimate extreme TEC values with occurrences of once per year, ten years, and hundred years in Japan. In order to estimate the extreme values of TEC, a cumulative distribution function of daily TEC is derived using 22 years of TEC data from 1997 to 2018. The extreme values corresponding to once per year and ten years are 90 and 110 TECU, respectively, in Tokyo, Japan. On the other hand, the 22-year data set is not sufficient to estimate the once-per-hundred-year value. Thus, we use the 62-year data set of manually scaled ionosonde data for the critical frequency of the F-layer (foF2) at Kokubunji in Tokyo. First, we study the relationship between TEC and foF2 for 22 years and investigate the slab thickness. Then the result is applied to the statistical distribution of foF2 data for 62 years. In this study, two methods are applied to estimate the extreme TEC value. In the first method, the distribution of slab thickness is artificially inflated to estimate extreme TEC values. In the second method, extreme slab thicknesses are applied to estimate extreme TEC values. The result shows that the once-per-hundred-year TEC is about 150-190 TECU at Tokyo. The value is also estimated to be 180-230 TECU in Kagoshima and 120-150 TECU in Hokkaido, in the southern and northern parts of Japan, respectively.