The cohort included in this study consisted of 156 hospitalized patients diagnosed with COVID-19 pneumonia and 20 healthy controls. Among all patients, 56 died during hospitalization and 100 were successfully discharged. The median age of all enrolled patients was 66 years (IQR, 46.3-73.0; range, 9-99 years), and 76 (48.7%) were male. Comorbidities were identified in 101 (64.7%) patients, with hypertension, cardiovascular disease and diabetes being the most common ones. The most common symptoms presented upon admission were fever (79 [50.6%]) and cough (71 [45.5%]), followed by dyspnea (28 [17.9%]) and fatigue (23 [14.7%]) (Table 1).
Table 1. Baseline characteristics of patients infected with COVID-19
|
|
Total
(n=156)
|
Survivor
(n=100)
|
Non-survivor
(n=56)
|
P valuea
|
|
Characteristics
|
|
|
|
|
|
Age, years
|
66.0 (46.3-73.0)
|
58.0 (37.0-69.0)
|
72.0 (65.3-83.0)
|
<0.001
|
|
Male, %
|
76 (48.7)
|
44(44.0)
|
32(57.1)
|
0.115
|
|
Underlying disease
|
|
|
|
|
|
Cardiovascular disease, %
|
44 (28.2)
|
17(17.0)
|
27(48.2)
|
<0.001
|
|
COPD, %
|
27 (17.3)
|
12(12.0)
|
15(26.8)
|
0.019
|
|
Chronic renal disease, %
|
15 (9.6)
|
4(4.0)
|
11(19.6)
|
0.001
|
|
Chronic liver disease, %
|
14 (9.0)
|
2(2.0)
|
12(21.4)
|
<0.001
|
|
Cerebrovascular, %
|
22 (14.1)
|
9(9.0)
|
13(23.2)
|
0.014
|
|
Diabetes, %
|
31 (19.9)
|
11(11.0)
|
20(35.7)
|
<0.001
|
|
Hypertension, %
|
65 (41.7)
|
31(31.0)
|
34(60.7)
|
<0.001
|
|
Cancer, %
|
14 (9.0)
|
3(3.0)
|
11(19.6)
|
<0.001
|
|
Initial symptoms
|
|
|
|
|
|
Fever, %
|
79 (50.6)
|
56 (56.0)
|
23 (41.4)
|
0.074
|
|
Cough, %
|
71 (45.5)
|
45(45.0)
|
26(46.4)
|
0.864
|
|
Chest tightness, %
|
28 (17.9)
|
16(16.0)
|
12(21.4)
|
0.397
|
|
Asthma, %
|
30 (19.2)
|
22(22.0)
|
8(14.3)
|
0.241
|
|
Headache, %
|
5 (3.2)
|
2(2.0)
|
3(5.4)
|
0.351
|
|
Myalgia, %
|
2 (1.3)
|
1(1.0)
|
1(1.8)
|
1.000
|
|
Chill, %
|
4 (2.6)
|
4(4.0)
|
0(0)
|
0.297
|
|
Nausea or vomiting, %
|
8 (5.1)
|
3(3.0)
|
5(8.9)
|
0.136
|
|
Fatigue, %
|
23 (14.7)
|
8(8.0)
|
15(26.8)
|
0.002
|
|
Diarrhea, %
|
2 (1.3)
|
1(1.0)
|
1(1.8)
|
0.359
|
|
Poor appetite, %
|
13 (8.3)
|
4(4.0)
|
9(16.1)
|
0.014
|
|
Disturbance of consciousness, %
|
4 (2.6)
|
0(0)
|
4(7.1)
|
0.015
|
Notes: Data presented as n (%) or median (IQR).
Abbreviations: COVID-19, Coronavirus Disease 2019; IQR, interquartile range; COPD: Chronic obstructive
pulmonary disease
a P values indicate differences between survivors and non-survivors. P< 0.05 was considered statistically
significant.
Compared with successfully discharged patients, the patients who died during hospitalization were older (72.0 years [65.3-83.0] VS 58.0 years [37.0-69.0]), and were more likely complicated with underlying diseases such as hypertension (34 [60.7%] vs 31 [31.0%]), diabetes (20 [35.7%] vs 11 [11.0%]), cardiovascular disease (27 [48.2%] vs 17 [17.0%]), cerebrovascular disease (13 [23.2%] vs 9 [9.0%]), chronic obstructive pulmonary disease (COPD) (15 [26.8%] vs 12 [12.0%]), cancer (11 [19.6%] vs 3 [3.0%]), chronic renal disease (11 [19.6%] vs 4 [4.0%]), and chronic liver disease (12 [21.4%] vs 2 [2.0%]). Compared with survivors, non-survivors were more likely to present with fatigue (15 [26.8%] vs 8 [8.0%]), anorexia (9 [16.1%] vs 4 [4.0%]), and neuropsychic symptoms (4 [7.1%] vs 0) (Table 1).
In terms of laboratory tests, multiple differences between survivors and non-survivors were identified and summarized in Table 2. Specifically, non-survivors had an increased level of white blood cell (WBC) count, neutrophil count, percentage of neutrophils, D-dimer, creatinine, creatine kinase (CK) and lactate dehydrogenase (LDH), as well as higher levels of c-reactive protein (CRP), procalcitonin (PCT) and interleukin-6 (IL-6). Whereas, percentage of lymphocytes, platelet count and albumin levels were significantly lower in non-survivors. In addition, non-survivors had elevated levels of lactate and glucose, accompanied by lower levels of PaO2/FiO2 (Table 3). Futhermore, our result suggested that the level of LYM (%) in COVID-19 patients upon admission was significantly lower than that in the control group. In contrast, the levels of CRP, D-dimer and lactate were higher in COVID-19 patients (Table 4).
Table 2. Laboratory findings of patients infected with COVID-19 on admission to hospital
|
|
Total
(n=156)
|
Survivor
(n=100)
|
Non-survivor
(n=56)
|
P valuea
|
|
WBC count, 109/L
|
6.2 (4.7-8.3)
|
5.6 (4.5-7.2)
|
7.8 (5.5-12.6)
|
<0.001
|
|
Neutrophil count, 109/L
|
4.0 (3.0-6.8)
|
3.4 (2.5-5.0)
|
6.8 (4.5-11.3)
|
<0.001
|
|
Lymphocyte count, 109/L
|
1.2 (0.7-1.7)
|
1.4 (1.0-1.9)
|
0.7 (0.5-1.1)
|
0.503
|
|
NEU (%), %
|
71.0 (58.9-84.4)
|
62.9 (55.3-72.4)
|
86.7 (76.3-91.0)
|
<0.001
|
|
LYM (%), %
|
19.7 (10.5-30.6)
|
27.6 (18.4-33.5)
|
8.7 (4.7-14.3)
|
<0.001
|
|
Hemoglobin, g/L
|
123.7 (114.2-136.6)
|
125.0 (115.5-136.3)
|
122.4 (113.9-135.8)
|
0.246
|
|
Platelet, 109/L
|
194.0 (157.0-249.0)
|
218.5 (172.3-259.5)
|
168.0 (114.0-200.0)
|
<0.001
|
|
Total bilirubin, mmol/L
|
10.9 (7.5-17.2)
|
10.7 (7.5-14.6)
|
13.0 (7.5-25.6)
|
0.057
|
|
LDH, U/L
|
197.0 (159.5-279.0)
|
175.0 (149.0-219.0)
|
310.5 (201.0-479.3)
|
<0.001
|
|
ALT, U/L
|
20.2 (13.5-39.5)
|
19.5 (13.0-37.9)
|
22.1 (14.7-41.5)
|
0.400
|
|
AST, U/L
|
21.7 (16.1-34.2)
|
18.8 (15.1-26.6)
|
30.0 (21.3-55.3)
|
0.002
|
|
Albumin, g/L
|
37.5 (33.8-42.6)
|
39.9 (36.5-43.3)
|
33.1 (29.7-33.6)
|
<0.001
|
|
Globulin, g/L
|
28.7 (24.4-32.9)
|
28.2 (24.1-30.9)
|
31.5 (24.8-34.9)
|
0.014
|
|
BUN, mmol/L
|
4.7 (3.7-6.2)
|
4.2 (3.3-5.3)
|
6.2 (5.0-10.8)
|
<0.001
|
|
Creatinine, μmol/L
|
66.1 (50.3-84.2)
|
64.8 (50.9-75.1)
|
74.2 (47.0-126.9)
|
0.008
|
|
CK, U/L
|
68.0 (45.0-121.0)
|
63.0 (40.0-96.0)
|
112.8 (62.3-245.0)
|
0.028
|
|
CK-MB, U/L
|
1.6 (0.8-4.6)
|
0.9 (0.7-1.4)
|
4.3 (1.7-13.3)
|
0.044
|
|
troponin I, pg/ml
|
20.0 (4.1-57.5)
|
10.0 (3.0-20.0)
|
50.0 (22.3-115.0)
|
0.013
|
|
BNP, ng/L
|
118.5 (32.5-392.7)
|
56.8 (20.0-132.9)
|
374.7 (135.1-814.5)
|
0.069
|
|
D-dimer, mg/L
|
1.0 (0.4-4.6)
|
0.7 (0.2-1.6)
|
3.3 (1.2-7.8)
|
0.025
|
|
CRP, mg/L
|
0.9 (0.1-3.6)
|
0.2 (0.1-1.6)
|
4.1 (2.5-7.2)
|
<0.001
|
|
Procalcitonin, ng/mL
|
0.06 (0.04-0.14)
|
0.05 (0.04-0.06)
|
0.37 (0.12-0.77)
|
0.022
|
|
IL-6, pg/mL
|
7.1 (2.4-24.7)
|
2.9 (1.5-7.4)
|
79.6 (9.6-212.5)
|
0.027
|
|
CD19+, count/μL
|
12.6 (9.0-18.9)
|
11.1 (8.6-17.0)
|
16.6 (10.1-19.1)
|
0.292
|
|
CD3+, count/μL
|
68.9 (57.4-75.3)
|
70.6 (62.0-76.7)
|
66.8 (54.6-71.4)
|
0.329
|
|
CD4+, count/μL
|
38.8 (34.6-46.0)
|
38.8 (31.4-45.2)
|
39.4 (36.2-52.5)
|
0.183
|
|
CD8+, count/μL
|
25.3 (19.2-32.3)
|
26.7 (19.6-33.9)
|
20.5 (13.9-30.5)
|
0.063
|
|
CD4/CD8
|
1.6 (1.1-2.3)
|
1.5 (1.0-2.1)
|
1.8 (1.2-3.9)
|
0.071
|
Notes: Data presented as n (%) or median (IQR).
Abbreviations: COVID-19, Coronavirus Disease 2019; WBC, White blood cell; NEU (%), Percentage of neutrophils; LYM (%): Percentage of lymphocytes; LDH, Lactate dehydrogenase; ALT, Alanine aminotransferase; AST, Aspartate aminotransferase; BUN, Blood urea nitrogen; CK, Creatine kinase-MB; CK-MB, Creatine kinase-MB; BNP, Brain natriuretic peptide; CRP, C-reactive protein; IL-6, Interleukin-6
a P values indicate differences between survivors and non-survivors. P< 0.05 was considered statistically significant.
Table 3. Blood gas analysis of patients infected with COVID-19
|
|
Total
(n=156)
|
Survivor
(n=100)
|
Non-survivor
(n=56)
|
P valuea
|
|
Ph
|
7.44 (7.39-7.47)
|
7.43 (7.40-7.46)
|
7.45 (7.39-7.48)
|
0.970
|
|
PaO2, mm Hg
|
91.0 (64.3-119.0)
|
95.0 (79.0-129.0)
|
72.0 (50.0-116.0)
|
0.049
|
|
PaO2/FiO2, mm Hg
|
195.0 (90.0-262.5)
|
225.0 (152.5-287.5)
|
117.5 (78.3-192.9)
|
<0.001
|
|
PaCO2, mm Hg
|
38.0 (34.0-42.0)
|
40.0 (35.0-45.0)
|
36.0 (33.0-40.0)
|
0.113
|
|
BE, mmol/L
|
1.9 (-0.7 – 4.1)
|
2.1 (-0.1 – 3.9)
|
1.2 (-1.8 – 4.6)
|
0.300
|
|
K+, mmol/L
|
3.8 (3.4-4.1)
|
3.8 (3.5-4.2)
|
3.8 (3.3-4.1)
|
0.768
|
|
Na+, mmol/L
|
140.0 (136.0-143.8)
|
141.0 (138.0-144.0)
|
137.0 (133.0-142.0)
|
0.641
|
|
Ca2+, mmol/L
|
0.9 (0.7-1.0)
|
0.9 (0.7-1.1)
|
0.9 (0.7-1.0)
|
0.482
|
|
Lactate, mmol/L
|
1.7 (1.2-2.3)
|
1.5 (1.1-2.1)
|
2.0 (1.5-2.9)
|
0.005
|
|
Hematocrit, %
|
37.0 (32.0-41.0)
|
38.0 (32.5-42.0)
|
36.0 (30.0-40.0)
|
0.627
|
|
Glucose, mmol/L
|
6.7 (5.4-8.7)
|
5.9 (4.9-7.9)
|
7.4 (6.2-11.1)
|
0.034
|
Notes: Data presented as median (IQR).
Abbreviations: COVID-19, Coronavirus Disease 2019; PaO2, Partial pressure of oxygen; PaO2, Partial pressure of carbon dioxide; BE, Base excess
a P values indicate differences between survivors and non-survivors. P< 0.05 was considered statistically significant.
Table 4. Comparision of the laboratory levels between the COVID-19 and healthy control group
|
|
Covid-19 group (n=156)
|
Control group (n=20)
|
P value
|
|
Age, years
|
66.0 (46.3-73.0)
|
66.0 (44.8-73.3)
|
0.968
|
|
Male, %
|
76 (48.7)
|
10 (50)
|
0.886
|
|
WBC count, 109/L
|
6.2 (4.7-8.3)
|
5.6 (4.0-7.0)
|
0.090
|
|
LYM (%), %
|
19.7 (10.5-30.6)
|
27.2 (22.2-34.1)
|
0.003
|
|
Creatinine, μmol/L
|
66.1 (50.3-84.2)
|
67.8 (53.5-75.0)
|
0.891
|
|
CRP, mg/L
|
0.9 (0.1-3.6)
|
0.4 (0.1-0.6)
|
0.016
|
|
D-dimer, mg/L
|
1.0 (0.4-4.6)
|
0.4 (0.2-0.7)
|
<0.001
|
|
Lactate, mmol/L
|
1.7 (1.2-2.3)
|
1.2 (0.8-1.4)
|
<0.001
|
Notes: Data presented as n (%) or median (IQR).
Abbreviations: COVID-19, Coronavirus Disease 2019; WBC, White blood cell; LYM (%): Percentage of lymphocytes; CRP, C-reactive protein
P< 0.05 was considered statistically significant.
150 (96.2%) patients received antibiotics and 139 (89.1%) received antiviral treatment. Unsurprisingly, systematic corticosteroid was more commonly applied in non-survivors. 56 patients (35.9%) received high-flow nasal cannula oxygen therapy, 44 (28.2%) received non-invasive mechanical ventilation and 19 patients (12.2%) required invasive mechanical ventilation support. 6 patients (3.8%) received renal replacement therapy (RRT) and no patients were treated with extracorporeal membrane oxygenation therapy. Oxygen support (including high oxygen flow, noninvasive assisted ventilation, and mechanical ventilation) and renal replacement therapy were more commonly applied in non-survivors (Table 5).
Table 5. Treatments of patients infected with COVID-19
|
|
Total
(n=156)
|
Survivor
(n=100)
|
Non-survivor
(n=56)
|
P valuea
|
|
Antibiotics, %
|
150 (96.2)
|
96 (96.0)
|
54 (96.4)
|
1.000
|
|
Antiviral treatment, %
|
139 (89.1)
|
89 (89.0)
|
50 (89.3)
|
0.956
|
|
Corticosteroids, %
|
60 (38.5)
|
22 (22.0)
|
38 (67.9)
|
<0.001
|
|
Intravenous immunoglobulin, %
|
51 (32.7)
|
18 (18.0)
|
33 (58.9)
|
<0.001
|
|
High-flow nasal cannula oxygen therapy, %
|
56 (35.9)
|
26 (26.0)
|
30 (53.6)
|
0.001
|
|
Non-invasive mechanical ventilation, %
|
44 (28.2)
|
13 (13.0)
|
31 (55.4)
|
<0.001
|
|
Invasive mechanical ventilation, %
|
19 (12.2)
|
1 (1.0)
|
18 (32.1)
|
<0.001
|
|
RRT, %
|
6 (3.8)
|
1 (1.0)
|
5 (8.9)
|
0.023
|
Notes: Data presented as n (%).
Abbreviations: COVID-19, Coronavirus Disease 2019; RRT, Renal replacement therapy
a P values indicate differences between survivors and non-survivors. P< 0.05 was considered statistically
significant.
The clinical outcomes of the enrolled 156 COVID-19 patients were summarized in Table 6. Unsurprisingly, non-survivor patients were more likely to develop complications compared with survivors. Respiratory failure was the most frequently developed complication (106 [67.9%]), followed by sepsis (103 [66.0%]), ARDS (67 [42.9%]), septic shock (50 [32.1%]), arrhythmia (42 [26.9%]), acute cardiac injury (26 [16.7%]), cardiac failure (24 [15.4%]), and acute kidney injury (18 [11.5%]). The median time from disease onset to admission was 10.0 days (IQR 4.3-16.0). And the median time from disease onset to discharge was 36.0 days (IQR 27.3-48.0), whereas the median time to death was 17.0 days (IQR 10.0-26.5). After comparing the time from disease onset to hospital admission and total hospital stay between non-survivors with survivors [(median time, 6.0 days [1.0-10.0] vs 14.5 days [7.0-20.0]) and (median time, 9.0 days [3.3-16.0] vs 22.0 days [16.0-29.0]) respectively], it seemed like the disease progressed more rapidly in non-survivors.
Table 6. Outcomes of patients infected with COVID-19
|
|
Total
(n=156)
|
Survivor
(n=100)
|
Non-survivor
(n=56)
|
P valuea
|
|
Arrhythmia, %
|
42 (26.9)
|
13 (13.0)
|
29 (51.8)
|
<0.001
|
|
Sepsis, %
|
103 (66.0)
|
49 (49.0)
|
54 (96.4)
|
<0.001
|
|
ARDS, %
|
67 (42.9)
|
17 (17.0)
|
50 (89.3)
|
<0.001
|
|
Respiratory failure, %
|
106 (67.9)
|
50 (50.0)
|
56 (100)
|
<0.001
|
|
Cardiac failure, %
|
24 (15.4)
|
11 (11.0)
|
13 (35.9)
|
0.043
|
|
Septic shock, %
|
50 (32.1)
|
9 (9.0)
|
41 (73.2)
|
<0.001
|
|
Acute kidney injury, %
|
23 (14.7)
|
8 (8.0)
|
15 (26.8)
|
0.002
|
|
Acute cardiac injury, %
|
26 (16.7)
|
6 (6.0)
|
20 (35.7)
|
<0.001
|
|
Onset to admission, days
|
10.0 (4.3-16.0)
|
14.5 (7.0-20.0)
|
6.0 (1.0-10.0)
|
<0.001
|
|
Hospitalization, days
|
18.0 (11.0-27.8)
|
22.0 (16.0-29.0)
|
9.0 (3.3-16.0)
|
<0.001
|
|
Onset to discharge or death, days
|
30.0 (21.0-42.8)
|
36.0 (27.3-48.0)
|
17.0 (10.0-26.5)
|
<0.001
|
Notes: Data presented as n (%) or median (IQR).
Abbreviations: COVID-19, Coronavirus Disease 2019; ARDS, Acute respiratory distress syndrome
a P values indicate differences between survivors and non-survivors. P< 0.05 was considered statistically
significant.
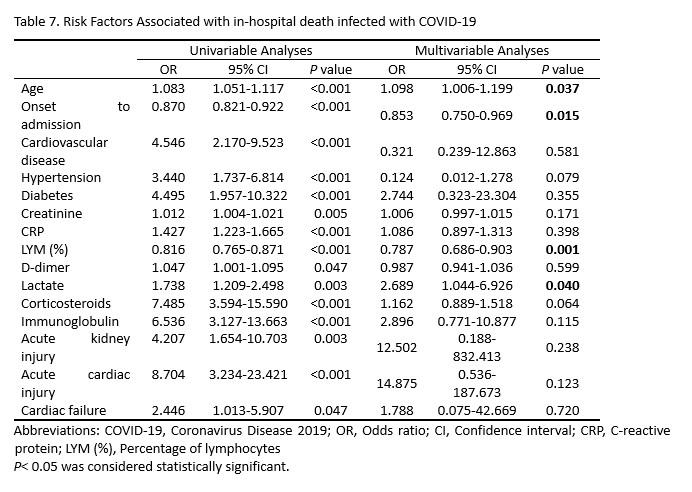
Next, multivariable logistic regression assay discovered that age (OR [odds ratio]=1.098, 95% CI [confidence interval]: 1.006-1.199, P=0.037), duration from onset to admission (OR=0.853, 95% CI: 0.750-0.969, P=0.015), LYM (%) at admission (OR=0.787, 95% CI: 0.686-0.903, P=0.001), and lactate at admission (OR=2.689, 95% CI: 1.044-6.926, P=0.040) were independent risk factors for in-hospital death of COVID-19 pneumonia (Table 7).
The Kaplan-Meier survival curve showed a trend toward poorer survival in COVID-19 patients with increased lactate levels and/or decreased LYM (%) upon admission (P=0.020 and P<0.001, respectively) (Fig. 1). In addition, we conducted the ROC curve assay and calculated the AUC among the following three indicators. We discovered that the AUC of LYM (%) was 0.903 (95% CI, 0.856-0.949), 0.792 (95% CI, 0.720-0.863) for D-dimer and of 0.651 (95% CI, 0.555-0.748) for lactate (Fig. 2). Comparing to the other indicators, the AUC of LYM (%) was higher in predicting in-hospital death (LYM [%] VS D-dimer, P=0.003; LYM [%] VS lactate, P<0.001; respectively). Furthermore, we discovered that the cutoff value of LYM (%) for predicting in-hospital death was 14.7%.