SARS-CoV-2 screening of Care Homes
During the Coronavirus pandemic, SARS-CoV-2 prevalence was obtained by individually testing of 25,386 people from 306 Galician Care Homes: 16,477 residents, 8,599 workers and 310 not specified. The mean age of workers and residents was 44.25 years (min 18, max 69) and 80.07 years (min 3, max 109), respectively. SARS-CoV-2 was detected in 852 people (3.32%, 95% CI: 3.10% - 3.54%). The distribution of institutions by SARS-CoV-2 prevalence is shown in figure 1. A total of 282 institutions (21,861 people) had SARS-CoV-2 prevalence <4%, including 263 institutions (19,091 people) with prevalence zero. Prevalence from 5-10% was observed in 2 institutions (389 people), from 10-20% in 11 institutions (1,817 people) and from 20-60% in 11 institutions (1,309 people).
Cq value distribution for positive samples was as follows: minimum 15.03/15.41, 1st quartile 21.86/22.55, median 26.41/27.54, 3rd quartile 31.36/33.60 and maximum 35.86/39.06 for ORF1b and E gene, respectively. Additional data of distribution and Cq values of positive samples detected during SARS-CoV-2 screening of Care Homes are available as additional files 1-3.
Pool positivity assessment
The selection of the optimal pool size should be made before the implementation of pooling testing. With non-overlapping pools, only positive pools will be retested. The reduction of the expected number of tests depends on the prevalence, the initial pool size and the number of stages for the pooling algorithm. In fact, it is generally accepted that 5% could be the prevalence threshold to achieve a 50% reduction in the expected number of tests per individual. On the other hand, the sensitivity and specificity of the global process depends on the analytical characteristics of the test and on the number of times one sample is retested. Differences in the expected number of tests per individual, based on mathematical simulations, could help to choose the best set of pool sizes. According to other authors (11), for prevalence between 1 and 2%, sensitivity 95% and specificity 100%, the optimal pool size would be between 25 and 16 samples and the optimal sub pool size would be between 4-5 samples. In order to minimize the false negative factor for pooled testing recently defined (3) and to standardize the pooling method, pools of twenty samples (P20) and sub pools of five samples (SP5) were selected.
Test performance of twenty-six P20 and fourteen SP5 was studied. Each pool included one positive sample. A total of twenty-six positive samples were tested. Mean Cq values were 27.43 and 28.68 for ORF1/b and E gene, respectively. A boxplot of paired Cq values is shown in figure 2. All positive samples yielded a global positive result when tested in P20 or SP5. Sensitivity of E, RdRP and N gene was, respectively, 88.5% (23/26), 84.6% (22/26) and 96.1% (25/26) for P20. Sensitivity was 92.9% (13/14) for the three targets for SP5.
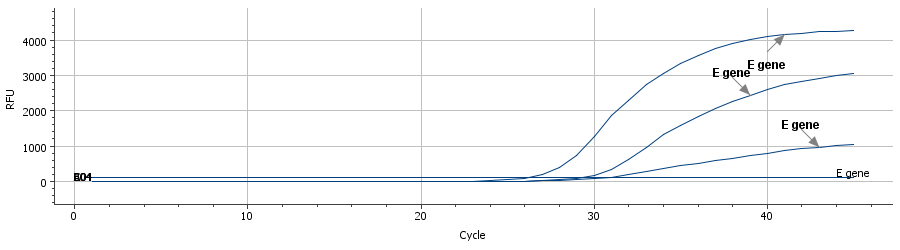
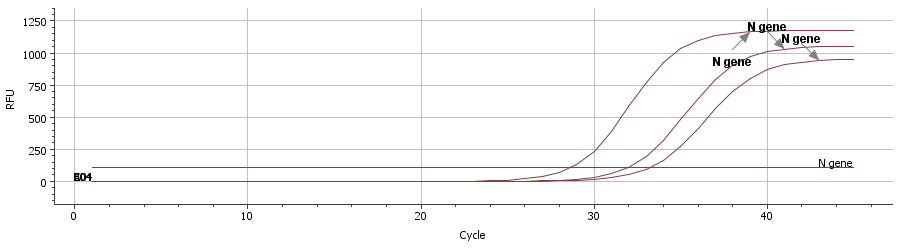
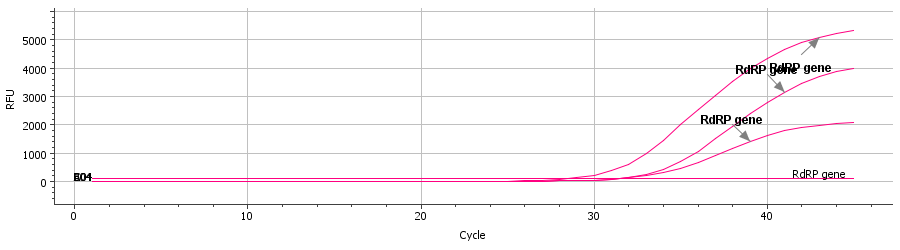
Mean delay in the Cq values (Cq pool– Cq positive sample) was 5.02 cycles for the P20 and 2.85 cycles for the SP5 (table 1). An example of the amplification curves obtained for one particular sample is shown in additional files 4-6. The N gene was not detected by Allplex™2019-nCoV assay in one specific sample independently of pooling or individual testing.
Table 1. Differences in quantification cycle (Cq) values between pooling and individual testing by Allplex™2019-nCoV assay:
|
Pool size
|
Parameter
|
Testing Condition
|
E gene
Mean (range)
|
N gene
Mean (range)
|
RdRP gene
Mean (range)
|
|
|
P20 (n=26)
|
Cq value
|
individual
|
24.63
(12.96, >40)
|
27.79
(15.4, >40)
|
26.23
(13.69, 33.45)
|
|
|
pool
|
29.67
(16.48, >40)
|
32.65
(19.9, >40)
|
31.39
(18.2, >40)
|
|
|
difference
|
5.04
(-1.06, 13.15)
|
4.86
(-0.42, 11.52)
|
5.16
(-1.39, 11.57)
|
|
|
SP5 (n=14)
|
Cq value
|
individual
|
21.38
(12.96, 28.48)
|
25.92
(15.4, >40)
|
23.34
(13.69, 31.15)
|
|
|
pool
|
24.49
(14.5, >40)
|
28.30
(18.23, >40)
|
26.42
(16.48, >40)
|
|
|
difference
|
3.11
(-2.26, 13.01)
|
2.37
(-2.32, 6.66)
|
3.08
(-3.33, 10.22)
|
|
NOTE: P20: Pool of 20 samples. SP5: sub pool of 5 samples. Cq: Quantification cycle.
Proof of concept
Samples from Care Homes selected by prevalence were retrospectively tested in pools using the following algorithm: P20, SP5 when positive, individual analysis when positive. A first simulation was performed with 100 samples from 2% (95% CI: 0.24%-7.04%, 2/100) prevalence Care Homes. Five P20 were tested. As 2 positive pools were obtained, 8 SP5 were processed. Two SP5 were positive, so 10 samples were tested individually. Two samples were positive. Number of tests was reduced 77% (0.23 tests per individual).
A second simulation included 60 samples from 1.7% (95% CI: 0.04%-8.94%, 1/60) prevalence institutions. Three P20, 4 SP5 and 5 individual samples were tested. One sample was positive. Number of tests was reduced by 80% (0.20 tests per individual).