2.2 Hydrodynamics
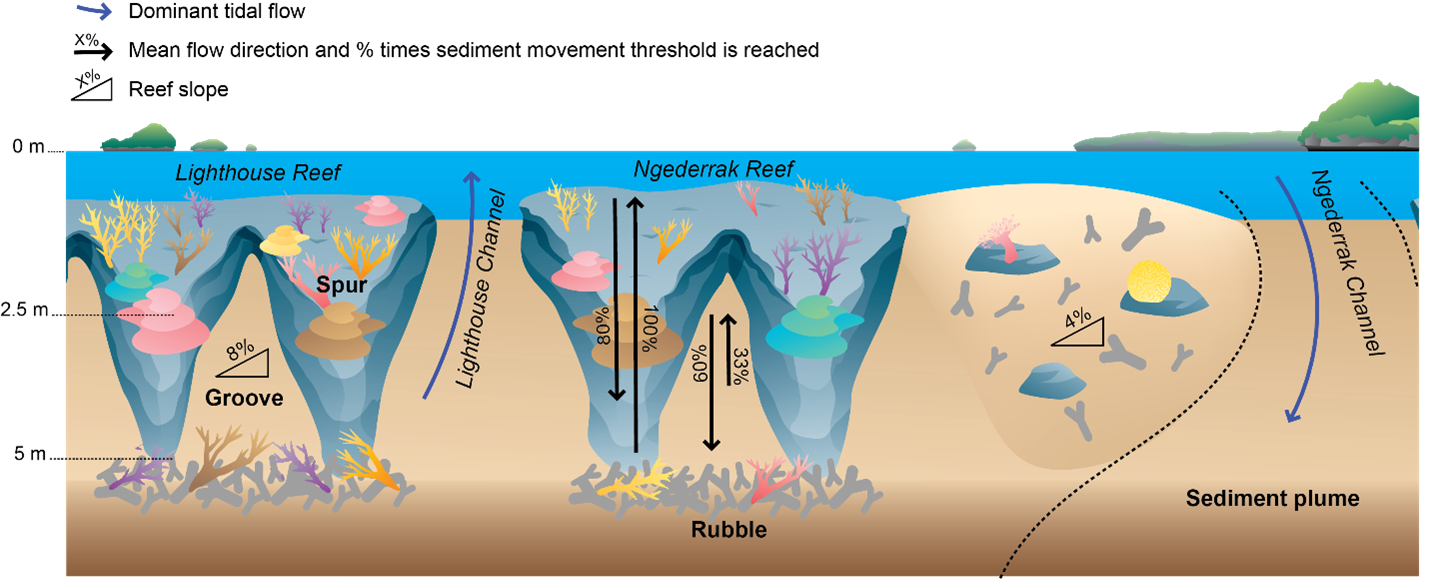
Bathymetry data were shared by the Palau Automated Land and Resources Information System (PALARIS) as a Digital Elevation Model (DEM) form LiDAR (Light Detection and Ranging). We employed the Hillshade function in QGIS 3.32.3 on the DEM to generate shaded relief based on the angle of incidence of simulated light, providing enhanced visualizations of topographic features. To assess large scale flow patterns characterizing the reef tract, current speed and heading were measured at several points along Ngederrak Reef and in the north of Lighthouse Reef (Fig. 1a). Wind data to compare with flow measurements were found at https://coralreefpalau.org. Two Nortek Acoustic Doppler Profilers (ADPs) were deployed in Ngederrak North (NDK-N) and at the beginning of the SAG area (NDK-midN; Table 1). The instruments were set to collect velocities in 120 sec intervals, in 1 Hz sampling rates and 50 cm cell sizes. The ADPs also recorded pressure, data that was used to infer tidal water level variability. Four Lowell Tilting Current Meters (TCMs) were installed in the south of Ngederrak (NDK-midS and NDK-S) and in the north of Lighthouse (LH1, LH2; Table 1). The TCMs measured current speed and heading from at near the seabed, with 1 second intervals. Current speed and heading from TCMs and ADPs at ~ 0.5 m above seabed was analyzed for the period June 28th – July 1st 2022 (including a new moon), to produce wind rose plots showing strength and frequencies of the near-bed flows as a function of direction.
Table 1
Deployment dates and instruments with relative sites and depths. Instruments used included acoustic doppler profilers (ADP), acoustic doppler velocimeters (ADV), and tilting current meters (TCM)
|
Site
|
Date
|
Depth
|
Instrument
|
|
LH1
|
June 26th – July 6th 2022
|
8
|
TCM
|
|
LH2
|
June 26th – July 6th 2022
November 2021
|
8
6
|
TCM
ADP (2021)
|
|
NDK-S
|
June 26th – July 6th 2022
|
9
|
TCM
|
|
NDK-midS
|
June 26th – July 6th 2022
|
4
|
TCM
|
|
NDK-midN
|
June 26th – July 6th 2022
|
4
|
ADP
|
|
NDK-N
|
June 26th – July 6th 2022
|
7
|
ADP
|
|
1AS
|
July 13th – July 28th 2022
July 29th – August 12th 2023
|
2
|
TCM
|
|
2AS
|
July 13th – July 28th 2022
July 29th – August 12th 2023
|
2
|
TCM
|
|
1AG
|
July 13th – July 28th 2022
July 29th – August 12th 2023
|
2.6
|
TCM,
ADV
|
|
2AG
|
July 13th – July 28th 2022
July 29th – August 12th 2023
|
4
|
TCM,
ADV
|
|
3AG
|
July 13th – July 28th 2022
July 29th – August 12th 2023
|
5.4
|
TCM,
|
|
1BS
|
July 13th – July 28th 2022
July 29th – August 12th 2023
|
2
|
TCM,
ADV
|
|
2BS
|
July 13th – July 28th 2022
July 29th – August 12th 2023
|
2
|
TCM
|
|
1BG
|
July 13th – July 28th 2022
July 13th – July 28th 2022
July 29th – August 12th 2023
|
2.3
|
TCM
|
|
2BG
|
July 13th – July 28th 2022
July 29th – August 12th 2023
|
3.4
|
TCM
|
|
3BG
|
July 13th – July 28th 2022
July 29th – August 12th 2023
|
5.7
|
TCM
|
|
4SAG
|
July 29th – August 12th 2023
|
7
|
ADP
|
|
1C
|
July 13th – July 28th 2022
|
3
|
TCM
|
|
2C
|
July 13th – July 28th 2022
|
4
|
TCM
|
|
3C
|
July 13th – July 28th 2022
|
4.5
|
TCM
|
|
4C
|
July 13th – July 28th 2022
|
6.1
|
ADP
|
Two subsequent deployments (2022 and 2023, Table 1) were carried out to investigate smaller-scale flow variability within the SAG and non-SAG areas (Fig. 1b, c) TCMs were installed on two transects perpendicular to the reef crest in sets of 3, on top of two adjacent spurs (all at equivalent depths of ~ 2m), and in the corresponding grooves (at depths between 2 and 6 m; Fig. 1c). Three additional TCMs were placed in the northern area without SAGs in a similar across-shore transect as those placed in the grooves (Fig. 1b). Additionally, in 2022, an ADP was installed at the seaward side of the non-SAG area (4C). In 2023, an ADP was also deployed in the middle section of a groove (2AG), and offshore of the SAGs (4SAG, Table 1).
Nortek Acoustic Doppler Velocimeters (ADVs) were deployed at 1AG, 2AG, and 2BS with measurement heights at 45 cmab. The placement of these instruments was targeted to capture bed shear stress on spurs and grooves. All deployments were designed to capture spring and neap tidal flows. Reef slope was calculated from transect 1AG-3AG, 1C-3C, using distance and difference in depth between sites.
2.3 Sediment size and sorting
To infer the dynamics of sediment transport and deposition to compare with relative hydrodynamic measurements, sediment was collected from two different grooves (1-3AG, 1-3BG and 4SAG) and from the non-SAG area (1C-4C), at the locations of each hydrodynamic instrument (Figs. 1b, c). Ziplock bags were used to scoop sand from the seabed. Bags were opened and one side of the opening was inserted in the sediment (roughly 5 cm deep), then bags were lifted and sealed. Subsequently, an 80 ml beaker was used to collect sediment from the ziplock bags, until the 80 ml line was reached. Filling the beakers caused resuspension of fine sediment, so beakers were left to decant for 5 minutes, until the excess water was clear. We carefully removed this excess water to avoid resuspension of fine sediment and kept the samples in an oven for 3 days at 60°C to dry. Once the sediment was dry it was weighed, and the average dry weight was 95 grams. After weighing the samples were manually sieved for 10 minutes using sieves ranging from 4 mm to 0.062 mm. Each size fraction was then weighed on a scale with centigram sensitivity. Cumulative sediment weight curves were used to calculate Phi (\({\Phi }\)), percentiles for grain-size analysis. The Phi scale is a convenient way to describe a wide range of grain sizes in a compact and standardized manner (McLaren and Bowles, 1985).
$${\Phi } = -{\text{l}\text{o}\text{g}}_{2}\left(D\right)$$
The sediment sorting level with the inclusive graphic standard deviation (\(SD\)) was calculated following:
$$SD{\Phi } = \frac{{\Phi }84 - {\Phi }16}{4} + \frac{{\Phi }95 - {\Phi }5}{6.6}$$
And size classification with the graphic mean (\(M\)) following:
$$M{\Phi } = \frac{{\Phi }16 + {\Phi }50 + {\Phi }84}{3}$$
Using frequency curves, the sorting level was estimated from the graphic standard deviation (\(SD{\Phi }\)), mean (\(M{\Phi }\)) and median (\({\Phi }50\)) values. Samples compared by grain size and sediment sorting was assessed across sites.
2.4 Sediment movement threshold
Sediment motion in coastal systems may be driven by unidirectional currents, oscillatory wave velocities or a combination of the two (Pomeroy et al. 2021). We considered the potential effects of both mean currents (Bian et al. 2023a) and waves (Bian et al. 2023b) using the best available science for coral reef sediments.
Shear stress (\({\tau }_{b}\)) and drag coefficients (\({C}_{D}\)) were calculated from vertical (\(w{\prime }\)) and
horizontal (\(u{\prime }\)) components of turbulence velocities in 10-minute intervals as:
$$\frac{{\tau }_{b}}{\rho }= \stackrel{-}{u{\prime }w{\prime }}={u}_{*}^{2}={C}_{D}\stackrel{-}{u}\left|\overrightarrow{\stackrel{-}{u}}\right|$$
where \(\rho\) is sea water density and \(\stackrel{-}{u}\) the mean flow speed measured by the TCM. Variance in velocities due to waves was removed following the method described in Benilov and Filyushkin (1970). The peak near-bed orbital wave velocities (\({u}_{m}\)) at each site were estimated from the root mean square of detrended, 10-minute timeseries of TCM or ADV horizontal velocities (\({u}_{rms}\)) as \({u}_{m}={u}_{rms}\sqrt{2}\) (Soulsby 1987).
The initiation of motion of sediment in a unidirectional flow can be quantified with the Shields parameter (\(\theta\)) – a dimensionless quantity that quantifies the relative importance of bed shear stress to sediment grain weight (Cao et al. 2006). It is defined as:
$$\theta =\frac{{\tau }_{b}}{{(\rho }_{s}-\rho )gD}= \frac{\rho {u}_{*}^{2} }{sgD}$$
where \(D\) is sediment particle diameter; \(g\) is the gravitational acceleration; \(s = {\rho }_{s} - \rho\), where \({\rho }_{s}\) is the density of calcium carbonate and \(\rho\) the density of sea water; \(s=s/w-1\) is the submerged specific weight of sediment; \({u}_{*}\) is the friction velocity.
The critical condition for incipient motion of sediment in unidirectional flows is the critical Shields parameter \({\theta }_{crit}\). A value of \(\theta\) above \({\theta }_{crit}\) indicates that sediment transport is likely taking place.
Bian et al. (2023a) developed a critical Shields parameter specific to tropical shallow coral reef sediments:
\({\theta }_{crit} = \frac{0.163}{1.003 + {Re}_{*}}\) \(+ 0.0389(1 - {1.353e}^{-0.039{Re}_{*}}) (1 < {Re}_{*} < {10}^{3})\)
\({\theta }_{crit}\) is a nonlinear function of the shear Reynolds number (Cao et al. 2006), defined as \({Re}_{*}=\frac{ {u}_{*}D}{v}\), where \(v\) is the kinematic viscosity of seawater. Because of the high variability of shape, sizes, and weight of coral reef carbonate sediments, using a single critical value to define a threshold may introduce error. An upper and lower limit were developed to account for this variability (Bian et al. 2023a).
Oscillatory motion due to waves is expected to influence sediment motion in the shallow Ngederrak fore reef. Bian et al. 2023b found that the critical Shields parameter poorly predicted the initiation of sediment motion under oscillatory flows, but a threshold derived from near-bed peak wave orbital velocities (\({u}_{m}\)) demonstrated better predictive capacity. The critical peak orbital velocity \({(u}_{m,crit})\) for sediment motion was determined to be:
\({u}_{m,crit}={\left(0.081\right)}^{4/7} {\pi }^{3/7}{\left[g\left(s-1\right)\right]}^{4/7}{D}^{3/7}{T}^{1/7}S{f}^{0.206}\) for D > 0.5 mm
where \(T\) is the wave period and \(Sf\) the shape factor of the sediment grains. As sediment shape factors were not characterized for our samples, we used \(Sf\) = 0.74 to be consistent with Bian et al. (2023b)’s sediment sample with the smallest median grain diameter (0.57 mm).
While waves and currents are expected to interact in enhancing sediment suspension and movement, equations describing the threshold of motion for coral reef sediments in combined wave-current flows are currently lacking. Hence, we chose here to consider each of these physical processes separately and only speculate about the potential transport due to their interaction.
In addition to estimating critical thresholds for sediment motion, acoustic backscatter measurements from ADPs placed at stations NDK-N and NDK-midN in June-July 2022, and 2AG in July-August 2023 were examined for qualitative comparison of suspended sediment concentrations. In addition to these, data from November 2021 recorded by another ADP deployment (for another study) close to site LH2 were used to compare backscatter dynamics between the two channels. Acoustic backscatter, recorded in counts, is a function of the type and concentration of particles in the water, as well as ADP frequency. Only the bottom measurements closest to the seafloor and to the instruments were considered for this analysis because accuracy of sampling decreases with distance from the instrument. The influence of orbital (\({u}_{m}\)) and mean across shore flow velocity on backscatter was tested with linear models run in R.