The study comprised 31 patients (62 eyes). The mean age of the 19 women (61.29%) and 12 men (38.71%) was 42.58 ± 3.06 (SD) years (range 40 to 50 years), and the mean addition for binocular near vision was 0.34 ± 0.46 D. Supplemental Table 1 shows the preoperative characteristics in dominant eyes and nondominant eyes by group.
Efficacy, Accuracy and Safety
At the 3-month follow-up, the mean UDVA was − 0.07 ± 0.08 in the dominant eye, with a mean residual spherical equivalent (SE) defect of 0.01 ± 0.33 D (range: -0.75 to 0.63 D). In the nondominant eye, the UDVA was − 0.01 ± 0.09, with a mean residual SE defect of -0.38 ± 0.36 D (range: 0.13 to -1.00 D).
Figure 1 shows the standard graphs for reporting outcomes of refractive surgery in dominant eye. The accuracy of the achieved spherical equivalent compared to the intended target was within ± 1.00 D in all (100%) dominant eye treated, whereas 90% of eyes were within ± 0.50 D (Fig. 1D).
All surgeries were uneventful, with no infection, inflammation, or intraoperative complications noted in any of the patients enrolled in the study. No eyes lost lines of CDVA at 3 months post-surgery.
Binocular visual acuity and defocus curves
For all patients, the mean postoperative uncorrected binocular visual acuity at distance, intermediate, and near was − 0.11 ± 0.07 logMAR, -0.06 ± 0.10 logMAR, and 0.04 ± 0.11 logMAR separately. The binocular defocus curve is shown in Fig. 2A. Regarding the defocus range from 0 D to – 2.50 D (from far to near distance of 40 cm), the mean uncorrected visual acuity was maintained above 20/25.
After surgery, 7 patients showed emmetropia status and 2 showed hyperopia status in the non-dominant eye, and there were 2 patients refused to repeat binocular tests with spectacles. Eventually, only 20 patients had residual myopia in the non-dominant eye corrected with spectacles and serving as control group. Postoperative binocular visual outcome in monovision compared to full distance correction are shown in Table 1. The two groups had comparable mean binocular UINA. For the distant visual acuity, better outcome was achieved in the full distance correction group (P = 0.02); for the near visual acuity at 40cm, superior result was observed in the monovision group instead (P = 0.04). Similarly, as shown in Fig. 2B, patients in the monovision group showed significant better results regarding the defocus range from – 2.00 D to – 3.00 D (corresponding to a distance range of 50–33 cm).
Table 1
Comparison of binocular visual acuity between monovision and full distance correction
| |
Monovision (n = 20)
|
Full Distance Correction (n = 20)
|
P
|
|
Mean ± SD
|
Range
|
Mean ± SD
|
Range
|
|
|
UDVA (LogMAR)
|
-0.07 ± 0.06
|
0, -0.18
|
-0.10 ± 0.04
|
-0.08, -0.20
|
0.02*
|
|
UIVA (LogMAR)
|
-0.03 ± 0.09
|
-0.20, 0.20
|
-0.04 ± 0.09
|
0.10, -0.20
|
0.68
|
|
UNVA (LogMAR)
|
0.07 ± 0.11
|
-0.10, 0.40
|
0.12 ± 0.19
|
-0.10, 0.70
|
0.04*
|
| UDVA = uncorrected distance visual acuity; UIVA = uncorrected intermediate visual acuity; UNVA = uncorrected near visual acuity; |
All values are presented as mean ± standard deviation; The Wilcoxon rank-sum test was used to compare differences between the two groups
* statistically significance
Corneal Asphericity, Aberrations, and Image Quality
Corneal asphericity and objective image quality before and after treatment are summarized in Table 2. Compared to preoperative measurements, postoperative examinations showed corneal asphericity was more positive in both dominant eyes and non-dominant eyes (P < 0.05). The RMS of total HOAs, coma and SA significantly increased after the surgery (P < 0.05) when measured over a 6mm pupil. However, the SR value did not show statistically significant changes due to the surgery.
Table 2
Preoperative and postoperative corneal asphericity, aberrations, and objective image quality (6mm)
|
Parameters
|
Dominant Eye (n = 31)
(Mean ± SD)
|
Nondominant Eye (n = 31)
(Mean ± SD)
|
|
Preop
|
Postop
|
P
|
Preop
|
Postop
|
P
|
|
Q value
|
-0.15 ± 0.12
|
0.46 ± 0.45
|
< 0.001*
|
-0.15 ± 0.11
|
0.63 ± 0.55
|
< 0.001*
|
|
Total HOAs (µm)
|
0.47 ± 0.14
|
0.94 ± 0.34
|
< 0.001*
|
0.46 ± 0.11
|
0.92 ± 0.34
|
< 0.001*
|
|
SA (µm)
|
0.25 ± 0.09
|
0.56 ± 0.22
|
< 0.001*
|
0.25 ± 0.07
|
0.59 ± 0.23
|
< 0.001*
|
|
Coma (µm)
|
0.23 ± 0.14
|
0.61 ± 0.33
|
< 0.001*
|
0.23 ± 0.12
|
0.55 ± 0.31
|
< 0.001*
|
|
SR
|
0.13 ± 0.05
|
0.15 ± 0.04
|
0.08
|
0.15 ± 0.04
|
0.14 ± 0.04
|
0.50
|
| HOAs = higher-order aberrations; SA = spherical aberration; SR = strehl ratio; preop = preoperative; postop = postoperative |
All values are presented as mean ± standard deviation; The Wilcoxon rank-sum test was used to compare differences before and after the operation.
* statistically significance
Binocular accommodation function
Table 3 shows the results of the assessment of binocular accommodation function. The postoperative NRA was on average about 0.71 D higher than the preoperative value (P < 0.001), but binocular minus-lens-stimulated AA and PRA did not show any statistically significant changes before and after surgery.
Table 3
Preoperative and postoperative accommodation function
|
Parameters
|
Preop (n = 31)
|
Postop (n = 31)
|
P
|
|
Mean ± SD
|
Range
|
Mean ± SD
|
Range
|
|
|
AA (D)
|
3.91 ± 1.16
|
2.50, 6.50
|
3.58 ± 0.91
|
2.50, 5.50
|
0.08
|
|
NRA (D)
|
1.70 ± 0.52
|
0.50, 2.75
|
2.41 ± 0.49
|
1.50, 3.50
|
<0.001*
|
|
PRA (D)
|
-1.41 ± 1.16
|
0, -4.00
|
-1.08 ± 0.91
|
0, -3.00
|
0.08
|
| AA = accommodative amplitude; NRA = negative relative accommodation; PRA = positive relative accommodation; preop = preoperative; postop = postoperative; |
All values are presented as mean ± standard deviation; P values for comparations before and after the operation of NRA was calculated by paired samples t-test. The Wilcoxon rank-sum test was used to compare differences of AA and PRA before and after the operation.
* statistically significance
Binocular Contrast Sensitivity and Stereoacuity
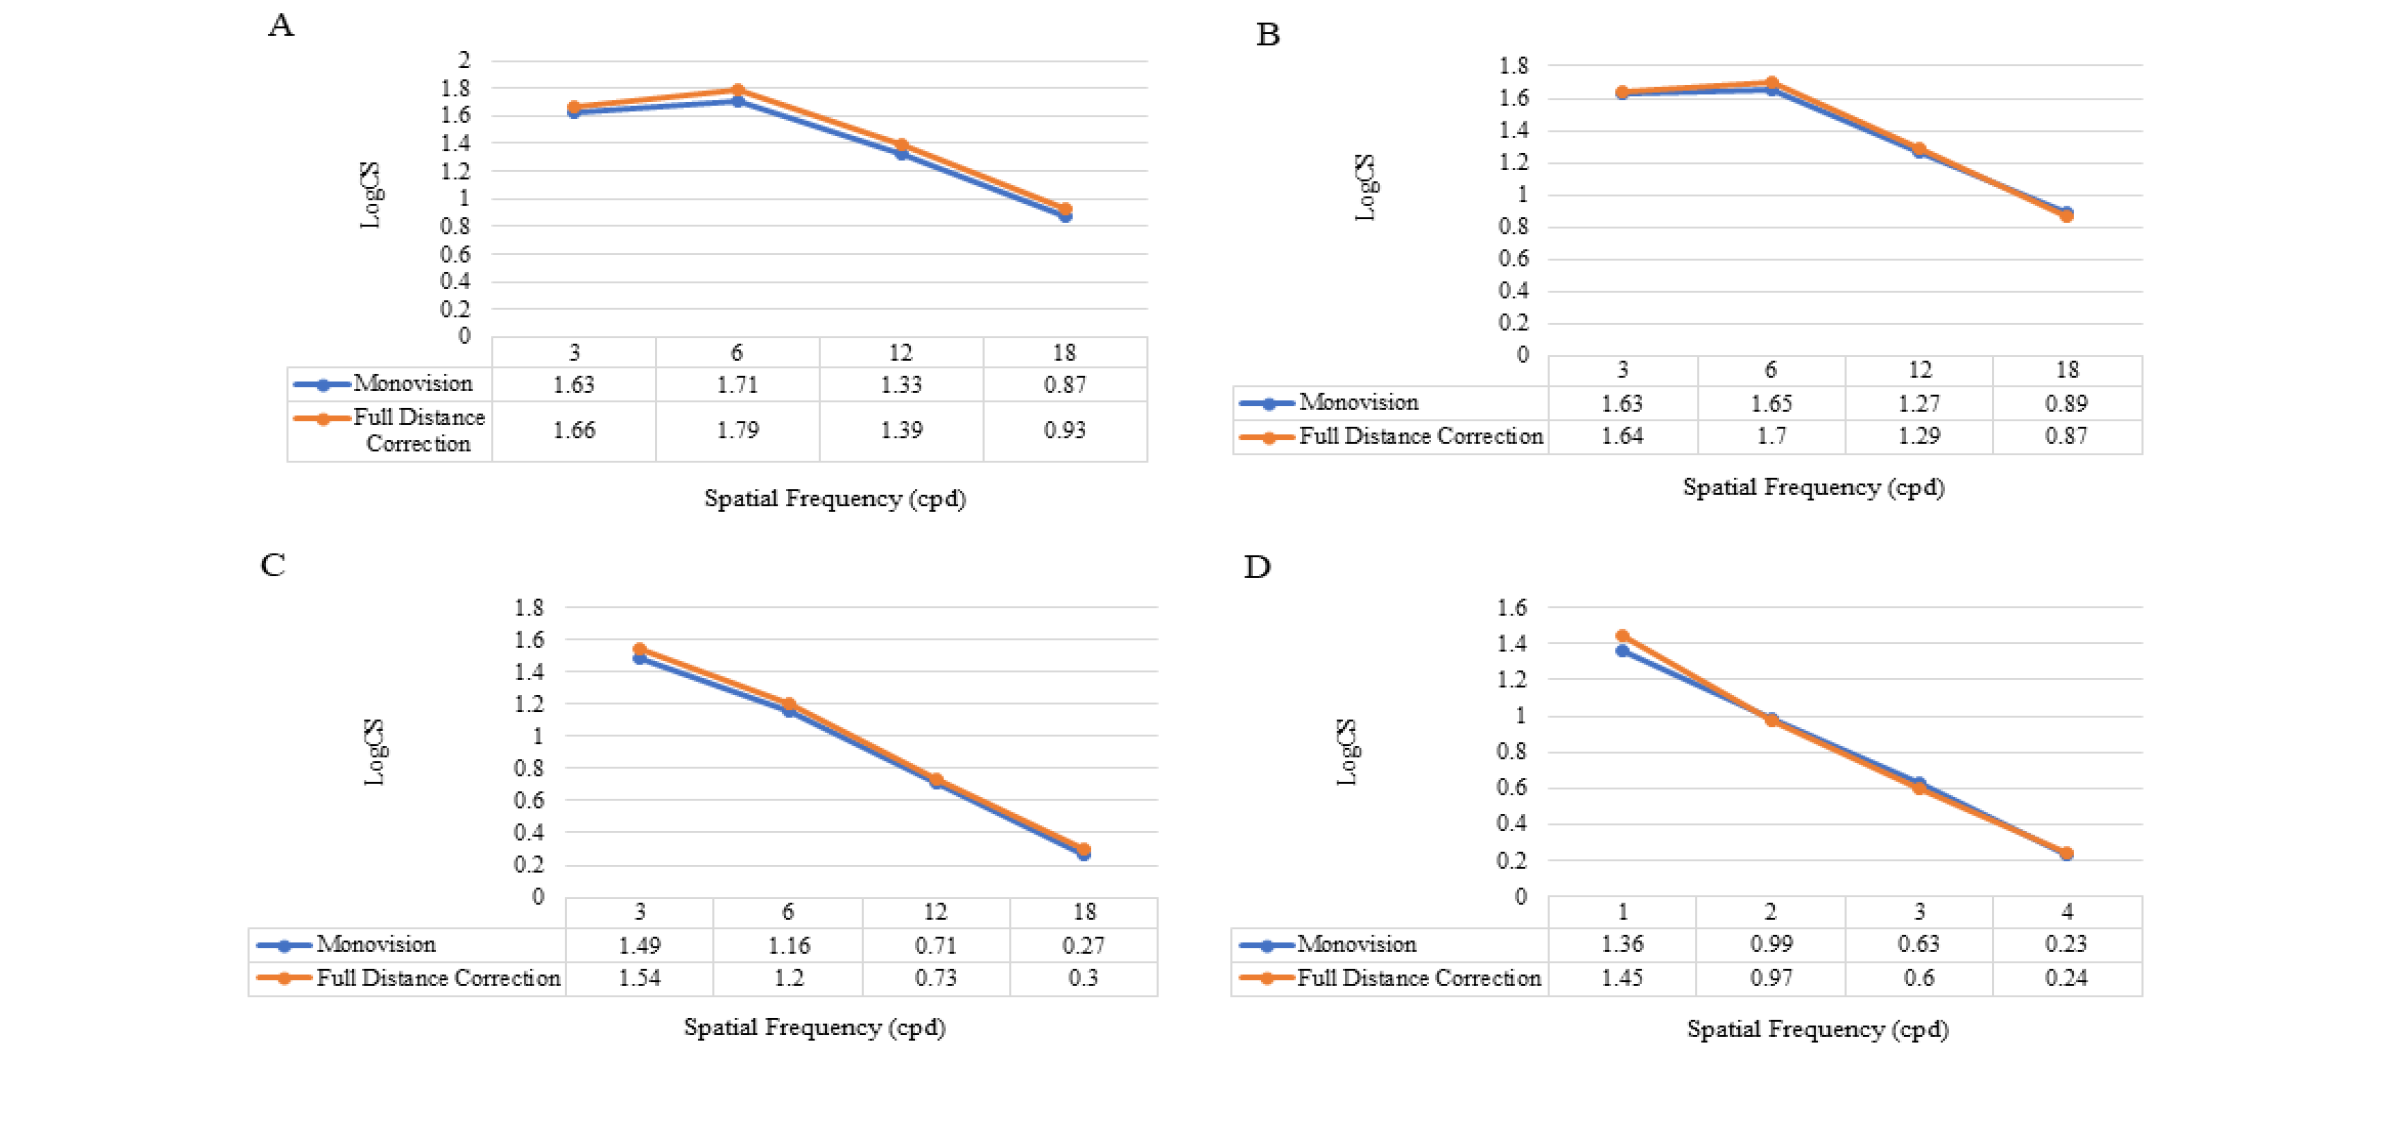
There were 17 patients showed myopia status in the non-dominant eye after surgery and were willing to have contrast sensitivity and stereoacuity test performed twice. Postoperative binocular contrast sensitivity measurements in the monovision and full distance correction groups at 3, 6, 12, and 18 cpd under photopic and mesopic conditions with and without glare stimuli are shown in Supplemental Fig. 1. Compared to the logarithmic scale, contrast sensitivity was generally reduced with monovision compared to binocular full distance correction in most test conditions. This reduction was only of statistically significant at low spatial frequency of 6.0 cpd under photopic and mesopic conditions (P < 0.05 for all comparisons).
The binocular distance and near stereoacuity are shown in Supplemental Table 2. Stereoacuity decreased slightly with monovision compared to full distance correction, but the noted differences were not statistically significant (P > 0.05).
The results of stereoacuity were categorized as follows: stereoacuity better than or equal to 60 s of arc (central stereopsis); stereoacuity in the range of 80 to 200 s of arc (macular stereopsis); stereoacuity in the range of 300 to 800 s of arc (peripheral stereopsis); and either stereoacuity equal or above 800 s of arc (stereo blindness).
The Fisher exact probability test was used for comparisons of categorical variables.
Subjective Visual Quality and Near Visual Ability
For the near visual ability, 6 patients (19.35%) were fully satisfied with their near visual acuity, 23 patients (74.19%) were moderately satisfied, and the remaining 2 patients (6.45%) were not very satisfied; 24 patients (70.97%) reported that they never required to wear reading glasses while reading or doing close work, 6 patients (19.35%) needed reading glasses in few cases, and only 1 patient (3.23%) needed reading glasses in most cases.
Supplemental Table 3 shows patients’ perception of visual disturbance. The three most commonly reported visual symptoms after surgery were blurred vision, glare, and halos with the cumulative number of 20 patients (64.52%), 19 patients (61.29%), and 19 patients (61.29%), respectively, reporting these symptoms “occasionally,” “often,” or “usually”. Besides, subjective problems with depth perception had been found in only 4 patients (12.90%), which was considered closely related to reduction in stereoacuity, and no one considered them severely bothering.