3.1 Morphological characterization of Sn particles obtained under different conditions
Tin (Sn) particles generated at the cathode by electrochemical methods, the morphology and size of Sn microparticles can be controlled by adjusting the experimental conditions, such as composition of electrolyte (fluoride ion content, deionized water content), applied voltage, and reaction time [32–34].
In order to establish the impact of fluoride ion concentration on the micro-nano structure, we prepared samples by changing the NH4F content (0.04 mol/L, 0.08 mol/L, 0.15 mol/L, 0.20 mol/L, respectively) based on the consistency of other factors (deionized water content of 5 vol%, reaction voltage of 15 V and reaction time of 5 h). As shown in Fig. 1, Sn particles present a unique dendritic morphology, and the shape of the dendrites is closely related to the concentration of NH4F. From the SEM of Fig. 1a, it can be seen that at low NH4F content (0.04 mol/L), the obtained dendritic Sn particles are larger in size, the stems are slightly bent, and the whole morphology is rough and irregular. When the concentration of NH4F increased to 0.08 mol/L, the morphology of dendritic products tended to be regular, the stems tended to be straight and the length of branches decreased (Fig. 1b). When the NH4F concentration is further increased to 0.15 mol/L, the branches of dendritic Sn particles become finer and the stem length is decreases to 50 µm (Fig. 1c). When the NH4F content reaches 0.20 mol/L, large-grained dendrites appear, and the dendritic morphology becomes irregular and agglomerated (Fig. 1d). It can be concluded that the content of NH4F has a great influence on the morphology of tin micro-nano powder, and when its concentration is 0.15 mol/L, the perfect product of Sn dendrite can be obtained.
Next, we analyzed the effect of the content of a small amount of deionized water in the electrolyte solution on the morphology of Sn micro-nanostructures. As shown in Fig. 2a and 2b, on the basis of other conditions being uniform (NH4F content of 0.15 mol/L, reaction voltage of 15 V and reaction time of 5 h), at low deionized water content (1.5 and 3 vol%), the dendritic Sn particles are irregular in shape and accompanied by many debris. When the deionized water content increased to 5 vol%, the crystal morphology of the obtained dendritic products tends to be regular and perfect, and the fine branches become numerous and dense (Fig. 2c). When the deionized water content is further increased to 10 vol%, the stem length of dendritic Sn particles increases, but the fine branches tend to be sparse (Fig. 2d).
For the electrochemical reaction process, the applied voltage also has a great influence on the morphology of the deposited product on the electrode [35, 36]. Figure 3 is the SEM of Sn microparticles obtained under different reaction voltages, from Fig. 3a, after 5 h electrochemical reaction, the products obtained by applying a voltage of 5 V are mostly granular, and the dendritic morphology is not perfect. When the applied voltage increased to 10 V, the morphology of dendritic products gradually formed, but the thin branches are not completely bifurcation (Fig. 3b). As the voltage continues to increase to 15 V and 30 V, it can be seen from Fig. 3c and d that the morphology of dendritic Sn particles tends to be regular, and there is no obvious change in the SEM of 15 V and 30 V.
The growth process of Sn microparticles with dendritic structure was studied by controlling the reaction time. In order to explore the crystal growth of Sn particles, the growth process of the crystal product is studied from the nanometer size in a short time (5 min, 30 min, 60 min and 90 min). Under the condition of an applied voltage of 15 V, after the electrochemical reaction for 5 min, the Sn nanoparticles deposited on the cathode show a nano-dispersion state, and the Sn particle size is about 25 nm (Fig. 4a). When the reaction time reaches 30 min, the Sn nanoparticles grow to about 100 nm, but remain independent from each other (Fig .4b). From Fig. 4c, as the reaction time is above 60 min, Sn nanoparticles grow further and some begin to connect and merge with each other. With the time increased to 90 min, for Sn nanoparticles with increasing size, the compatibility phenomenon is more obvious and the dendritic rudiment appears (Fig. 4d). Until the reaction time increases to 5 h, the Sn particles show a perfect dendritic morphology.
3.2 Mechanism of electrochemical method to generate Sn particles
Combining the growth morphology of Sn crystal products under different conditions above, and based on the theoretical basis for the preparation of metal particles by the electrochemical anodic oxidation-cathode precipitation method, we get that the formation mechanism of Sn particles is mainly divided into four stages.
In the first stage, due to the hydrolysis of NH4F, the electrolyte is weakly acidic, during the electrolysis process [37], the Sn sheet as anode is oxidized, and many micro bubbles appear on the cathode Ti sheet. The main reactions of the two electrodes are as follows:
Anode: Sn → Sn2+ + 2e− (1)
Cathode: 2H+ + 2e− → H2 (2)
In the second stage, the fluoride ion (F−) in the electrolyte solution is complexed with the tin ion (Sn2+) generated by the anode to obtain SnF42−, and the specific reaction is:
Sn2+ + 4F− → SnF42− (3)
In the third stage, the SnF42− reach the vicinity of the cathode under the action of magnetic stirring and are reduced to metal Sn particles by obtaining electrons, the reaction is as follows:
SnF42− + 2e− → Sn + 4F− (4)
In the fourth stage, when the metal Sn crystal nucleus starts to precipitate on the cathode, as the reaction proceeds, the Sn particles gradually grow and become larger in size, and with the different reaction conditions, the morphology of the obtained Sn particles is also different.
3.3 Characterization analysis of Sn/SnO2 after Sn particles treated at different high temperatures
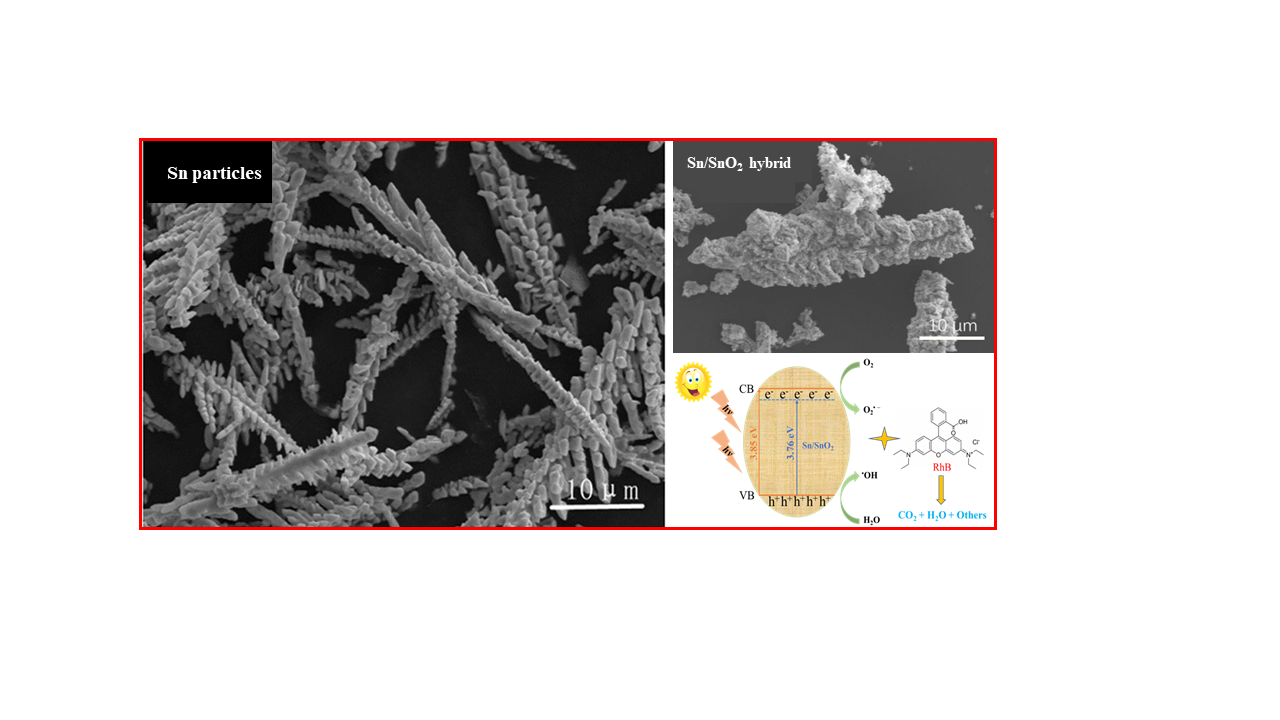
By exploring the influence of different conditions on the crystal morphology, the optimal conditions for the electrochemical method to prepare Sn particles are obtained: in the ethylene glycol electrolyte solution containing NH4F, the content of NH4F is 0.15 mol/L, the deionized water content was 5 vol%, and the reaction is carried out for 5 h under the applied working voltage of 15 V. In order to make the product have higher photocatalytic activity, the Sn particles with dendritic crystal morphology were then subjected to high-temperature calcination treatment at 450°C, 550°C and 600°C, respectively [38, 39], and the SEM of the obtained samples are shown in Fig. 5a-c. Compared with the Sn particles, the morphology of the samples changed after high temperature treatment. It can be seen from Fig. 5a that when the temperature is set at 450°C, the surface of the sample is scattered due to oxidation, but the overall dendritic skeleton morphology remains unchanged. When the heat treatment temperature increased to 550°C, the branches of dendritic Sn particles gathered together and a large number of micropores appeared on the surface with the intensification of the oxidation degree (Fig. 5b). When the temperature reaches 600°C, it can be seen from Fig. 5c that the dendritic morphology of the sample becomes less obvious, and the surface tends to be loose and porous. In summary, it can be concluded that the morphology of the Sn particles obtained by the electrochemical method changes from a regular dendritic structure to a loose and porous structure after different high-temperature treatments, which provides abundant catalytic active sites for the obtained samples as photocatalysts [40, 41].
To analyze the crystal structure and phase composition of the as-prepared samples after high-temperature treatment, XRD was carried out. The XRD patterns of the as-prepared products are shown in Fig. 5d. For the obtained Sn particles, all the diffraction peaks are in well agreement with the literature values of the tetragonal phase of metallic Sn (JCPDS No.04-0673) [42–44]. Nearly no other peaks of impurities are detected, showing that the obtained Sn particles are of high purity. After Sn microparticles are treated at different high temperatures (450 ℃, 550 ℃ and 600 ℃), the peaks of cassiterite SnO2 (JCPDS file No. 41-1445) can be also found in the patters [45–47]. Therefore, the main component of the sample obtained after high temperature treatment is the hybrid compound composed of Sn and n-type semiconductor SnO2 (Sn/SnO2). It is worth noting that with the increase of heat treatment temperature, the diffraction peak of metal Sn in the hybrid gradually weakens, and the characteristic peak of SnO2 gradually increases, indicating that the oxidation degree of Sn particles deepens with the increase of temperature.
3.4 Photocatalytic performance of Sn/SnO2
n-type semiconductor SnO2 has excellent stability and photocatalytic activity [48–50]. In this work, the Sn/SnO2 hybrid with metal Sn-doped semiconductor SnO2 properties obtained by high-temperature treatment of dendritic Sn particles can further improve the photocatalytic performance of traditional catalyst SnO2 [51, 52]. To eliminate the effect of adsorption on photocatalysis, for each experiment, 50 mg of catalyst powder was added to 50 mL of RhB solution and stirred for 1 h in the dark to obtain adsorption/desorption equilibrium [53]. During light irradiation, the catalyst was kept in suspension by a magnetic stirrer, and 2 ml of the reaction solution was aspirated with a pipette every 30 min and centrifuged immediately to separate the catalyst from the solution. Finally, the concentration of RhB in the solution after a fixed time was measured at a wavelength of 554 nm by a UV-visible spectrophotometer [54]. The specific degradation efficiency calculation formula is as follows [55]:
The degradation efficiency = [(C0-Ct)/C0] × 100% (5)
where C0 is the initial concentration of RhB, Ct is the concentration of RhB at time t. From Fig. 6a, after illumination for 5 h, compared with commercial SnO2, the photocatalytic efficiency of the Sn/SnO2 hybrid obtained in this work has been greatly improved, especially for the degradation efficiency of the catalyst obtained by calcination at 550°C as high as 89.8%. It is worth noting that when the calcination temperature continues to increase to 600°C, the photocatalytic efficiency of the hybrids decreases, which may be related to the electron mismatch in the Sn and SnO2 heterojunction.
In order to verify the accuracy of the above photocatalytic efficiency and predict that the degradation of RhB by the catalyst may be related to the rapid interfacial transfer of photogenerated charge carriers and the subsequent effective charge separation, the photocurrent response behavior of the sample electrode in 0.1M Na2SO4 electrolyte under intermittent visible light irradiation was tested using a three-electrode system in an electrochemical workstation [56, 57]. As shown in Fig. 6b, the prepared electrodes of different samples have a very obvious change in the response current under the condition of intermittent switching of the xenon lamp for 15 s. The Sn/SnO2 (550°C) electrode demonstrated a stronger transient photocurrent response (0.38 mA/cm2) under visible light illumination, which was higher than that of commercial SnO2 (0.26 mA/cm2), Sn/SnO2 (450°C) (0.33 mA/cm2), and Sn/SnO2 (600°C) (0.36 mA/cm2). In addition, after three cycles of light cycles, the current density under light conditions is basically constant, which proves that the prepared catalyst has good stability.
In order to more directly reflect the photocatalytic performance of the catalyst on RhB in different time periods, the time-dependent UV-Vis absorption spectrum of RhB with Sn/SnO2 (550°C) electrode is also operated and shown in Fig. 6c. It can be clearly seen from the figure that with the passage of degradation time, the UV-Vis absorption peak intensity of RhB in the solution decreased significantly at 554 nm. The recycling performance of photocatalysts is considered to be a key factor for evaluating the green sustainable catalysts, the cyclic experiments of Sn/SnO2 (550°C) are conducted for seven runs and the result is depicted in Fig. 6d. After the first measurement, the catalyst is centrifuged, washed three times with deionized water and ethanol, and dried for the next cycle experiment. From the experimental results, it can be found that the degradation efficiency of the catalyst Sn/SnO2 (550°C) to RhB can still achieve more than 80.0% after 5 cycles, and the degradation efficiency decreases but still remains above 70.0% after 7 cycles. The degradation of performance may be related to the surface deactivation caused by the adsorption of RhB degradation products to the surface of the catalyst. Therefore, these results indicate that the photocatalyst obtained in this study has good reusability.
3.5 Photocatalytic mechanism of Sn/SnO2
The above results indicate that the Sn doped SnO2 samples have shown much improved photocatalytic activity on the photodegradation of RhB than the pure commercial SnO2. The UV-vis diffuse reflectance spectra of the pure SnO2 and calcined sample Sn/SnO2 are showed in Fig. 7a, it can be clearly seen that Sn/SnO2 have good light absorption than pure SnO2 in the visible light absorption range with a range of 400–750 nm, which indicates that doped Sn enhanced significantly visible light absorption of SnO2 catalyst. The direct band gap (Eg) values of different catalysts are estimated from the (Ahν)2 versus photon energy (hν) plot as showed in the Fig. 7b [58]. As depicted in Fig. 7b, the band gap of Sn/SnO2 have been narrowed from 3.85 eV (pure SnO2) to 3.82 (calcined at 450°C), 3.76 (calcined at 550°C) and 3.80eV (calcined at 600°C), respectively. It is worth mentioning that the band gap of samples obtained at 550°C is the lowest and the photocatalytic effect is the best. The surface is attributed to the unique morphology to provide abundant active sites. The deep theory is that the appropriate amount of Sn-doped SnO2 catalyst obtained at 550°C promotes the transfer of photogenerated charge and extends the lifespan of photogenerated charge.
The probable photocatalytic mechanism of Sn-doped SnO2 hierarchical structures for degradation of RhB and schematic electronic structure for significantly improving photocatalytic performance are illustrated in Fig. 7c. Under visible light excitation, electrons in the valence band (VB) of Sn-doped SnO2 catalyst can be excited to the conduction band (CB) of the catalyst, while forming the same number of holes in VB (Eqs. (6)), leading to the formation of photogenerated electron–hole pairs [59, 60]. Compared to pure SnO2, the Sn-doped SnO2 hierarchical structure shows the stronger light absorption and lower band gap and the, therefore, more charge carriers can be excited in the process and then participate in following photocatalytic reactions [61, 62]. The reactive electrons (e−) from the Sn/SnO2 reduce O2 to·O2• − (Eqs. (7)) [63]. Meanwhile, the reactive holes (h+) oxidize RhB to its radical cation either directly (Eqs. (10)) or through a primarily formed •OH produced by the oxidation of ubiquitous water (Eqs. (8)) [64, 65]. O2• − and •OH are proven to be the main active species, which can eventually convert organic dyes (RhB) into CO2, H2O and others (Eqs. (9) and (11)) [66].
| Sn/SnO2 + visible light →Sn/SnO2 + e−(CB) + h+(CB) | (6) |
| e− + O2 → O2• − | (7) |
| h+ + H2O → •OH + H+ | (8) |
| RhB + O2• − → CO2 + H2O + Other products | (9) |
| RhB + h+ → CO2 + H2O + Other products RhB + •OH → CO2 + H2O + Other products | (10) (11) |