Illumine sequencing
To reveal the mechanism of the response to low-temperature stress in Vitis amurensis Rupr., the whole transcriptome sequencing was performed on phloems of different low-temperature periods and the transcripts were compared. Low-quality data were removed and quality analysis can be found in Supplementary table 2. The total reads of mRNA with lncRNA for the five samples of A, B, C, D and E with different low temperature exercise periods were 127.6, 132.4, 110.7, 108.7, 108.8. And the Total reads of miRNA for the five samples were 5.3, 11.5, 2.7, 9.5, 9.8 million. The Total reads of mRNA with lncRNA were much higher than those of miRNA. The Mapped Reads of mRNA and lncRNA in 5 samples were 56.17% at the lowest and 75.79% at the highest. And the Mapped Reads of miRNA were all above 34%, with the lowest being 34.16% and the highest being 43.24%. Uniq Mapped Reads of each sample mRNA and lncRNA were above 50%, and the highest was sample B, which reached 74.07%. The Multiple Mapped Reads of each sample were low, ranging from 1.34–1.80%. In addition, the Reads Map to '+' of each sample was higher than that to '-', the Reads Map to '+' was higher than 20%, and the Reads Map to '-' was higher than 12%. the GC content ranged from 46.44% to 52.55 and the Q30 was above 95% in all samples. It can be seen that the transcripts are of good quality and can be used for subsequent analysis.
Global gene analysis
Gene expression analysis of each comparison group revealed that more than half of the gene expression was up-regulated in each low-temperature treated sample compared to that in the growth period, with C VS A, D VS A and E VS A up-regulating almost three times more genes than down-regulating genes (Fig. 1A). In addition, with the increase of low-temperature, the number of differential genes in D period was the highest (5,175), with 3,686 up-regulated genes and 1,498 down-regulated genes. It can be seen that most genes were up-regulated in expression after the low-temperature treatment in response to low temperature stress. Different from mRNA, with the deepening of low temperature stress, the up-regulated miRNA of B VS A was 1.67 times that of down-regulated gene, and the up-regulated genes of C VS A, D VS A and E VS A were 0.78 times, 0.69 times and 0.975 times that of down-regulated gene, respectively, indicating a decrease in the number of up-regulated miRNAs. The change trend of mRNA gene expression was opposite (Fig. 1B). The number of differential lncRNAs decreased sharply in C VS A, and the number of up-regulated lncRNAs was lower than that of down-regulated lncRNAs. After the intensification of low temperature stress, the number of differential lncRNA gradually increased, and the number of up-regulated lncRNA was higher than that of down-regulated lncRNA in D VS A and E VS A, respectively (Fig. 1C).
The assembled data were analyzed against major databases by using BLAST software to obtain annotation information for all genes. A total of 20,260 genes were annotated in the given protein database search. The NR database had the most annotated genes (20,258), the GO and Swiss-Prot databases also had more than 10,000 annotated genes (17,243 and 15,186, respectively), while the KEGG database had the least annotated genes (6,062) (Fig. 1D). Similar to mRNA, miRNA and lncRNA had the most annotations in the RN database, with 7,567 and 15,066, respectively. The numbers of their genes annotated in GO database ranked the second, 7,267 and 13,397, respectively, while the numbers of their genes annotated in KEGG database were the least, 2,897 and 5,516, respectively (Fig. 1E, F).
Differential gene enrichment analysis
Different databases were used to compare and comment the enhanced DEGs. Alpha-Linolenic acid metabolism, flavonoid biosynthesis, circadian rhythm plant, starch and sucrose metabolism, and alpha-Linolenic acid metabolism were the primary areas in which DEGs were abundant in the KEGG database (Fig. 2A). Proteins inferred from the identified RNA sequences matched DEGs identified in the KOG database, grouped into 24 functional classes, mostly annotated in the areas of chaperones, protein turnover, signal transduction processes, carbohydrate transport and metabolism, posttranslational modification, and the formation, transport, and catabolism of secondary metabolites (Fig. 2B). The DEGs were classified into 55 functional groups by the GO database, which were divided into 3 subclasses, including: biological processes, cell components, and molecular functions (Fig. 2C). In the COG database, DEGs were annotated and grouped into 23 categories, of which Cell motility was the least annotated (Fig. 2D).
Venn analysis of B_VS_A, C_VS_A, D_VS_A and E_VS_A revealed that 2,378 genes co-occured in the four treatment groups, showing that all 2,378 genes were differentially expressed with increasing levels of stress. Subsequent analyses will be carried out on these 2,378 genes (Fig. 2E).
GO enrichment analysis was performed on 2,378 genes in B_VS_A, C_VS_A, D_VS_A and E_VS_A. It was found that Biological process, cellular component and molecular function contained 19, 14 and 14 functional groups, respectively (Fig. 3A). In addition, the frequency of up-regulated genes in biological processes, cell components and molecular functions reached 17,930, the frequency of down-regulated genes was 5,650, and the frequency of up-regulated genes was three times that of down-regulated genes. Further analysis showed that GO:0016530 and GO:0045735 were both up-regulated genes in molecular function.
Meanwhile, KEGG enrichment of 2,378 common DEGs showed that the DEGs were mainly in Pentose and glucuronate interconversions, alpha-Linolenic acid metabolism, Flavone and flavonol biosynthesis, Starch and sucrose metabolism pathway, Flavonoid biosynthesis and Circadian rhythm-plant (Fig. 3B). After that, the target genes of differentially expressed miRNAs and lncRNAs were analyzed by KEGG classification (Fig. 4A, B). And it was found that their target genes were classified into five categories: Metabolism and Organismal Systems, Genetic Information Processing, Environmental Information Processing, and Cellular Processes. The distinction is that in the context of environmental information processing, ABC transporters, phosphatidylinositol signaling system, and plant hormone signal transduction were the target genes of miRNAs. Conversely, the annotation of lncRNA target genes was limited to the Plant hormone signal transduction pathway. In Genetic Information Processing, miRNAs were not annotated to the SNARE interactions in vesicular transport pathway, and lncRNAs are not annotated to the Aminoacyl-tRNA biosynthesis pathway. In Metabolism, the target gene annotations of miRNAs and lncRNAs varied greatly, but both of them were annotated in the Carbon metabolism and Starch and sucrose metabolism pathways. Therefore, subsequent analyses focus on the starch and sucrose metabolic pathways.
mRNA, miRNA and lncRNA length analysis
As shown in Fig. 5A, the length of mRNAs was above 200nt, with the number of mRNAs of 200 nt in length being 1,358, which is less than that of mRNAs of 3,000 nt in length; the number of mRNAs of 400 nt in length was the highest, with 103,766, and among those with the length of over 400 nt, the longer, the fewer; the total number of mRNAs that are over 3,000 nt was 26,315, which is lower than the number of lengths of mRNAs of 600 nt in length. The length of lncRNA was over 400 nt, and the number of lncRNA fragments that are 400 nt long was the highest, which was 4,669. As the length of lncRNA fragments increased, the number of lncRNAs longer than 400 nt decreased; there are 129 lncRNAs totaling 3,200 nt in length (Fig. 5B).
The lengths of the miRNAs varied from 18 to 24 nt, with 104 with the longest length of 21 nt being the most common. And there were 75 miRNAs with a 24 nt length, making it the second most common kind. There are the fewest amount of miRNAs, with 4 with lengths of 18 and 19 nt (Fig. 5C).
Correlation analysis of mRNA with miRNA and lncRNA based on FPKM value
Correlation analysis was performed on the FPKM values with 41 mRNAs, 5 miRNAs and 17 lncRNAs. As shown in Fig. 6, unconservative_4_28837, unconservative_4_28838, unconservative_13_34980, and unconservative_13_34981 were positively correlated with 29 mRNAs with similar correlation patterns. While vvi_miR3624_5p was negatively correlated with 33 mRNAs. In addition, MSTRG.108081.3, MS TRG.152515.1, MSTRG.10557.2, MSTRG.19181.1, MSTRG.19130.1, MSTRG.19148.5, and MSTRG.20793.5 were positively correlated with most of the genes in the sucrose and starch metabolic pathways.
Analysis of mRNA interactions with miRNA and lncRNA
To explore the expression of mRNAs in the starch and sucrose metabolic pathways and the interactions network relationship between mRNA and miRNAs and lncRNAs, we drew a heatmap of miRNA expression based on the FPKM values and visualized the interaction network among mRNA, miRNA and lncRNA.
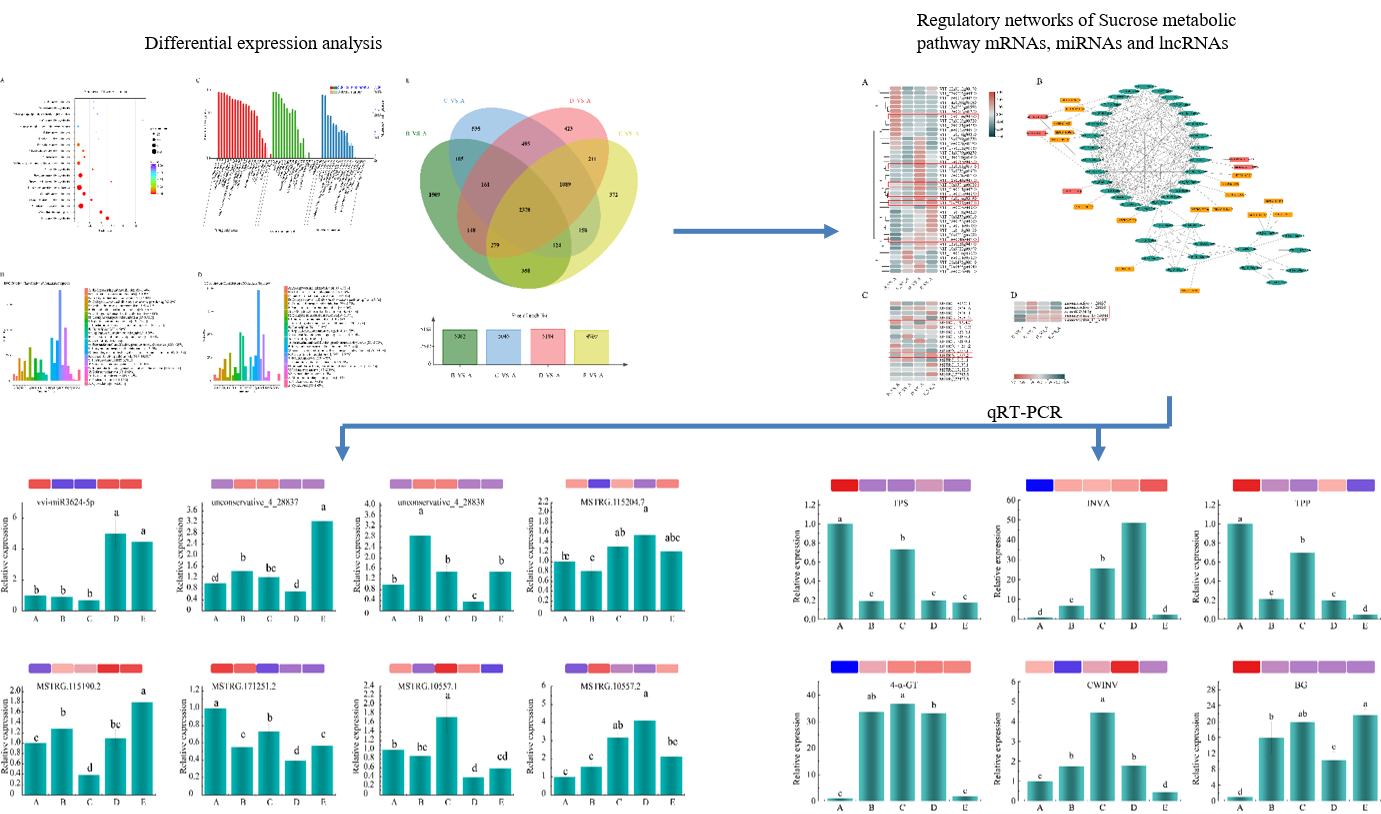
In Fig. 7A, heatmaps were drawn for the FPKM values of 41 genes enriched in the starch and sucrose metabolism pathways. TPP (Trehalose 6-phosphate phosphatase), CWINV (Cell wall invertase), and TPS (alpha,alpha-trehalose-phosphate synthase ) were up-regulated in D and down-regulated in B, C, and E, INVA (Invertase) was up-regulated in E and 4-α-GT (4-alpha-glucanotransferase) is upregulated in C, D, and E, compared with that in A.
To clarify the interactions of mRNAs, miRNAs and lncRNAs, the interaction network was visualized by Cytoscape (Fig. 7B, Supplementary table 3). VIT_17s0053g00700 was found to be regulated by two miRNAs, unconservative_13_34981 and unconservative_13_34980. The expression of TPP and 4-α-GT were regulated by unconservative_4_28837 and unconservative_4_28838, and the expression of 4-α-GT was also regulated by vvi-miR3624-5p. In addition, the expression of VIT_02s0154g00090 was regulated by three lncRNA, which were MSTRG.108081.6, MSTRG.108081.3 and MSTRG.108081.1, And the expression of VIT_11s0016g03020 was regulated by MSTRG.19181.1, MSTRG.19130.1 and MSTRG.19148.5. The expression of VIT_07s0005g01030 was regulated by MSTRG.152678.1 and MSTRG.152676.1, the expression of BG (beta-glucosidase) was regulated by MSTRG.10557.2 and MSTRG.10557.1, and the expression of VIT 03s0063g01510 was regulated by MSRG.11516.1000101016. After that, based on the interaction genes that regulate low-temperature stress and have different correlation types with miRNA and lncRNA, 5 mRNA interacting with 3 miRNA, 2 miRNA, 2 lncRNA and 1 lncRNA and 1 mRNA without interaction with miRNA and lncRNA were selected for in-depth analysis (Fig. 7A). Meanwhile, miRNAs (unconservative_4_28838, vvi-miR3624-5p, unconservative_13_34980) and lncRNAs (MSTRG.115204.7, MSTRG.115190.2, MSTRG.171251.2, MSTRG.10557.1, MSTRG.10557.2) that interacted with candidate mRNAs and had inconsistent expression patterns were selected for further analysis (Fig. 7C and D).
Transcriptome data qRT-PCR validation
In order to verify the results of RNA-seq, we performed qRT-PCR verification, and selected 6 differentially expressed mRNA in the starch and sucrose metabolism pathways. Additionally, five lncRNAs and three miRNAs that interact with the six genes mentioned above but have different expression patterns were chosen for qRT-PCR. For every gene, three biological replicates were carried out, and the relationship between the RNA-seq and qRT-PCR data was examined. The results are shown in Figs. 8 and 9.
Both BG and vvi-miR3624-5p showed differences in transcriptome sequence data at stage A, unconservative_4_28837 showed differences in transcriptome sequencing data at stage E, and MSTRG.10557.2 showed differences in transcriptome sequencing data at stage B. The remaining genes showed consistent expression trends in RNA-seq and RT-qPCR at all stages, indicating there was consistency between transcript abundance determined by RNA-Seq and RT-qPCR data.