3.1 Macrostructural analysis
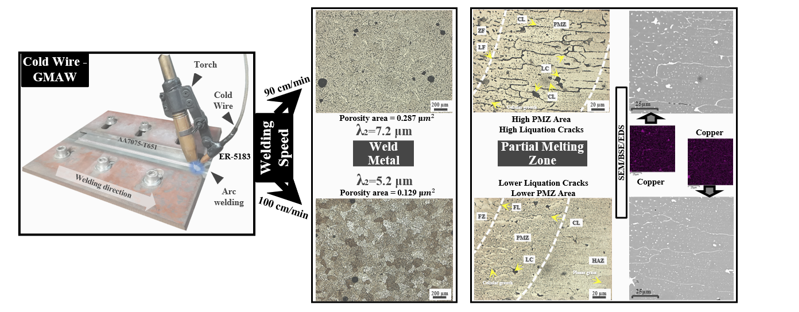
Porosity in aluminum welds results from a reaction between moisture or hydrocarbons within the electric arc, leading to the generation of hydrogen that dissolves into the weld pool. As solidification takes place, the trapped gas manifests as porosity [14]. Figure 3 bead profiles and macrographs of the produced welds are displayed, highlighting the Fusion Zone (FZ), Partially Melted Zone (PMZ), Heat-Affected Zone (HAZ), and Base Metal (BM). The coarser appearance evident in both welds likely originates from spatter during welding, particularly attributable to the peak current. Furthermore, unlike in the P-GMAW process (S1), none of the weld beads exhibited cracks or surface porosity. Macrographs and micrographs (S4) unveil some porosity within the weld metal, while also indicating the successful achievement of full penetration for both joints in a single pass, despite the elevated welding speed. This outcome could be attributed to the heightened peak current levels, which, in conjunction with the superior thermal conductivity of helium gas, enhance the fusion pool's digging power. Consequently, this contributes to the formation of narrower and deeper weld beads [15–17]. The porosity fraction for the CW-20% specimen manufactured at 90 cm/min was 0.287 mm², while it was 0.129 mm² for the specimen produced at 100 cm/min. These values correspond to 0.50% and 0.26% of the total cross-sectional areas, respectively (S2 and S3).
Table 3 shows the average geometric features for the two experimental conditions. The increase in travel speed does not seem to affect the depth of penetration for both experimental conditions. Bead width decreases with the increase in travel speed, since this increase elongates the weld pool increasing its length. Therefore, the wetting of angle of the weld pool increases with travel speed, it increased from 33° to 44°, with the increase in speed. Table 3 shows the bead height variation for the two welding conditions, it would be expected that the increase in travel speed would lead to an increase in height. However, the decrease in height observed is probably due an increase in spatter during welding. Dilution is presented in Table 4, the dilution does not vary much with the increase in travel speed, although the variation is statistically significant. The specimen manufactured with travel speed of 100 m/min has a slightly higher dilution. This seems to indicate that the energy transfer from the weld pool to the welding substrate differ. However, this claim can only be confirmed by calorimetry.
Table 3
Average geometric features of the weld joints: penetration, bead width (W), bead Reinforcement (R), Average Width Partial Melting Zone (AWPMZ), Average Width Heat Affected Zone (AWHAZ), θ, and dilution. Error are 95% confidence levels.
| Specimen | W (mm) | R (mm) | PT (mm) | AWPMZ (mm) | AWHAZ (mm) | θ (˚) | R/W | W/(P + R) |
| CWP90 | 11.34 ± 0.4 | 2.99 ± 0.1 | 6.15 ± 0.06 | 0.35 ± 0.01 | 2.68 ± 0.01 | 33.00 ± 0.6 | 0.26 ± 0.01 | 1.41 ± 0.06 |
| CWP100 | 9.74 ± 0.2 | 2.49 ± 0.1 | 6.05 ± 0.03 | 0.34 ± 0.01 | 2.53 ± 0.01 | 44.00 ± 0.3 | 0.25 ± 0.01 | 1.30 ± 0.01 |
Table 4
Average geometric features of the weld joints: Roof Area (ARo), Reinforcement Area (AR), Penetration Area (AP), Fusion Zone Area (AFZ), Partial Melting Zone Area (APMZ), Heat Affected Zone Area (AHAZ). Error are 95% confidence levels.
| Specimen | ARo (mm2) | AR (mm2) | AP (mm2) | AFZ (mm2) | APMZ (mm2) | AHAZ (mm2) | Dilution (%) |
| CWP90 | 3.4 ± 0.06 | 20.0 ± 0.5 | 34.0 ± 0.9 | 57.4 ± 0.5 | 3.6 ± 0.1 | 32.0 ± 0.0 | 59.1 ± 0.9 |
| CWP100 | 3.2 ± 0.09 | 15.7 ± 0.04 | 30.4 ± 0.8 | 49.2 ± 0.3 | 3.5 ± 0.1 | 27.1 ± 0.3 | 61.8 ± 0.7 |
3.2 Optical microscopy
Figure 4 shows representative micrographs of each experimental condition. The width of the heat affected zone is on average 2.68 for the specimen manufactured at 90 cm/min and 2.53 for the specimen manufactured at 100 cm/min. The grain morphology of both specimens shows equiaxed dendritic grains, whose average secondary dendrite arm spacing is on average 7.2 µm for the specimen manufactured at 90 cm/min and 5.2 µm for the specimen manufactured at 100 cm/min (S5). This suggests a difference on cooling rate between the specimens, with the specimen performed at 100 cm/min with a higher cooling rate [18], improving the solubility of the metastable solutes formed during the solidification.
Figure 5 shows the secondary dendrite arm spacing for three different regions in the weld metal for both experimental conditions. There is no statistically significant difference of secondary dendrite arm spacing values for the three regions within the weld metal for the same specimen. However, between the specimens, regions P2 and P3 have statistically significant differences of secondary dendrite arm spacing corroborating that the specimen manufactured using travel speed of 100 cm/min has lower secondary dendrite arm spacing. For the region P1, in both experimental conditions, the error bars overlap indicating that the difference is not statistically significant.
Figure 6 shows the fusion line (FL) and the partially melted zone (PMZ). The grains in the PMZ are columnar. Figure 6(b) and Fig. 6(e). In Fig. 6(c) and Fig. 6(e) there are liquation cracks (LC) across the grain boundaries for both experimental conditions. This is consistent with the occurrence of liquation cracks in partially melted zone. This phenomenon occurs due to the heating above the eutectic temperature of the alloy which metastable solute-rich that cannot sustain the stress during solidification. Moreover, the liquation cracking is related to the depletion of copper that forms copper rich (CuMgAl2) particles that at the eutectic temperature generates cracks.
Figure 7 shows the morphology of the heat affected zone which presents elongated planar grains. The base material displays a similar microstructure, but with minor grains (S6). The HAZ presented constitutional liquation, this phenomenon might be linked to the thermal cycles within the HAZ melting the particles along the grain boundaries, if the HAZ peak temperature is between the eutectic and the solidus temperature of the base metal [19]. The melting of these particles produces a solute-rich liquid which infiltrates the grain boundaries drastically decreasing their strength, therefore causing cracks [19].
3.3 Electronic microscopy
The Fig. 8 presents SEM-BSE images illustrating the cross-sectional view of the welded joints, enabling the identification of distinct zones: the fusion zone, partially melted zone, heat-affected zone, and base material. Additionally, the analysis highlights the occurrence of coarse out-of-equilibrium secondary phase precipitation, particularly in the heat-affected regions (PMZ and HAZ). These regions exhibit a tendency for the precipitation of these phases both inside the grains and along their boundaries, often near the junctions. This specific precipitation behavior contributes to the manifestation of Solidification Cracking (SC) within the fusion zone and Liquation Cracking (LC) within the partially melted zone (PMZ) [3, 4, 20, 21].
EDS analysis shows that these particles are MgZn2 and Al2CuMg. The characterization of the weld metal using EDS for both experimental conditions, Fig. 9, shows the amount of Cu in it is approximately 21% of the quantity observed in the base metal. The average quantity of Zn, in both specimens, are approximately 47% of the quantity found in the base metal. The alloy elements are depleted along the grain boundaries in eutectic concentration. ST1 shows the chemical composition assessed in the points shown in Fig. 9 for both the experimental conditions. The EDS analysis shows that there is not significant different in composition, considering the points analyzed. This suggests that the particles analyzed are Cu-rich particles.
Figure 9 shows the partially melted zones for the two experimental conditions. The particles observed are along the grain boundaries and intragranular. The EDS composition of these particles suggest that they Fe-rich particles (points 1 and 4, CW-20% at 100 cm/min, in ST2) which are, possibly, CuFeAl7. On the other hand, Cu-rich particles (point 4, CW-20% at 90 cm/min, in ST2) and Mg-rich particles, for examples point 3 in ST2, for the specimen manufactured using 90 cm/min. The Cu-rich particles appear to be Al7MgCu which react the aluminum matrix causing liquation cracking [4]. The SEM analysis of the heat affected zone shows a reduced amount of Cu compared to the nominal composition of the base metal. The EDS suggests the presence of iron-rich particles that appear to be Cu2FeAl7. These particles come from residual iron found in the base metal and react with aluminum matrix causing liquation cracking [4] which is consistent with the cracks observed with in HAZ in Fig. 7.
3.4 Mechanical properties
Figure 10 shows the Vickers hardness in three different lines in the weld specimens that span across the base metal, heat affected zone, and weld metal. The average was 111.4 HV for the specimen manufactured employing 90 cm/min, and 113.1 HV, for the specimen manufactured employing 100 cm/min. However, the error bars show that this difference is not statistically significant. This softening of the weld metal occurs based on two reasons: a) the increase in grain size of the weld metal, which decreases its overall strength, and b) the fact that the base metal was welded using ER 5183 (cf. Table 1) which is a Al-Mg that does not possess the same chemistry of the weld metal, therefore during welding a dilution of the weld metal occurs impairing its mechanical strength. This is consistent with the results obtained by Soltani et al. [3] which welded using dual-pulsed gas metal arc welding (DP-GMAW),
Towards the heat affected zone the hardness increases reaching on average 148.1 HV, for the specimen manufactured using travel speed of 90 cm/min, and 154.6 HV for the specimen manufactured using travel speed of 100 cm/min. This is attributable both to the refining of grains caused by the welding cycle in the heat affected zone [3]. Moreover, despite the increase in travel speed, the hardness measured at the specimen manufactured with the travel speed of 90 cm/min is not statistically different from the hardness measured in the specimen manufactured with travel speed of 100 cm/min.
Figure 10 also shows the ultimate tensile strength (UTS) of the welded specimens. Both specimens failed prematurely and did not reach yielding and ultimate tensile stress. The base metal presented average yielding stress of 495 MPa, while both the specimens manufactured at the travel speeds of 90 cm/min and 100 cm/min presented, on average, 237 MPa. This result suggests, that in terms of mechanical performance, the travel speed did not affect the mechanical response to tension.
Moreover, the base metal presented approximately 550 MPa as ultimate tensile strength, while both experimental conditions presented approximately 270 MPa. These results show that the joint efficiency, for both experimental conditions, is approximately 50%. Furthermore, the base metal deformed at fracture approximately 7% while the welds only deformed around 1%. These results are consistent with the hardness results, due to the dilution of the base metal by the wire electrode which is not metallurgically compatible with the base metal.
Figure 11 shows photographs of the tensile samples and a detail where the fracture occurred. All the fractures, for the weld joints, occurred in the weld metal as discussed above. The results that more alloy elements should be added during welding to the weld pool, to avoid the dilution of the base metal and consequent impairment of the mechanical strength.
3.5 Fractography
Figure 12(a) shows the macrograph of the fracture detail in the base metal. It is evident that the fracture is ductile due to the deformation observed in the tensile sample. Figures 12 (X1) to 12 (X4) show that the fracture occurred through voids that nucleated at the particles dispersed across the base metal. The decohesion of the particles from the aluminum matrix causes these voids to grow, and subsequently, the growth of these voids is determined by the plastic deformation during the tensile test [22]. Although the aspect of the fracture might seem brittle, the evidence provided by the tensile strength test indicates that the fracture behavior is ductile.
Figure 12b shows the fracture surface of the tensile for the specimen manufactured using 90 cm/min as travel speed. The fracture mode appears to be ductile with void growth (dimples) from porosity (b1) and intergranular liquation cracking (b2 and b3) which is consistent with the number of particles found along the grain boundaries, cf. Figure 9(a).
Figure 12c displays the fractures morphology of the specimen manufactured using the travel speed of 100 cm/min. This sample also presented ductile fracture mode with void coalescence forming dimples (c3) that cause the failure. Again, intergranular cracks (c2), which reveal the dendritic pattern of the grains (c3), appear to be the cause of the fracture. Porosity also seems to contribute to the failure mechanism, as seen in Fig. 12 (c1), since the coalescence of porosity can be one of the former modes of dimple formation. Moreover, it is important to emphasize that since the wire electrode is not compatible with the base metal and cannot provide the necessary alloying elements to maintain the strength of the weld metal comparable to the base metal, this fact might have influenced the observed fracture behaviour. Although all the specimens appear to have ductile tensile belabour, they fail due to lack of strength.