3.1. MIC and MBC of tea saponin against A. terricola
The antibacterial effect of tea saponin against A. terricola was proportional to its concentration (Fig. 1a and 1c). When the concentration of tea saponin was 2 mg/mL, 8 mg/mL and 12 mg/mL, the colony diameter decreased from 2.91 cm to 1.54 cm, 1.24 cm and 0.50 cm, and the inhibition rate reached 47.08%, 19.48% and 82.82%, respectively. Interestingly, the colony diameter of A. terricola only decreased from 1.54 cm to 1.24 cm in range from 2 mg/mL to 8 mg/mL of tea saponin, and which showed that the protection mechanisms in A. terricola has been induced to response to tea saponin concentration (2 mg/mL ~ 8 mg/mL).
There has no obvious antibacterial zone for tea saponin concentration variation from zero to 5 mg/mL (Fig. 1b). When the concentration of tea saponin was greater than or equal to 10 mg/mL, the diameter of antibacterial zone was positively correlated with the concentration of tea saponin (p < 0.05) (Fig. 1d). After culture 7 days, the colony of A. terricola grown on PDA, adding with 15 mg/mL of tea saponin, has no appear (Fig. 1e). The results showed that the MIC / MBC of tea saponin against A. terricola was 10 / 15 mg/mL in this work.
All above results indicated tea saponin had certain antibacterial effect on A. terricola, and the MIC and MBC of tea saponin against A. terricola was 10 mg/mL and 15 mg/mL, respectively.
3.2. Mycelial and spore morphology changes in A. terricola tolorance to tea saponin
The mycelium of A. terricola, grown on PDA without tea saponin addition, was long, smooth and robust, uniform in thickness, and the spores were numerous and arranged tightly and regularly observed by optical microscope (Fig. 2a). However, the mycelium of A. terricola, grown on PDA with 10 mg/mL of tea saponin addition, was deformed and twisted, wrinkled obviously, the thickness was not uniform, the spores were few and scattered (Fig. 2a). The results from SEM observation showed the mycelium of A. terricola has serious distortion, obvious shrinkage, rough surface and abnormal morphology, and which was consistent with those observed by optical microscope (Fig. 2b). The results of TEM showed that the cell wall and membrane of mycelium in A. terricola, grown on PDA without tea saponin addition, was complete and clear, the cytoplasm and organelles was uniform and clear, respectively (Fig. 2c). Nevertheless, the cell wall of mycelium in A. terricola, grown on PDA with 10 mg/mL of tea saponin addition, was loose, blurring for cytomembrane of mycelium, leakage of vacuole contents, and the internal organelle structure was significantly damaged. These results showed tea saponin used in present work had adverse effects on mycelium morphology of A. terricola.
The spores of A. terricola, grown on PDA without tea saponin addition, were numerous and arranged tightly and regularly observed by optical microscope (Fig. 3a), and the cell wall and membrane fitted tightly, the boundary was clear, and the vacuole was complete from SEM observation (Fig. 3b and 3c). However, 10 mg/mL of tea saponin had a significant effect on the external morphology of spores from SEM observation (Fig. 3a). The results of TEM also further confirmed that tea saponin caused spore morphology changes in A. terricola, which cell wall has irregular edges and loose structure, blurring for cytomembrane of mycelium, leakage of vacuole contents, and the internal organelle structure was significantly damaged (Fig. 3b and 3c). These results showed tea saponin used in present work had adverse effects on spore morphology of A. terricola.
All above results indicated tea saponin changed the normal morphology of mycelia and spores, and then affected the growth and metabolism of A. terricola.
3.3. Integrity changes of cell wall and cytomembrane in A. terricola tolorance to tea saponin
CFW fluorescence value in A. terricola, grown on PDA with different tea saponin addition (0ཞ10.0 mg/mL), decreased slightly from 875.85 (0 mg/mL of tea saponin) to 822.75 (5 mg/mL of tea saponin) (Fig. 4a). CFW fluorescence values for 10 mg/mL of tea saponin addition decreased by only 9.44% (p ≤ 0.05) compared to the control (Fig. 4a). This result showed there has no obvious influence of tea saponin on the cell wall integrity of A. terricola in present work.
The PI fluorescence value in A. terricola cultured without tea saponin addition was 58.41 (Fig. 4b). The PI fluorescence value was 100.25, 105.19, 107.81 and 111.83 for 1.25 mg/mL, 2.5 mg/mL, 5 mg/mL and 10 mg/mL of tea saponin addition (Fig. 4b), respectively. The PI fluorescence value was increased by 71.65%, 80.11%, 84.57% and 91.47% (Fig. 4b), respectively. This result showed tea saponin had an adverse effect on the integrity of cell membrane, and 1.25 mg/mL ~ 10.0 mg/mL of tea saponin was the suitable concentration range that A. terricola can tolerate.
The NPN fluorescence value did not show a significant change trend, which indicated that a good integrity was appear in cell membrane of A. terricola cultured without tea saponin addition (Fig. 4c). Compared without tea saponin addition, the NPN fluorescence value (1 min) for A. terricola cultured with tea saponin addition of 1.25 mg/mL, 2.5 mg/mL, 5.0 mg/mL and 10.0 mg/mL was decreased by 38.42%, 48.64%, 55.70% and 55.33% (Fig. 4c), respectively. It was very interesting that the NPN fluorescence value showed a decreasing trend for 10.0 mg/mL of tea saponin additions, the opposite was true for the 2.5 mg/mL and 5.0 mg/mL of tea saponin additions (Fig. 4c). For example, the NPN fluorescence value at 10 min was increased by 79.47% and 208.47% than that at 1 min (Fig. 4c). Whereas the difference in the NPN fluorescence values of 1.25 mg/mL of tea saponin additions was insignificant, likely, the NPN fluorescence value at 15 min was 158.28 and it was 91.57 times higher than that at 1 min (Fig. 4c). The relative electrical conductivity of A. terricola, which cultured with tea saponin addition of 1.25 mg/mL, 2.5 mg/mL, 5.0 mg/mL and 10.0 mg/mL, was 16.19%, 26.51%, 27.05% and 32.32%, and it was 1.81, 2.97, 3.03, 3.62 times than that of without tea saponin addition (Fig. 4d), respectively. These results further showed the permeability of cell membrane increased significantly with the increase of tea saponin concentration. It was also interesting that the relative conductivities difference between 2.5 mg/mL and 5.0 mg/mL of tea saponin addition was not significant (Fig. 4d). The results showed the tea saponin addition from 2.5 mg/mL to 5.0 mg/mL induced the generation of protective mechanisms in A. terricola to reduce the cell membrane permeability and thus maintain membrane homeostasis.
3.4 Changes in antioxidant enzyme activity and reactive oxygen content of A. terricola tolorance to tea saponin
The ROS content in A. terricola cultured with 1.25 mg/mL, 2.5 mg/mL, 5 mg/mL and 10 mg/mL of tea saponin addition was 1.19 times, 1.25 times, 1.38 times and 1.52 times than that of without tea saponin addition (Fig. 5a), respectively. This result showed tea saponin enhanced the accumulation of ROS in A. terricola, meanwhile, A. terricola may produce related substances to reduce ROS accumulation or lower the rate of their generation.
As the concentration of tea saponin addition increased, the activities of all enzymes showed a decreasing trend except for POD. Notably, the difference in activity of POD (Fig. 5b), GSH-PX (Fig. 5c) and CAT (Fig. 5e) between 0 mg/mL and 1.25 mg/mL of tea saponin addition was not obvious, the opposite was true for SOD (Fig. 5d). The results indicated that the increase in ROS content may be caused by the decrease in SOD activity in A. terricola under 1.25 mg/mL of tea saponin addition. In terms of A. terricola cultured with 10 mg/mL of tea saponin addition, the activity of CAT (Fig. 5e) and GSH-PX (Fig. 5c) was decreased by 50.00% and 58.85%, respectively, while the activity of POD increased (Fig. 5b). The activities of T-SOD, CuZn-SOD and Mn-SOD was decreased by 64.00%, 83.70% and 58.33% (Fig. 5d), respectively.
All above results indicated tea saponin promoted the accumulation of ROS in A. terricola, and the detrimental effects of ROS on A. terricola will be eliminated by increasing POD activity.
3.5. Changes in mitochondrial complex enzyme activity of A. terricola tolorance to tea saponin
Compared without tea saponin addition, 10 mg/mL of tea saponin resulted in a decrease of 62.1% in ATP content in A. terricola, however, the difference in ATP production by A. terricola cultured with tea saponin addition between 1.25 mg/mL and 2.5 mg/mL had not significant (Fig. 6a). Meantime, 10 mg/mL of tea saponin addition caused the decrease in activity of mitochondrial complex I, II, III and IV with 67.80%, 42.22%, 83.55% and 24.44% (Fig. 6b), respectively. The activity of Ca2+/Mg2+-ATPase and Na+/K+-ATPase was decreased by 86.87% and increased by 251.23% (Fig. 6c), respectively. Interestingly, the difference in activity of mitochondrial complex (I, II, III and IV) (Fig. 6b) and Ca2+/Mg2+-ATPase between 0 mg/mL and 1.25 mg/mL of tea saponin addition was not obvious. These results showed tea saponin inhibited the activity of mitochondrial mitochondrial complex (I, II, III and IV) and Ca2+/Mg2+-ATPase, and increased the Na+/K+-ATPase activity, and then ultimately lead to a decrease in ATP content.
3.6 Changes in production of cordycepic acid, ergosterol and chitin in A. terricola liquid cultured against tea saponin
In present work, compared without tea saponin addition, the cordycepic acid content in A. terricola, which was liquid cultured with different tea saponin addition (1.25 mg/mL, 2.5 mg/mL, 5.0 mg/mL and 10.0 mg/mL), has been increased by 15.15%, 23.69%, 31.62% and − 60.62% (Fig. 7a), respectively. These results showed tea saponin addition (≤ 5.0 mg/mL) could significantly promoted cordycepic acid production by A. terricola.
In case of ergosterol production by A. terricola against tea saponin, the highest ergosterol content for 2.5 mg/mL tea saponin addition was 3.32 mg/g and 52.29% higher than that of without tea saponin addition (Fig. 7b). However, the ergosterol content in A. terricola liquid cultured with 10.0 mg/mL tea saponin addition has been decreased by 14.75% (Fig. 7b). These results showed tea saponin addition (≤ 5.0 mg/mL) could enhance the ergosterol production by A. terricola.
Compared without tea saponin addition, the chitin content in A. terricola, which was liquid cultured with different tea saponin addition (1.25 mg/mL, 2.5 mg/mL, 5.0 mg/mL and 10.0 mg/mL), has been increased by 29.05%, 42.21%, 42.21% and 2.57% (Fig. 7c), respectively. The highest content (109.65 mg/g) of chitin was found at 1.25 mg/mL of tea saponin addition, which was increased by 42.21% compared without tea saponin addition. Interestingly, the difference in chitin content was very unobvious between 10.0 mg/mL and zero tea saponin addition, which was 79.08 mg/g and 77.11 mg/g, respectively. These results showed tea saponin could improve the chitin production by A. terricola in this work.
All above results showed that tea saponin addition (≤ 5 mg/mL) could increase the production of cordycepic acid, ergosterol and chitin in A. terricola.
3.7 Comparative analysis of changes in cordycepic acid and ergosterol content in ATCs solid-state fermentation using COM, RB and WB
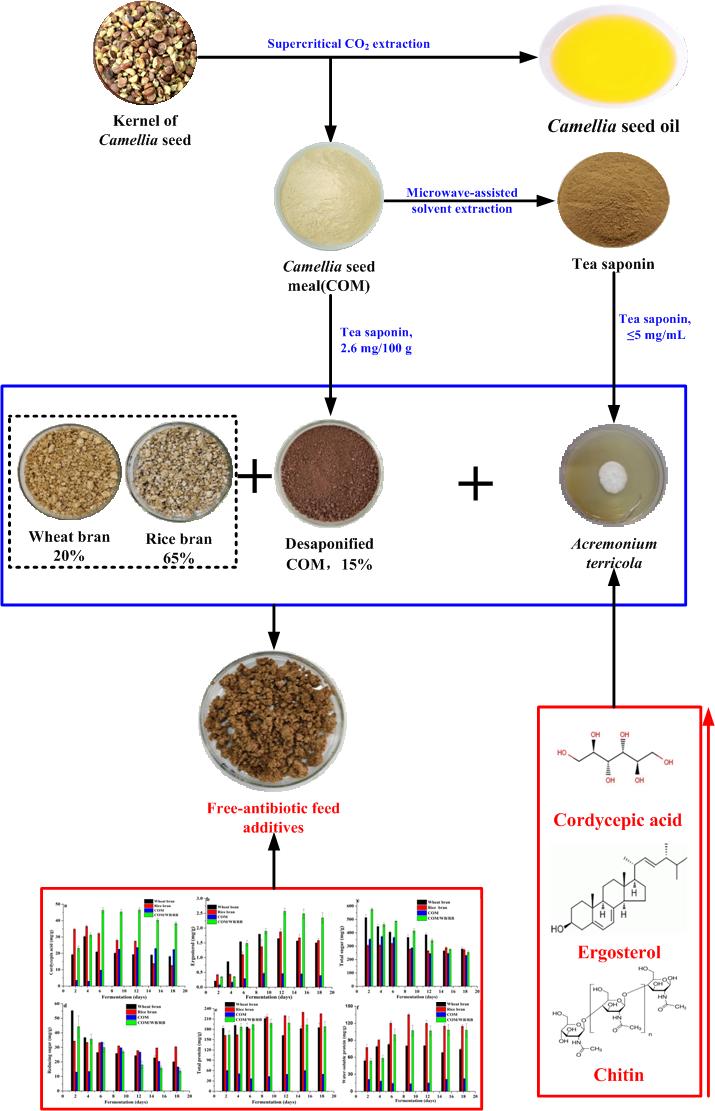
According to the reports (He et al. 2014) Microwave-assisted extraction has been used to extract tea saponin from COM and the content of tea saponin in COM decreased from 21.18% (mg/100 g) to 2.60% (mg/100 g).
In terms of cordycepic acid, RB and WB were more beneficial to the production of cordycepic acid than COM, especially in the early fermentation stage (Fig. 8a). The cumulative amount of cordycepic acid reached the maximum value on the 4th day for solid-fermentation using WB (30.33 mg/) and RB (36.55 mg/), then its accumulation decreased to 18.05 mg/g and 12.50 mg/g on the 18th day (Fig. 8a), respectively. When COM was used as the substrate, the maximum of 23.51 mg/g was reached only after 12 days of solid-fermentation and remained with 22.32 mg/g on 18th day. These results demonstrated that RB and WB were unfavorable for cordycepic acid accumulation in the late stage but favorable for fast production of cordycepic acids in the early stage, while COM was just the opposite (Fig. 8a). When combinations (COM/RB/WB = 15/65/20) was used as the substrate, the cumulative amount of cordycepic acid reached 23.13 mg/g, 46.33 mg/g, 46.56 mg/g and 38.26 mg/g on the 2nd, 6th, 12th and 18th day of solid-fermentation (Fig. 8a), respectively, with maximum that was 1.54, 1.27, and 1.98 times higher than those of WB, RB, and COM, respectively. These results demonstrated that combinations (COM/RB/WB = 15/65/20) was favorable for cordycepic acid production and accumulation.
As far as ergosterol was concerned, RB and WB are more beneficial to the production of ergosterol than COM (Fig. 8b). When WB, RB and COM was used as the substrate, the ergosterol content reached the maximum values of 1.79 mg/g, 1.88 mg/g and 0.47 mg/g on the 9th, 12th and 9th day (Fig. 8b), respectively, and its accumulation did not change significantly with the extension of fermentation time. These results showed that WB and RB were more favorable to ergosterol production than COM. When combinations (COM/RB/WB = 15/65/20) was used as the substrate, the cumulative amount of ergosterol reached 0.347 mg/g, 1.487 mg/g, 2.658 mg/g and 2.346 mg/g on the 2nd, 6th, 12th and 18th day of solid-fermentation, respectively, with maximum that was 1.43, 1.37, and 5.52 times higher than those of WB, RB, and COM, respectively. These results showed that combinations (COM/RB/WB = 15/65/20) was favorable for ergosterol production and accumulation.