Overall, there were 48,653 patient visits from 2010-2019 (Figure 1). Of these, 17,490 patients were included in the analysis who were aged 18 and older and had a suspected infection. In total, 3,323 patients were defined as having sepsis based on qSOFA scores of 2 or greater. Loss to follow-up analysis was stratified by disposition as the emergency unit overall experienced fundamentally different rates of loss to follow-up for admitted (n=702 of 11,927, 5.9%) and discharged patients (n=2,748 of 5,403, 50.9%). Admitted patients were visited in person by research assistants, and follow-up for discharged patients relied on patients owning and answering mobile phones. When comparing septic and non-septic patients by disposition, admitted patients in both groups had similar loss to follow up (5.8% vs. 6.0%, p=0.75), while discharged patients with sepsis were less likely to be lost to follow up than non-septic patients (n=128 of 340, 37.7% vs. n=2,620 of 5,063, 51.8%, p<0.001). The overall mortality rate for combined septic and non-septic discharged patients with follow-up was low with only 4 deaths (n=4 of 2,657, 0.15%) over the 10 years of the study.
The annual number of visits for all patients, patients with suspected infections and with malarial and non-malarial sepsis are displayed in Figure 2. The prevalence of sepsis for patients aged 18 years or older during the study period was 10.4% for all emergency unit visits. The annual proportion of all visits with suspected infections decreased from 61.7% in 2010 to 51.0% in 2019, with the proportion of those with suspected infections and meeting sepsis criteria decreasing from 16.4% in 2010 to 4.7% in 2019. Non-malarial sepsis decreased from 12.1% in 2010 to 4.6% in 2019. Malarial sepsis (combined “smear-positive” and “clinical”) had an even more pronounced decrease from its peak of 6.5% in 2013 to 0.3% in 2019. The proportions in Figure 2 were calculated using all emergency unit patient visits as a denominator (n=31,856) to describe overall emergency unit trends. All subsequent analyses were restricted to patients with suspected infection (n=17,490).
Characteristics of septic and non-septic patients with suspected infection were compared (Table 1).
Table 1: Characteristics of Non-Septic (qSOFA<2) and Septic (qSOFA≥2) Emergency Unit Patients With Suspected Infections (N = 17,490)
|
|
No Sepsis (qSOFA < 2)
|
Sepsis (qSOFA ≥ 2)
|
p-Value
|
|
|
n=14,167
|
n=3,323
|
|
|
|
|
|
|
Age, median (IQR)
|
43 (26-68)
|
40 (27-60)
|
<0.001†
|
|
Age Group
|
|
|
|
|
18-64 years old, total (%)
|
10086 (71.2)
|
2642 (79.5)
|
<0.001
|
|
65+ years old, total (%)
|
3991 (28.1)
|
661 (19.9)
|
<0.001
|
|
Female, total (%)
|
7327 (51.8)
|
1803 (54.3)
|
0.009
|
|
|
|
|
|
|
Systolic Blood Pressure, mean (95% CI)
|
119.5 (119.2 - 119.9)
|
93.6 (93.1 - 94.1)
|
<0.001††
|
|
Heart Rate, mean (95% CI)
|
92.1 (91.8 - 92.5)
|
105.1 (104.2 - 105.9)
|
<0.001††
|
|
Respiratory Rate, mean (95% CI)
|
21.9 (21.8 - 22.0)
|
28.8 (28.6 - 29.1)
|
<0.001††
|
|
Oxygen Saturation, mean (95% CI)
|
95.3 (95.2-95.4)
|
92.4 (92.1-92.7)
|
<0.001††
|
|
|
|
|
|
|
qSOFA Criteria
|
|
|
|
|
Respiratory rate ≥ 22 breaths per minute, n (%)
|
4457 (31.5)
|
3207 (96.5)
|
<0.001
|
|
Systolic blood pressure ≤ 100 mmHg, n (%)
|
837 (5.9)
|
1532 (46.1)
|
<0.001
|
|
Altered mentation (GCS < 15 or AVP ≠ A), n (%)
|
244 (1.7)
|
441 (13.3)
|
<0.001
|
|
|
|
|
|
|
Co-existing Infections
|
|
|
|
|
Malaria: Smear-Positive, n (%)
|
2223 (15.7)
|
690 (20.8)
|
<0.001
|
|
Malaria: Clinical, n (%)
|
1880 (13.3)
|
467 (14.1)
|
0.24
|
|
HIV, n (%)
|
1266 (8.9)
|
708 (21.4)
|
<0.001
|
|
|
|
|
|
|
Clinician Impression, n (%)
|
|
|
|
|
"Not Sick"
|
7753 (55.1)
|
951 (28.8)
|
<0.001
|
|
"Sick"
|
6109 (43.4)
|
2178 (66.0)
|
<0.001
|
|
"Toxic"
|
211 (1.5)
|
171 (5.2)
|
<0.001
|
|
|
|
|
|
|
Disposition, n (%)
|
|
|
|
|
Admitted
|
8999 (63.5)
|
2927 (88.1)
|
<0.001
|
|
Discharged
|
5063 (35.7)
|
340 (10.2)
|
<0.001
|
|
Expired in ED
|
47 (0.3)
|
35 (1.1)
|
<0.001
|
|
Operating Theater
|
58 (0.4)
|
21 (0.6)
|
0.11
|
|
|
|
|
|
|
† Wilcoxon rank-sum used as test of significance
|
|
|
|
†† T-test used as test of significance
|
|
|
|
|
All others use Fisher's exact test as test of significance
|
There were significant differences between the groups, with septic patients being younger, more likely to be female, more likely to have abnormalities in all vital signs (blood pressure, heart rate, respiratory rate, oxygen saturation, mental status), more likely to be coinfected both with HIV and malaria, more likely to have a clinician impression of “Serious” or “Critical” illness, and more likely both to be admitted to the hospital and to die in the emergency unit. Levels of missing data were generally low: age (n=110, 0.63%), gender (n=12, 0.07%), blood pressure (n=681, 3.89%), heart rate (n=515, 2.94%), respiratory rate (n=1,460, 8.35%), oxygen saturation (n=1,338, 7.65%), and clinician impression of illness severity (n=118, 0.67%). Mental status was an exception with a high level of missing data (n=10,720, 62.7%).
The mortality and interventions in patients stratified by qSOFA score are displayed in Table 2 below. Interventions were incompletely captured for the 3,942 patients in the original Excel database from 2010 – 2012, therefore analysis of interventions in sepsis over time was restricted to the 13,548 patients recorded in the Access database from 2012 – 2019. Increasing qSOFA scores were associated with higher rates of death and higher rates of receiving both fluids and anti-infectives. The dichotomous splitting of patients into “No Sepsis” and “Sepsis” using the cutoff of qSOFA≥2 shows the same clinically and statistically significant associations.
Table 2: Interventions and mortality for patients 2012-2019 stratified by qSOFA score (n=13,549)
|
|
qSOFA Score
|
Dichotomous qSOFA Score
|
|
|
Zero
|
One
|
Two
|
Three
|
p-Value
|
No Sepsis (< 2)
|
Sepsis (≥ 2)
|
p-Value
|
|
|
|
|
|
|
|
|
|
|
|
Total Cases, n
|
5855
|
5331
|
2229
|
133
|
n/a
|
11186
|
2362
|
n/a
|
|
Total Deaths, n
|
65
|
215
|
189
|
27
|
n/a
|
280
|
216
|
n/a
|
|
Crude Mortality Rate, % [95% CI]
|
1.1 [0.9 -1.4]
|
4.0 [3.5 - 4.6]
|
8.5 [7.4 – 9.7]
|
20.3 [13.8 - 28.1]
|
<0.001†
|
2.5 [2.2 - 2.8]
|
9.1 [8.0 - 10.3]
|
<0.001††
|
|
|
|
|
|
|
|
|
|
|
|
Proportion receiving interventions, (%)
|
|
|
|
|
|
|
|
|
|
Neither fluids nor anti-infectives
|
3565 (60.9)
|
2168 (40.7)
|
505 (22.7)
|
18 (13.5)
|
0.08†
|
5733 (51.3)
|
523 (22.1)
|
<0.001**
|
|
Fluids only
|
837 (14.3)
|
1092 (20.5)
|
528 (23.7)
|
29 (21.8)
|
0.009†
|
1929 (17.2)
|
557 (23.6)
|
<0.001**
|
|
Anti-infectives only*
|
794 (13.6)
|
966 (18.1)
|
380 (17.1)
|
16 (12.0)
|
0.004†
|
1760 (15.7)
|
396 (16.8)
|
0.22**
|
|
Both fluids and anti-infectives
|
659 (11.3)
|
1105 (20.7)
|
816 (36.6)
|
70 (52.6)
|
0.06†
|
1764 (15.8)
|
886 (37.5)
|
<0.001**
|
|
|
|
|
|
|
|
|
|
|
|
† ANOVA used as test of significance
|
|
|
|
|
|
|
|
|
|
†† T-test used as test of significance
|
|
|
|
|
|
|
|
|
|
* Anti-infectives include antibiotics, antivirals and/or antimalarials
|
|
|
|
|
|
|
** Fisher's exact test used as test of significance
|
|
|
|
|
|
|
|
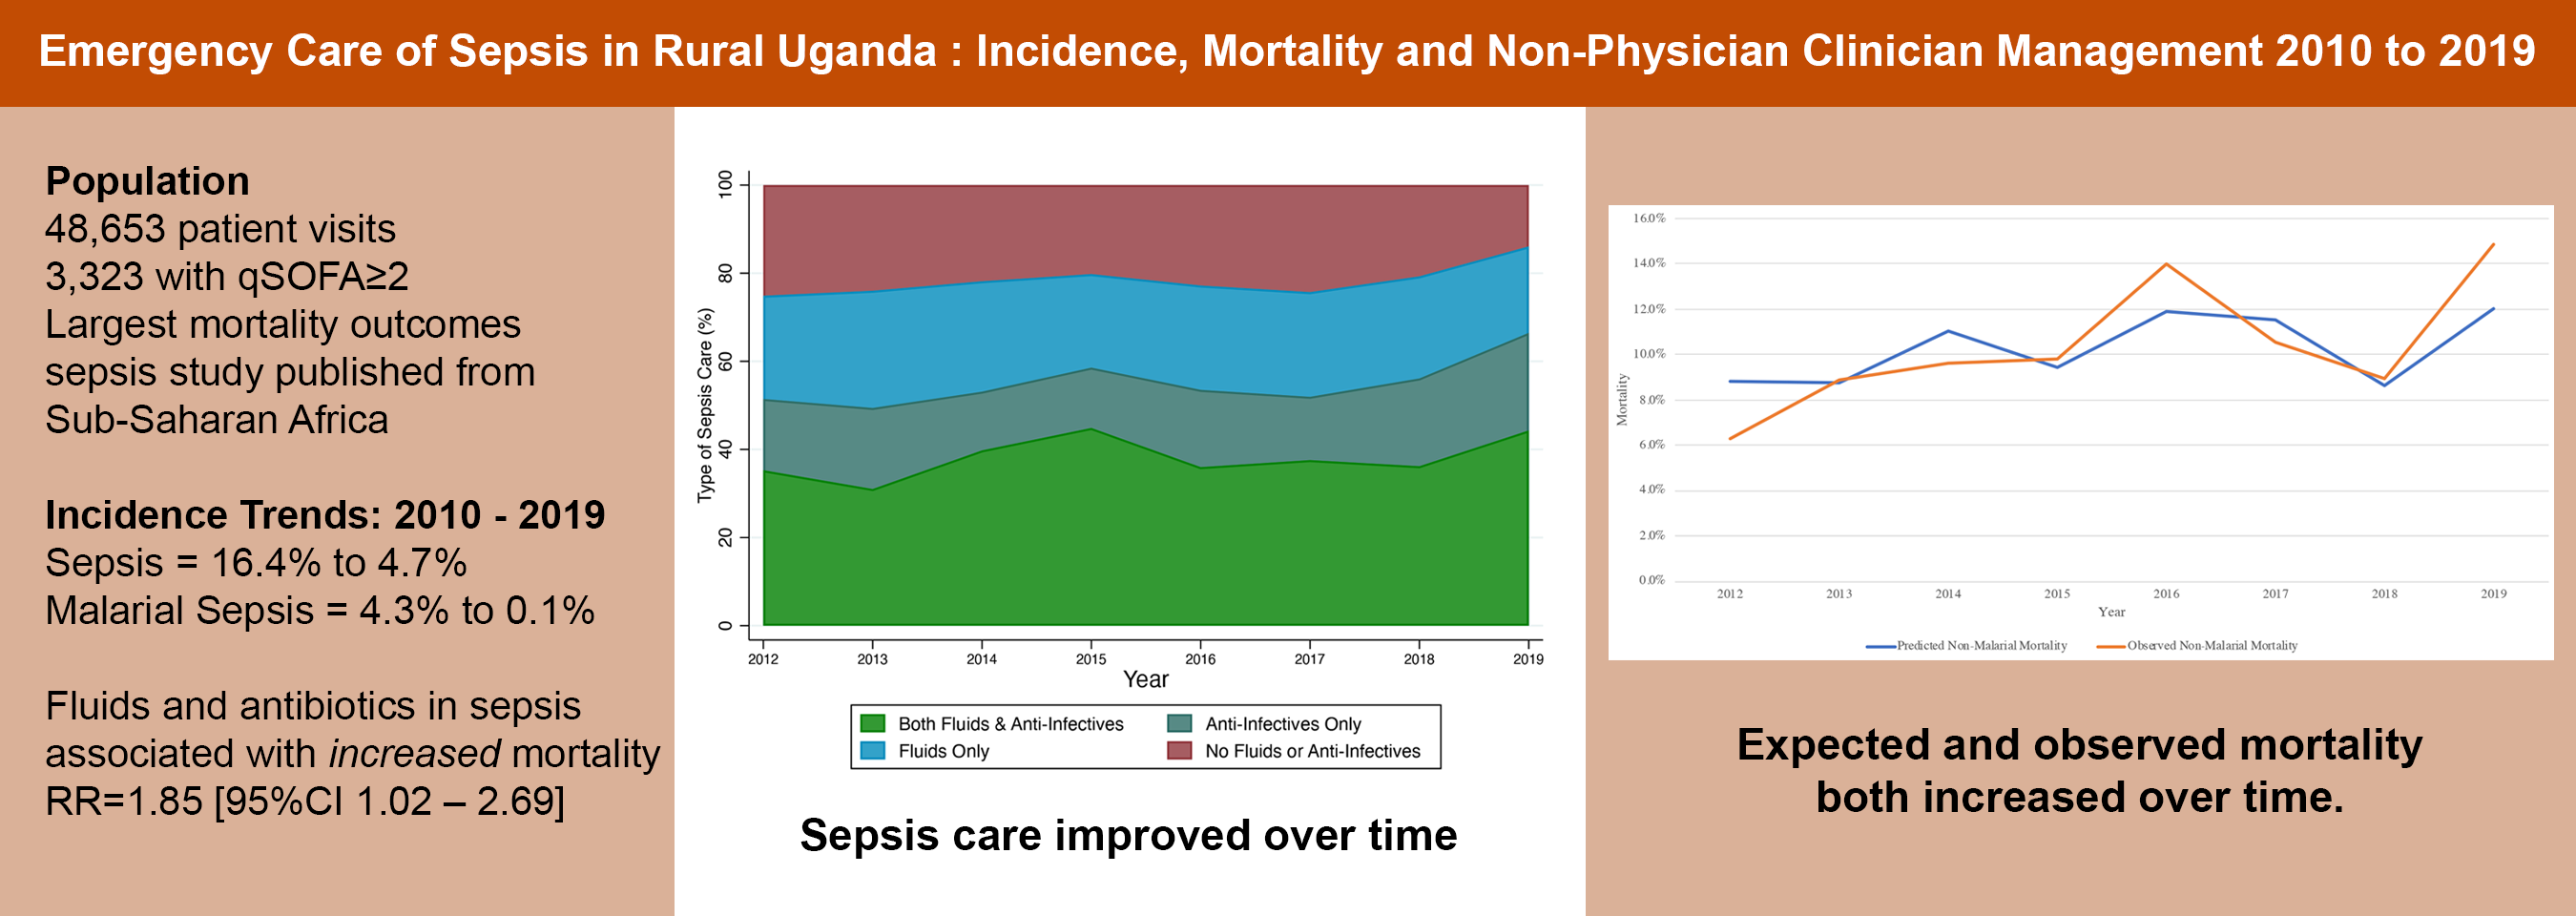
Figure 3 displays the annual trends in sepsis management and mortality from 2012-2019. The rates of receiving both fluids and anti-infectives increased (36.2% in 2012 to 44.7% in 2019), while the rates of receiving neither fluids nor anti-infectives in the emergency unit decreased (25.4% in 2012 to 13.8% in 2019). (Figure 3a) Over that same time period, sepsis mortality increased (6.2% in 2012 to 14.5% in 2019), while non-sepsis mortality remained stable (2.7% in 2012 to 2.2% in 2019).(Figure 3b) Mortality data for 2010 and 2011 are not included in Figure 3b for consistency with Figure 3a and are as follows: in 2010, non-sepsis mortality was 3.3% [95% CI 2.2 – 4.4] and sepsis mortality was 7.6% [95% CI 4.9 – 10.3]; in 2011 non-sepsis mortality was 2.6% [95%CI 1.8 – 3.4] and sepsis mortality was 6.8% [95%CI 4.5 – 9.1].
Figure 4 displays trends in prevalence and associated mortality for sub-groups of septic patients by year from 2010-2019. Across programme years, septic patients are more likely to be elderly and to have qSOFA scores of 3 (both higher mortality sub-groups), less likely to have malaria (a lower mortality sub-group) and equally likely to have hypotension (a much higher mortality sub-group).
To understand the relative impact of these changes in both septic patients and sepsis care, a multi-variable logistic regression model was created for septic patients. Patients with complete treatment data from 2012 – 2019 both with malaria (n=741) and without malaria (n=1621) were separated to identify independent predictors of mortality. Looking at malarial sepsis only, there were 54 deaths (7.3% mortality rate) in the 741 cases from 2012-2019. Further analysis of this data over time was limited by the precipitous drop in malaria incidence and deaths culminating in the years 2017-2019 having 31, 26 and 11 cases and two, three and one deaths respectively. Analysis of the impact of treatments was limited by the baseline group of “No treatment received in ED” having only one death in 156 cases, thus making comparisons unusably imprecise. Consequently, malaria was excluded from subsequent logistic regression analysis in this manuscript but is available as Additional file 2.
Table 3: Logistic Regression Model of Mortality in Septic (qSOFA≥2) Patients Without Malaria: 2012 – 2019 (N=1,621)
|
|
|
|
|
|
|
|
|
|
|
Log OR
|
95% CI
|
p-Value
|
|
|
|
|
|
|
|
|
|
|
|
|
Age
|
|
|
|
|
|
|
|
|
Additional Year (above 18)
|
1.01
|
1.00
|
-
|
1.02
|
0.019
|
|
|
|
|
|
|
|
|
|
|
|
|
HIV
|
|
|
|
|
|
|
|
|
Negative
|
REF
|
|
|
|
|
|
|
|
Positive
|
1.12
|
0.7
|
-
|
1.7
|
0.594
|
|
|
|
|
|
|
|
|
|
|
|
|
Gender
|
|
|
|
|
|
|
|
|
M
|
REF
|
|
|
|
|
|
|
|
F
|
0.45
|
0.3
|
-
|
0.7
|
<0.001
|
|
|
|
|
|
|
|
|
|
|
|
|
Respiratory Status
|
|
|
|
|
|
|
|
|
Normal Rate + No Hypoxia
|
REF
|
|
|
|
|
|
|
|
Normal Rate + Hypoxia (SpO2<92%)
|
1.27
|
0.4
|
-
|
4.0
|
0.684
|
|
|
|
Tachypnea (≥22 bpm) + No Hypoxia
|
1.79
|
0.4
|
-
|
7.5
|
0.431
|
|
|
|
Tachypnea (≥22 bpm) + Hypoxia (SpO2<92%)
|
4.13
|
1.3
|
-
|
12.9
|
0.015
|
|
|
|
|
|
|
|
|
|
|
|
|
Heart Rate
|
|
|
|
|
|
|
|
|
Normal
|
REF
|
|
|
|
|
|
|
|
Tachycardic (≥100 bpm)
|
1.56
|
1.1
|
-
|
2.3
|
0.022
|
|
|
|
|
|
|
|
|
|
|
|
|
Temperature
|
|
|
|
|
|
|
|
|
Hypothermic (≤ 35.5 °C)
|
2.07
|
1.4
|
-
|
3.1
|
0.001
|
|
|
|
Normal
|
REF
|
|
|
|
|
|
|
|
Febrile (≥ 37.5 °C)
|
0.59
|
0.4
|
-
|
0.9
|
0.024
|
|
|
|
|
|
|
|
|
|
|
|
|
Blood Pressure
|
|
|
|
|
|
|
|
|
Not Hypotensive
|
REF
|
|
|
|
|
|
|
|
Hypotensive (SBP<100)
|
1.82
|
1.3
|
-
|
2.6
|
0.001
|
|
|
|
|
|
|
|
|
|
|
|
|
Mental Status
|
|
|
|
|
|
|
|
|
Normal/Not Recorded
|
REF
|
|
|
|
|
|
|
|
Altered
|
1.46
|
0.9
|
-
|
2.3
|
0.102
|
|
|
|
|
|
|
|
|
|
|
|
|
Clinical Impression
|
|
|
|
|
|
|
|
|
"Not Sick"
|
REF
|
|
|
|
|
|
|
"Sick"
|
2.2
|
1.2
|
-
|
3.9
|
0.010
|
|
|
|
"Toxic"
|
6.7
|
3.2
|
-
|
13.8
|
<0.001
|
|
|
|
|
|
|
|
|
|
|
Looking at the multiple variable logistic regression model for non-malarial sepsis mortality (Table 3), the odds ratio (OR) of death was significantly increased seen in patients with advancing age, hypothermia, hypotension, tachycardia, with both hypoxia and tachypnea, and for patients with concerning clinical condition upon arrival (“Sick” and “Toxic”). There was a significantly reduced OR of death for patients who were female or febrile. The p-value for the Hosmer-Lemeshow goodness of fit test was 0.10, the Brier score was 0.079, and the AUROC was 0.80 (95%CI 0.77 - 0.83). The predicted mortality coefficients generated by this model were plotted against observed mortality across programme years and both predicted and observed mortality could be seen to increase across the study period (Figure 5).
The categorical variable for sepsis treatment in the emergency unit displayed visually in Figure 3a above (no treatment in the emergency unit, fluids alone, antibiotics alone, or both fluids and antibiotics) was added to the logistic regression model above to assess the independent association between treatments and mortality in all septic patients without malaria. All treatments for sepsis were associated with increased relative risk (RR) of death as compared to “no treatment in the emergency unit” after controlling for the variables in the logistic regression model above. The RR were as follows: “fluids alone” RR=1.22 [95%CI 0.57 – 1.87]; “antibiotics alone” RR=1.25 [95%CI 0.60 – 1.91]; “both fluids and antibiotics”: RR=1.85 [95%CI 1.02 – 2.69]. Only the RR associated with administration of “both fluids and antibiotics” reached statistical significance.