2.1 Correlation analysis among schistosomiasis and environmental factors
Based on the principle of chi-square binning, the upper limit of binning is set to 8, and the IV of different levels of influencing factors is calculated according to the binning situation (Table 3). When annual average temperature is 11.5–19.0°C, the annual average rainfall is 1000–1550 mm, the dryness is 66%-92%, and the wetness index is 45%-70%, schistosomiasis is more likely to occur. In this geographic environment, the risk of schistosomiasis transmission is higher when the distance from waterways is less than 2.5 km, the altitude is less than 100 m, the land use is paddy field, grassland, and water area, and the landform type is plain. Among the socio-economic variables, when population density is above 200, the GDP is over 100, and Night-time lights are above 0.12, then a situation exists that is more disease epidemic-prone. Extreme climate and geographic conditions are not conducive to the spread of schistosomiasis: for example, annual rainfall of less than 1000 mm or more than 1550 mm, annual average temperature of less than 11.5°C or more than 19°C, average temperature during the hottest season of less than 27°C, rainfall in the wettest season of less than 500 mm, and distance to the waterway of more than 3 km, with a slope greater than six (Table 4).
Table 3
Number and meaning of environmental factor classification based on the principle of chi-square binning
|
Factors
|
Number
|
Classification index
|
|
AAP (mm)
|
8
|
< 850;850–950;950–1000;1000–1350;1350–1450;1450–1500;1500–1550;>1550
|
|
AAT (℃)
|
8
|
< 11.5;11.5–16.0;16.0–17.0;17.0-17.5;17.5–18.0;18.0-18.5;18.5–19.0;>19.0
|
|
IM (%)
|
8
|
< 45;45–50;50–55;55–60;60–65;65–70;70–90;>90
|
|
AR (%)
|
8
|
< 62;62–66;66–68;68–72;72–74;74–92;92–95;>95
|
|
BIO2
|
8
|
< 7.3;7.3–7.8;7.8–7.9;7.9–8.2;8.2–8.6;8.6–9.3;9.3–9.9;>9.9
|
|
BIO7
|
8
|
< 24;24-27.5;27.5–29;29–31;31-31.5;31.5–33;33-33.5;>33.5
|
|
BIO10 (℃)
|
8
|
< 17;17–20;20–22;22–25;25-26.5;26.5–27;27–28;>28
|
|
BIO11 (℃)
|
8
|
< 5.8;5.8-6.0;6.0-6.2;6.2–6.4;6.4–6.6;6.6–7.6;7.6–8.6;>8.6
|
|
BIO16(mm)
|
8
|
< 440;440–460;460–480;480–500;500–520;520–540;540–560;>560
|
|
BIO17(mm)
|
8
|
< 20;20–50;50–130;130–140;140–155;155–160;160–175;>175
|
|
LF
|
6
|
Plains; terraces; hills; small undulating mountains; medium undulating mountains; large undulating mountains
|
|
LD
|
7
|
Paddy field; dry land; woodland; grassland; water area; urban and rural residential land; unused land
|
|
EL(m)
|
7
|
< 50;50–100;100–450;450–700;700–2150;2150–2500;>2500
|
|
SLOPE (°)
|
8
|
< 2;2–3;3–6;6–9;9–13;13–22;22–29;>29
|
|
DST (km)
|
8
|
< 0.5;0.5-1.0;1.0-1.5;1.5-2;2-2.5;2.5-3;3-3.5;>3.5
|
|
ANDVI
|
8
|
< 0.78;0.78–0.79;0.79–0.8;0.8–0.81;0.81–0.82;0.82–0.83;0.83–0.84;>0.84
|
|
GDP(10,000/km2)
|
7
|
< 50;50–100;100–150;150–250;250–350;350–800;800–1000;>1000
|
|
DP(Person/km2)
|
8
|
< 100;100–150;150–200;200–250;250–400;400–450;450–550;>550
|
|
NTL
|
8
|
< 0.08;0.08–0.10;0.10–0.12;0.12–0.14;0.14–0.16;0.16–0.18;0.18–0.54;>0.54
|
Table 4
Results for grading IV by environmental influencing factors
|
Grade
|
1
|
2
|
3
|
4
|
5
|
6
|
7
|
8
|
|
AAP
|
-1.435
|
-0.941
|
-0.789
|
0.223
|
0.901
|
1.219
|
0.118
|
-0.811
|
|
AAT
|
-2.970
|
0.411
|
0.647
|
0.693
|
0.544
|
1.067
|
0.582
|
-0.305
|
|
IM
|
-0.498
|
0.916
|
0.095
|
0.693
|
0.818
|
1.587
|
-0.288
|
-1.466
|
|
AR
|
-1.224
|
-0.693
|
0.836
|
0.773
|
0.383
|
0.228
|
-0.801
|
-1.447
|
|
BIO2
|
0.547
|
1.176
|
0.319
|
0.323
|
0
|
-0.553
|
-1.194
|
-1.269
|
|
BIO7
|
-0.406
|
-0.651
|
-1.504
|
-1.355
|
0.357
|
0.774
|
0.568
|
-1.082
|
|
BIO10
|
-2.773
|
-0.838
|
-0.693
|
-1.674
|
-0.827
|
-1.584
|
0.894
|
1.192
|
|
BIO11
|
-1.064
|
1.121
|
1.121
|
1.118
|
0.847
|
0.228
|
-0.773
|
-0.406
|
|
BIO16
|
-0.916
|
-0.074
|
-0.442
|
-1.065
|
0.598
|
0.223
|
0.811
|
0.180
|
|
BIO17
|
-2.110
|
-0.887
|
-0.203
|
0.499
|
1.421
|
0.767
|
0.534
|
-0.095
|
|
LF
|
0.950
|
1.068
|
0.766
|
-0.300
|
-0.742
|
-1.789
|
|
|
|
LD
|
0.347
|
0.169
|
-0.266
|
0.342
|
0.234
|
0.123
|
-1.634
|
|
|
SLOPE
|
0.841
|
0
|
-0.187
|
-1.099
|
-2.485
|
-0.821
|
-0.949
|
-1.946
|
|
DST
|
0.395
|
0.560
|
0.821
|
0.442
|
0.147
|
-0.406
|
0
|
-0.515
|
|
EL
|
0.959
|
0.195
|
-1.126
|
-0.167
|
-0.975
|
-0.651
|
-2.169
|
|
|
ANDVI
|
0.227
|
-0.105
|
-0.486
|
0.223
|
-0.452
|
-0.223
|
-1.299
|
-0.256
|
|
GDP
|
-1.052
|
-0.065
|
0.035
|
0.773
|
0.619
|
0.218
|
0.211
|
0.511
|
|
DP
|
-0.946
|
-0.102
|
-1.179
|
0.560
|
0.431
|
0.368
|
1.099
|
0.621
|
|
NTL
|
-0.887
|
-0.674
|
0.111
|
-0.827
|
0.143
|
0.470
|
0.186
|
0.450
|
2.2 Comparison of prediction results based on the seven models
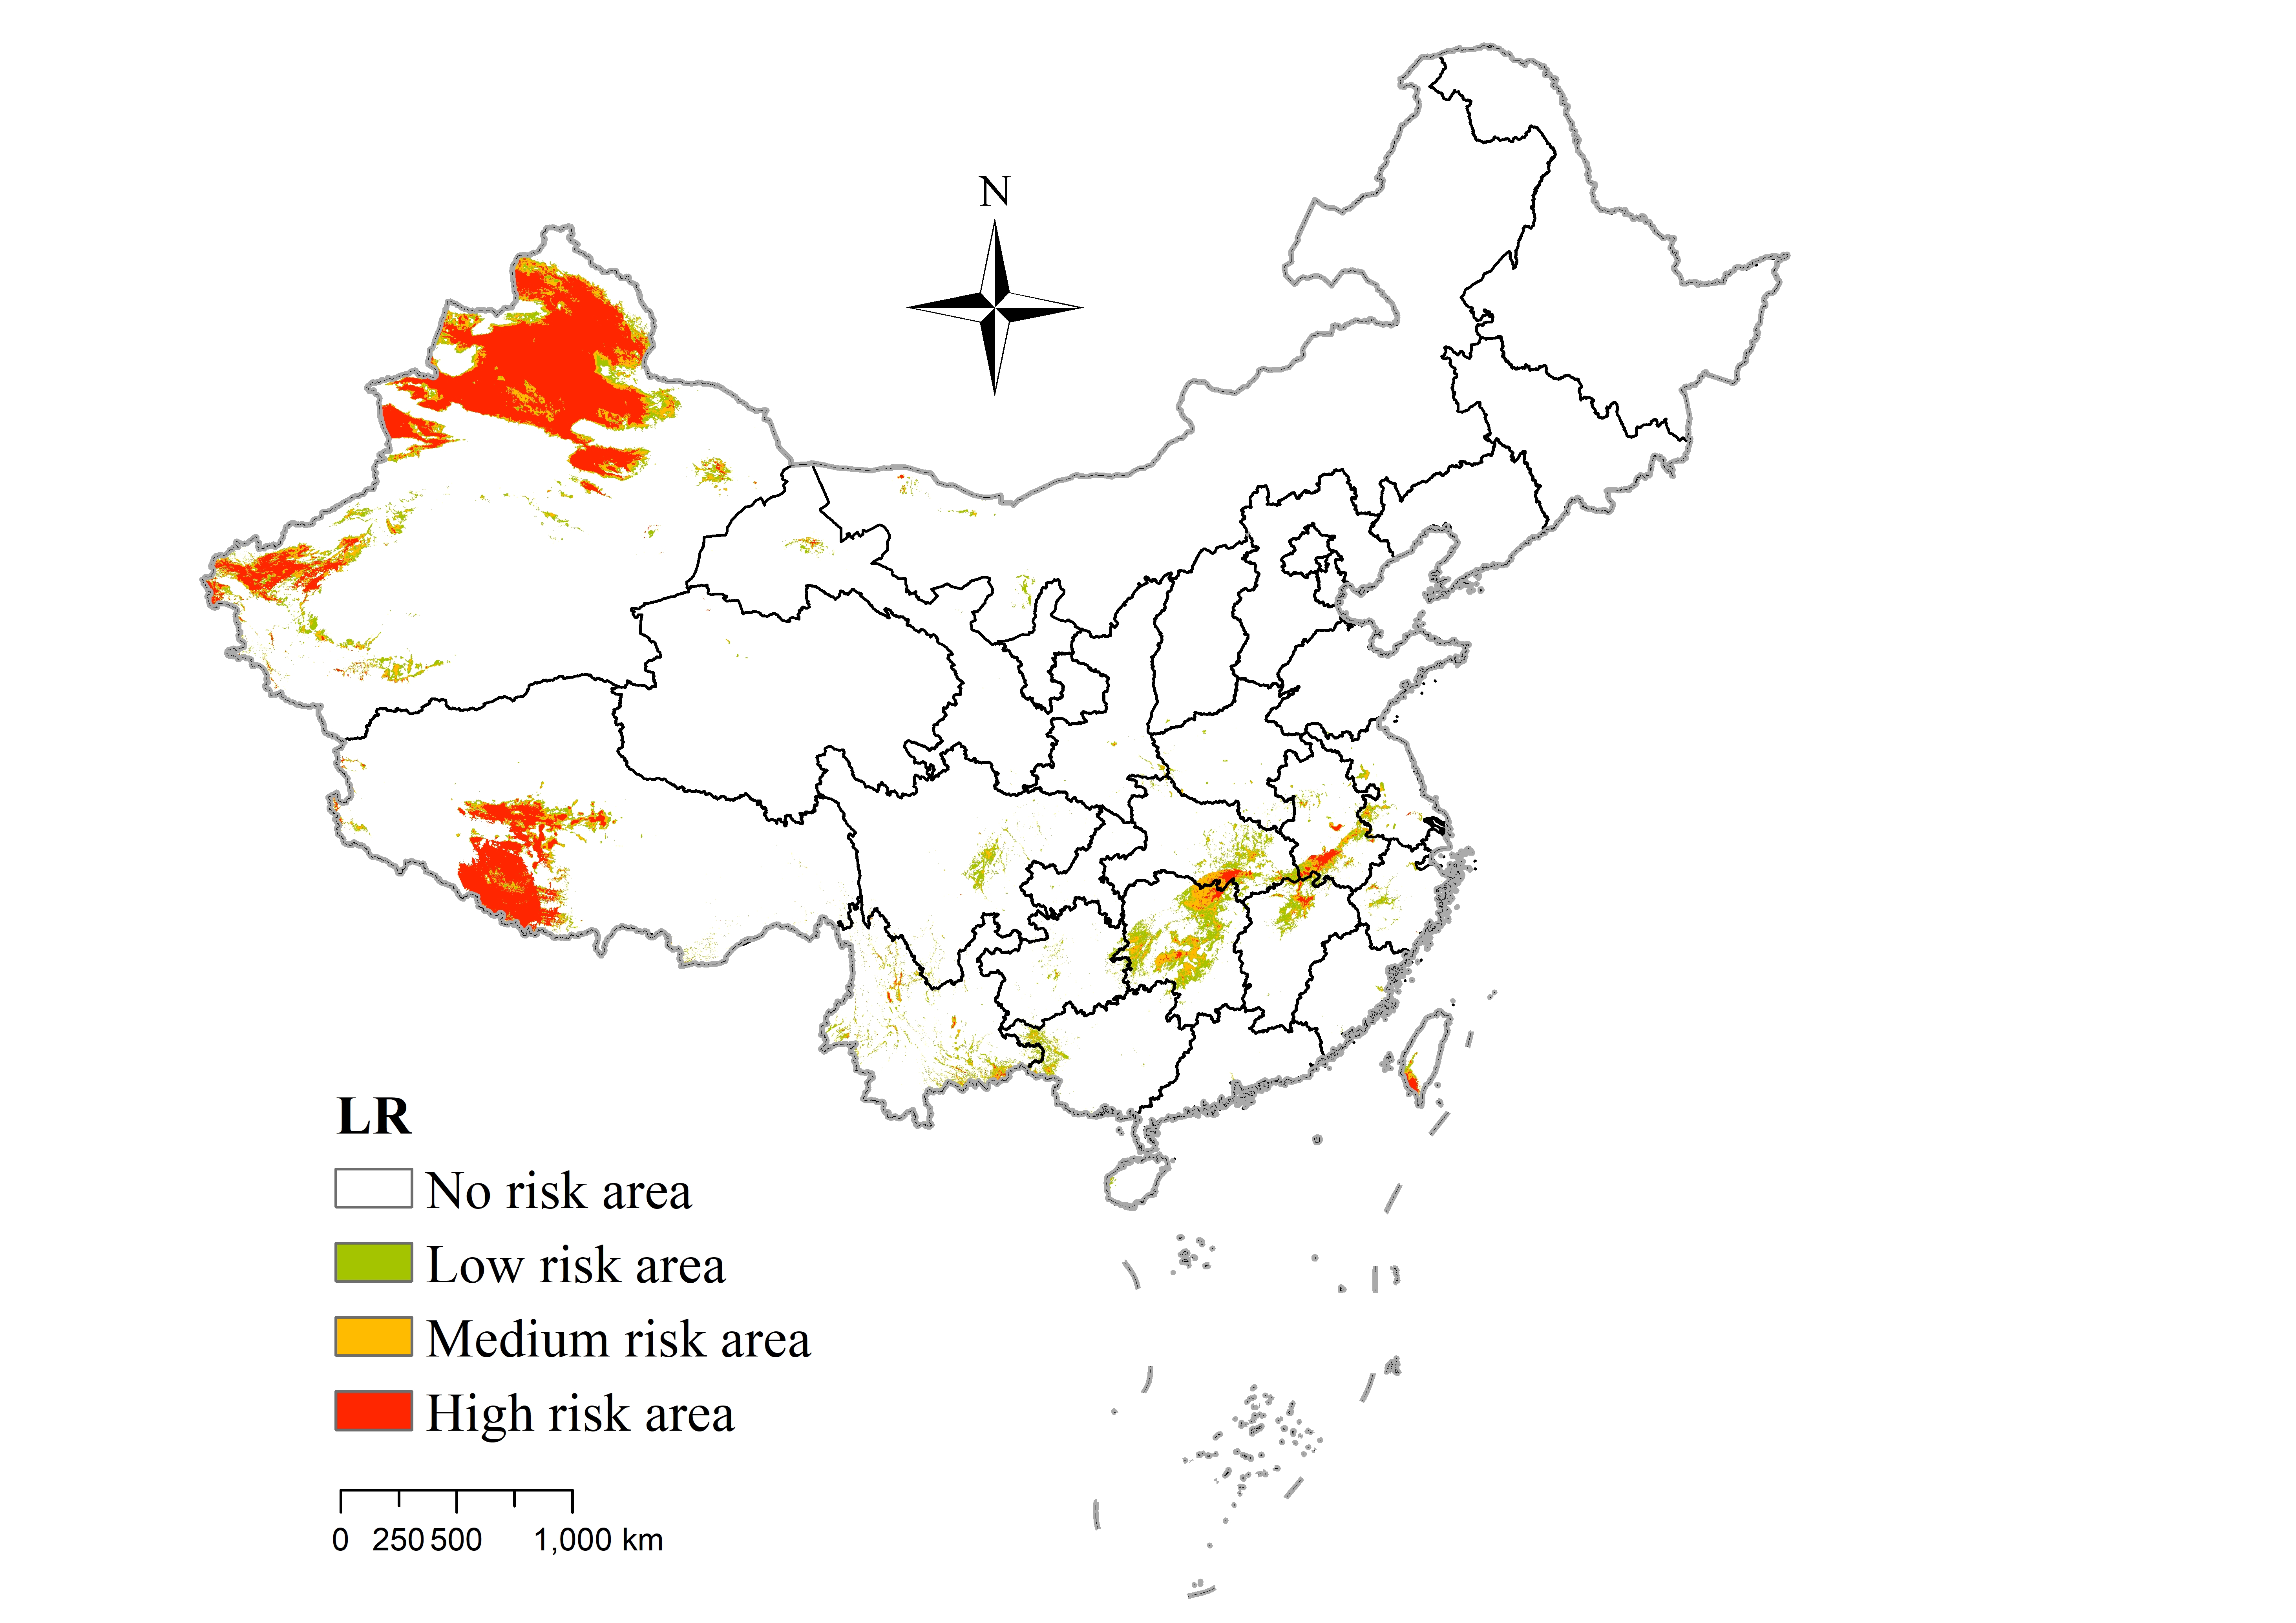
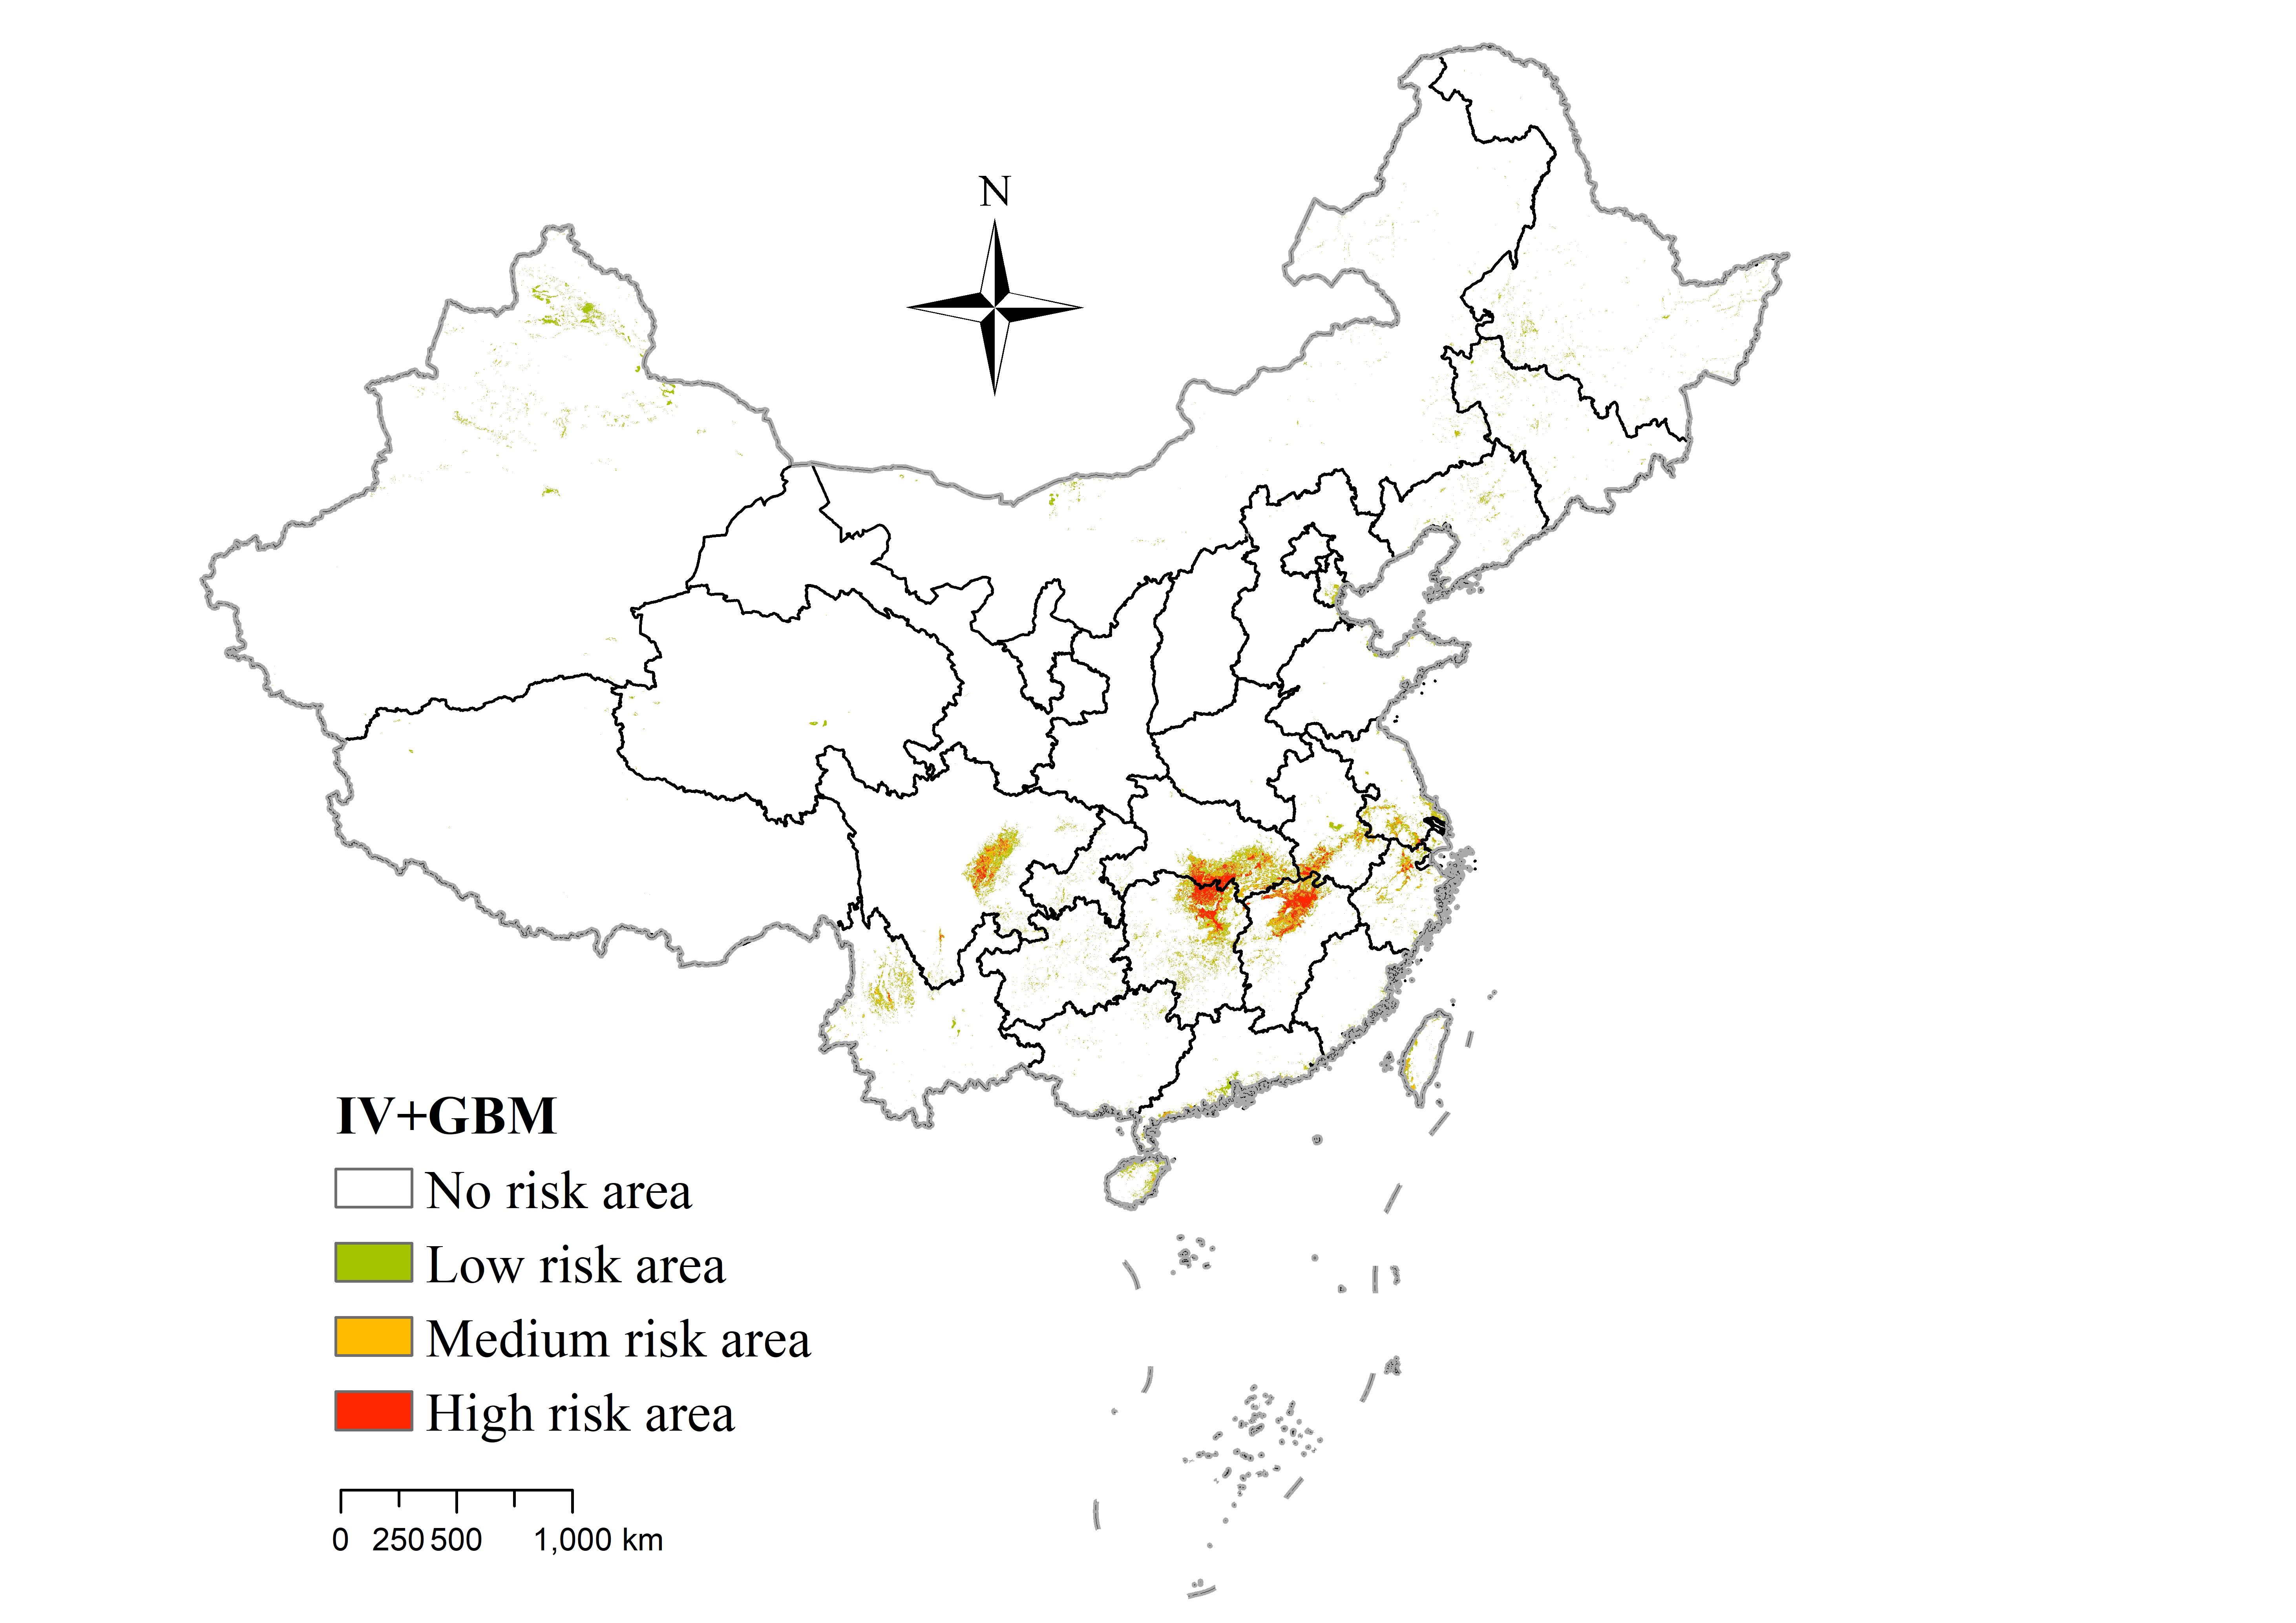
Prediction results for IV, by three machine learning models (LR, RF, GBM), and three coupled models (IV + LR, IV + RF, IV + GBM) are shown in Appendix 1, Figs. 1–7. IV shows that the schistosomiasis risk is widely distributed throughout the Yangtze River Basin and its southern areas. High-risk areas are mainly distributed in southern Hubei, northern Hunan, northwestern Jiangxi, and central Anhui. Prediction results for the three machine learning models had similarities and differences. The possibility for schistosomiasis transmission was mainly concentrated in the middle and lower reaches of the Yangtze River by three machine learning models. LR indicated the risk was also distributed in northern Xinjiang and southwestern Tibet. RF showed a lower risk in southern Guangzhou. GBM showed a lower risk in northern Xinjiang. Prediction results for the three coupled models were better than those for the single models. North of the Yangtze River there was no obvious abnormal risk, although small detail differences in risk areas were observed. For example, IV + RF showed no obvious risk area in central Sichuan or northwestern Yunnan, as opposed to IV + GBM.
The predicted performance for schistosomiasis by the seven models as judged by transmission risk, accuracy, AUC, and F1 for each model was calculated (Table 5). Sorted model prediction results were ordered as follows: AUC, IV + GBM > IV + RF > GBM > IV + LR > IV > RF > LR. Overall, the coupled models had the best results, followed by the three machine models, and then the information model. The best of the three machine learning models was GBM, and the best of the three coupled models was IV + GBM (accuracy = 0.878, AUC = 0.902, F1 = 0.920).
Table 5
Predictive performance indicators for the seven models
|
Model
|
IV
|
LR
|
IV + LR
|
RF
|
RF + IV
|
GBM
|
IV + GBM
|
|
Accuracy
|
0.732
|
0.790
|
0.815
|
0.785
|
0.820
|
0.849
|
0.878
|
|
AUC
|
0.750
|
0.827
|
0.853
|
0.840
|
0.872
|
0.859
|
0.902
|
|
F1
|
0.705
|
0.867
|
0.871
|
0.854
|
0.875
|
0.903
|
0.920
|
2.3 Risk prediction of schistosomiasis transmission in China based on the optimal coupled model
Prediction results for GBM + IV showed the risk of schistosomiasis in China to be scattered through a large spatial range, although clusters appeared in southeastern Hubei province, northeastern Hunan province, northern Jiangxi Province, central Anhui province, central Sichuan province, northwestern Yunnan province, and southern Jiangsu province. Superimposed on the national river map, risk areas were concentrated in the coastal areas of the middle and lower reaches of the Yangtze River, Poyang Lake region, and Dongting Lake region.
Classification of transmission risk shows that 4.66% of China is in an at-risk area and 95.34% is not. Risk areas can be divided into low-risk (2.47%), medium-risk (1.35%), and high-risk areas (0.84%). High-risk areas are primarily distributed in eastern Changde, western Yueyang, northeastern Yiyang, middle Changsha of the Hunan Province, southern Jiujiang, northern Nanchang, northeastern Shangrao, eastern Yichun in Jiangxi Province, southern Jingzhou, southern Xiantao, middle Wuhan in Hubei Province, southern Anqing, northwestern Guichi, eastern Wuhu in Anhui Province, middle Meishan, northern Leshan, and the middle of Liangshan in Sichuan Province (Fig. 3). Medium-risk areas and low-risk areas are distributed in areas adjacent to high-risk areas, as well as southern Jiangsu and northwestern Yunnan.
