EFNBA3, EFNA4, EFNB1, EPHB4, EPHB6 are identified as major expressed genes in DLBC
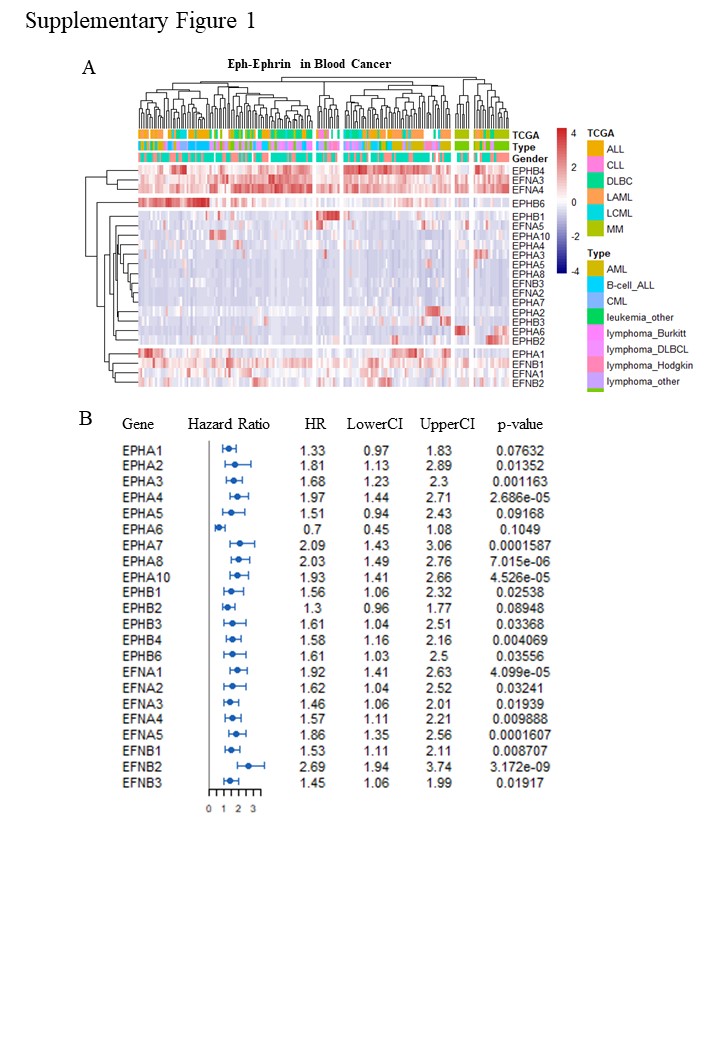
To evaluate the expression pattern of Eph-Ephrin, we first analyse RNA-seq data of all 22 Eph-Ephrin members in 130 leukemia and lymphoma cell lines from the CCLE database. We find EPHB4, EFNBA3, EFNA4, EFNB1 are genes high expressed in most cell lines. EPHB1, EPHA1 and others are found highly expressed in specific cell lines (Supplementary Fig. 1A). Moreover, EPHB4, EPHB6, EPHA1 are highly expressed in ALL/AML cell lines, while EPHB1 are highly expressed in a small group of uncertain classified cell lines. Then, we performed the same analysis in 39 DLBC cell lines. EFNBA3, EFNA4, EFNB1, EPHB4, EPHB6 are identified as major expressed genes in DLBC (Fig. 1A). Further, we select 10 widely used cell lines for expression pattern and PCA analysis, in which NAMALWA, SU-DHL-4, SU-DHL-6, SU-DHL-10, RAJI, DAUDI are classified in DLBC and THP-1, U-937, JURKAT, HL60 are classified in non-DLBC. We found EFNB1/EPHB6 and EFNBA3/EFNA4/EPHB4 are two significant differential expressed groups. The EFNBA3/EFNA4/EPHB4 group tends to be high expressed in DLBC cell lines, while the EFNB1/EPHB6/EPHA1 group are high expressed in non-DLBC cell lines (Fig. 1B). Further PCA analysis shows that EFNBA3/EFNA4/EPHB4 and EFNB1/EPHB6/EPHA1 are identified as two independent gene groups based on expression pattern.
Next, to determine the predictability of Eph-Ephrin members in prognosis, we analyzed microarray expression data of Lenz Staudt Lymphoma (GSE10846), which contains detailed available clinical data of 420 DLBC patients. Hazard Ratio and p value of 22 Eph-Ephrin members show most Eph-Ephrin members are significantly relative to patients’ prognosis (Supplementary Fig. 1B). Further, we focus on EFNBA3, EFNA4, EFNB1, EPHB4, EPHB6 according to their high expression in DLBC. Further, the combination of the 5 Eph-Ephrin genes (termed as ‘combined-5’) into over survival analysis shows more than 10 fold change in p value, which means the combined-5 has better performance in risk grouping than anyone of the 5 genes (Fig. 1D-E). From expression data we found low expression of EFNA3/EFNA4 are enriched in high-risk group with poor prognosis, in which EFNB1/EPHB4/EPHB6 are higher expression than low-risk group (Fig. 1F). These results indicate the expression data of EFNBA3/EFNA4/EFNB1/EPHB4/EPHB6 at mRNA level has the potential as diagnostic biomarkers to predict DLBC patients’ prognosis.
Integrative analysis of Eph-Ephrin and DLBC abnormal pathway by mining multi-omics data
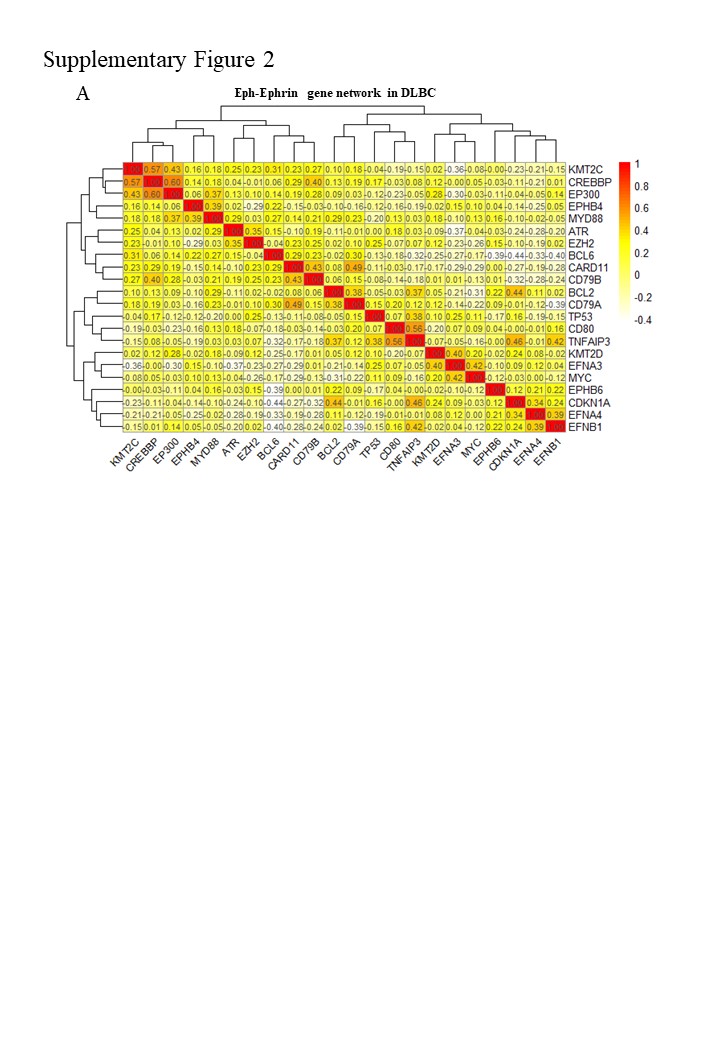
To predict functions of Eph-Ephrin genes in lymphomas, we integrate two types of expression data involving DLBC major abnormal genes/pathway. One is mRNA expression data obtained by RNA-seq, and the other is protein expression data obtained by RPPA. By integrating expression data of Eph-Ephrin genes, we expect to predict which DLBC pathway the Eph-Ephrin genes are involved in. Firstly, we analyze RNA-seq data of one DLBC signature gene-set and the five blood-specific Eph-Ephrin genes, involving 22 genes (termed as Eph-Ephrin gene network). Expression pattern of Eph-Ephrin gene network generates 4 clusters as following: cluster 1 is TP53/CDKN1A, cluster 2 is Eph-Ephrin involving groups in DLBC, cluster 3 is BCL6/CARD11/CD79A/CD79B, cluster 4 is BCL2/CD80/TNFAIP3 (Fig. 2A). As expected, all Eph-Ephrin genes are clustered in one group. 3 signatures on the basis of the expression pattern are characterized in 39 DLBC cell lines. High expression of cluster 2 and low expression of cluster 3 are characteristics of signature 1. High expression of cluster 4 are characteristic of signature 2. Medium expression of cluster 3 are characteristic of signature 3. Surprisingly, the other genes in the Eph-Ephrin group are transcriptional regulators (e.g. MYC) and epigenetic modulators (e.g. KMT2D/CREBBP/EP300/EZH2). Further correlation analysis shows independence of both the DLBC signature genes and Eph-Ephrin genes (Supplementary Fig. 2A).
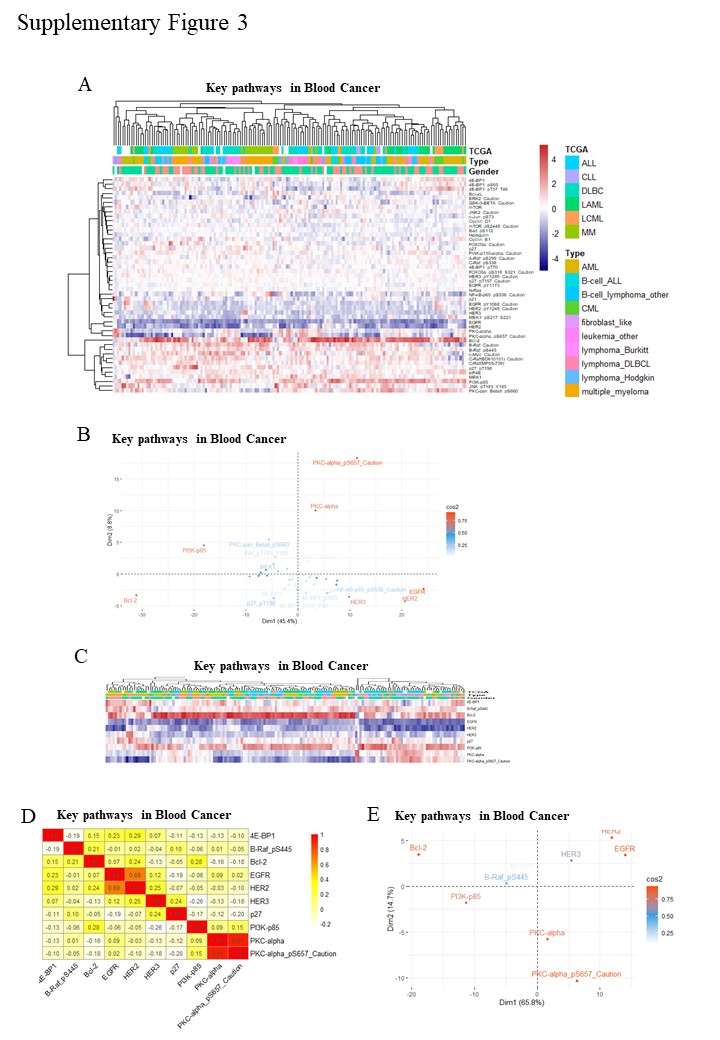
To confirm whether analysis results produced by RNA-seq data will be in line with protein data by RPPA/antibody (term as ‘Ab’). We further screen and set one DBLC signature by Ab panel, which consists of 10 Ab panel filtered from 47 Ab. First, we select 47 Ab that involving major DLBC pathway which are ErbB signaling pathway, B cell receptor signaling pathway and PI3K-Akt signaling pathway (Supplementary Table 1). Second, RPPA data of 47 Ab in blood cancer are analyzed by clustering, correlation coefficient, PCA (Supplementary Fig. 3A-B). Lastly, 10 independent Ab are selected as Ab panel of DBLC signature, analysis is performed both in blood cancer (Supplementary Fig. 3C-E) and DLBC (Fig. 3A-C). Furthermore, another RPPA data of 33 patients from the TCPA project is analyzed using the same 10 Ab data. We got similar correlation coefficient and PCA results generated from protein/RPPA data (Fig. 3D-F). Hence, the 10 DBLC signature of protein/RPPA data are well-established.
Next, we further integrate RNA-seq and RPPA data (term as ‘Expr-Ab’) to analyse Eph-Ephrin pattern, attempting to predict Eph-Ephrin function more accurately and reliably. Similar to the Eph-Ephrin gene network signature, 4 novel clusters based on Expr-Ab are generated as follows: Ab data PKCα and its phosphorylation at S657 are clustered into the BCL6/CARD11/CD79A/CD79B group; BCL2/CD80/TNFAIP3 in Eph-Ephrin gene network signature are divided into two groups in Expr-Ab signature. One is CD80/TNFAIP3 with Ab data phosphorylation of B-Raf at S445 and PI3K-p85. The other is a novel group consisting of Ab data EGFR/HER2/Bcl-2 and BCL2’s RNA-seq data. The last group is made up of the Eph-Ephrin genes, DNA Damage Response (DDR) genes (ATM/TP53/CDKN1A), Epigenetic modulator genes and others (Fig. 4A). 4 signatures on the basis of the expression pattern are characterized. Low expression of cluster 1 and high expression of cluster 4 are characteristic of signature 1. High expression of cluster 3 are characteristic of signature 2. Medium expression of cluster 1 are characteristic of signature 3. Medium expression of cluster 2/3 are characteristic of signature 4. Next, we analyse the expression pattern of Eph-Ephrin genes in DLBC Expr-Ab signature. We found Eph-Ephrin genes closely correlated with epigenetic modulators which are highly mutated genes in DLBC uncovered by whole-exon sequencing studies (Fig. 4B-C).
Drug Response Prediction by Expr-Ab signature involving Eph-Ephrin.
To evaluate prospects of Expr-Ab signature in clinical, drug response data from GDSC project are integrated to Expr-Ab signature analysis. Available Expr-Ab data and intact drug response data of 13 traditional/targeting drugs in 12 lymphoma cell lines are retrieved into analysis. The results show drug response pattern can be, to some extent, clustered and 5 specific Expr-Ab clusters are generated termed as ‘PI3K pathway’, ‘BCL6’, ‘MYC’, ‘Epigenetic Modulators’, ‘BCL2-HER2’ (Fig. 5A). The most remarkable Expr-Ab signature involves in high expression level of cluster ‘BCL6’, ‘MYC’, ‘Epigenetic Modulators’ in cell lines A3KAW and A4FUK, which are sensitive to most drugs. The most multiple resistant phenotype are enriched in high expression level of cluster ‘BCL2-HER2’ in cell lines GRANTA519 and KARPAS422.
For Eph-Ephrin genes, EPHB4 is clustering with BCL6, one feature gene in a subtype of DLBC; EFNA3/EFNA4 is clustering with MYC, another feature gene in a subtype of DLBC; EPHB6 is clustering with EZH2, which is a recent uncovered feature gene and a druggable drug targets; EFNB1 is clustering with epigenetic modulators including KMT2C/KMT2D/EP300/CREBBP, which underline the intrinsic connection of EFNB1 and epigenetic modulators. Targeting EFNB1 may be a shortcut to develop therapeutics treating epigenetic abnormal cancer.